 Multi-family
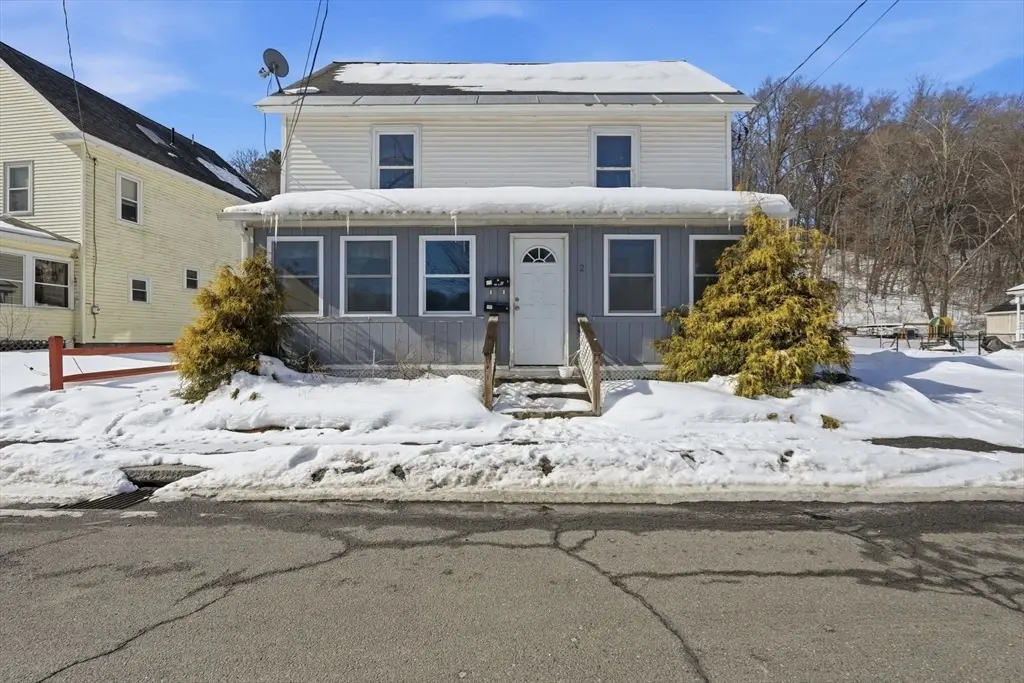
2 Water St · Greenfield, MA
Flood risk 1/10 · Minimal
- FEMA flood zone
- X
- Chance of flooding over 30 yrs
- 0.0%
- Est. flood insurance / yr
- $473 – $860
Fire risk 1/10 · Minimal
- Est. fire insurance / yr
- $915 – $1,699
Heat risk 3/10 · Minor
- Hot days now (above 96°F)
- 7 days/yr
- Hot days in 30 yrs
- 16 days/yr
Wind risk 4/10 · Minor
- Chance of severe wind over 30 yrs
- 15.0%
Air-quality risk 2/10 · Minimal
- Unhealthy air days now
- 0 days/yr
- Unhealthy air days in 30 yrs
- 1 days/yr
Risk factors via First Street. Map © Google.
Why this score? — see what drove the B- grade
The composite is a weighted blend of 9 inputs, each scored 0–100. Each bar is that input's sub-score; the figure is the points it added to the 100-point composite (weight × sub-score).
- Cash flow +30.0/30.0
- ARV discount +11.3/15.0
- DSCR +10.0/10.0
- 1% rule +8.9/10.0
- Rent growth +2.5/5.0
- Livability +2.5/5.0
- Condition / age +2.5/5.0
- Schools +2.0/10.0
- Appreciation +0.0/10.0
$250,000
🖨 Deal sheet 📄 Offer letter ✓ Due diligence
Multi-family units
County records classify this as Multi-Family (2-4 Unit). Listing-text estimate: 1 unit. estimate disagrees with records
Listing remarks MLS
INVESTORS TAKE NOTICE! Fantastic opportunity to own a 2-unit multi-family property in a prime, walk-to-town location. Whether you’re looking to expand your portfolio or dive into your next value-add project, this property offers tremendous potential.Each unit provides solid layout possibilities with separate utilities, and the chance to renovate, update, and maximize rental income or resale value. Conveniently located just steps from shops, restaurants, and local amenities, the location alone makes this a smart long-term investment.Bring your vision and ideas—this property is being sold as-is and is ready for its next chapter. Don’t miss the chance to unlock its full potential!
Key facts
- Local amenities
- Layout possibilities
- 4,752 sq ft lot
Tags
Neighborhood map
What this means for you Summary
Snapshot
- This is a 5-bed/2.0-bath multifamily listed at $250k.
Deal economics
- At list price, monthly cash flow is $1k ($12k/yr) — positive.
- The deal already cash-flows at list — no discount required.
- Meets the 1% rule at list price ($3k rent vs $250k).
- Recommended offer: $228k (9.0% below list) — sets the bar for market timing.
- Cap rate 11.2% vs local median 5.0% in Greenfield — top-decile yield for the area; either an underpriced asset or a hidden risk that comps aren't pricing in. Stress-test before assuming the spread holds.
Location & tenants
- Location reads: area grade B — affects rentability + tenant quality, not the cash-flow math above.
- Greenfield (town): math 15% / reading 32% proficiency, ranked #279 of 302 in MA (top 92%) — low school quality limits family demand, transient renter base, plan for 1-2y turnover.
- Market conditions: 18 active listings in the ZIP; 89 units permitted in Franklin County in 2024 (22 in 5+ unit buildings).
- At $3,486/mo this rent would consume 74% of the median local household income ($56k/yr) (locally 1270% of renters already pay >50% of income on rent) — very limited rent-growth headroom before tenants either downsize or default.
Forward outlook
- Local home prices are declining (-3.0%/yr); year-one equity from $2k of loan paydown is wiped out by about $8k of value loss. Plan a longer hold.
- Franklin County population projected at -20% by 2050 — secular population decline; favor cash flow + early exit over multi-decade hold.
- At projected returns (-3.0% appreciation + 3.0% rent growth), your $70k cash investment doubles in ~7 years — after that, you're playing with house money.
Negotiation context
- It's been on market 106 days — a 9% lower offer ($228k) is reasonable based on typical stale-listing flexibility.
- 2 sale attempts since 17y ago; this cycle's ask has dropped $30k (11%) from the opening price — seller is motivated, your offer sets the floor, not the list.
- Current owner paid $158k; list at $250k implies a 59% gain — meaningful room to come down on a strong offer.
Risks & watch-outs
- Watch-outs: built in 1905 — expect roof / HVAC / electrical / plumbing capex.
Questions for the listing agent
- It's been on market 106 days. Have you received any prior offers? Is the seller open to a 9% concession, seller financing, or rate buy-down credit?
- Built in 1905 — when were the roof, HVAC, electrical panel, plumbing, and water heater last replaced?
- Why hasn't it sold? Are there any deal-killer items the seller is aware of (foundation, flood, title, zoning, code violations)?
- Is there a deadline driving the sale (1031 exchange, divorce, estate, relocation)? That informs how much negotiation room exists.
- What's the average days-on-market for RENTAL listings here right now (not sales)? A rising rental-DOM trend means longer vacancies and softer asking-rent achievability than the comps imply.
- What's the recent tenant-quality profile in this submarket — average credit score on applications, eviction rate, late-payment / NSF rate, and stable-employment percentage? A property-management company in the area should have these aggregated.
- How much new apartment / multifamily construction is in the pipeline within 1–3 miles? Heavy new supply (>2% of stock underway) typically softens rents 12–24 months out; light construction supports rent growth.
Investment metrics
- 1% rule
- 1.39% ✓
- Cap rate
- 11.24%
- Cash-on-cash
- 17.68%
- DSCR
- 1.79
- GRM
- 6.0
CMA / ARV
- ARV (median comp)
- $273,006
- List price
- $250,000
- Delta
- -8.43%
- Verdict
- FAIR
- Comps
- 20 within 1.0 mi
Show comp detail 4 sales within ~0.75 mi
| Address | Dist | Beds/Ba | Sqft | Sold | Price | $/sf | Match |
|---|---|---|---|---|---|---|---|
| 33 Mill St | 0.36mi | 4/2.0 (-1) | 1,816 (-0%) | 21mo | $100,000 | $55 | 60 |
| 35 Mill St | 0.36mi | 4/2.0 (-1) | 1,880 (+3%) | 17mo | $199,900 | $106 | 59 |
| 98-100 Hope St | 0.26mi | 6/2.0 (+1) | 2,013 (+10%) | 9mo | $390,000 | $194 | 58 |
| 231 Hope St | 0.40mi | 4/2.0 (-1) | 1,664 (-9%) | 11mo | $341,000 | $205 | 52 |
Match score weights: distance 35% · size 25% · config 20% · recency 20%. Top-matched comps best support the ARV.
Projected returns pro-forma
-3.0% appreciation · 3.0% rent growth · sell at horizon
- IRR
- 9.2%
- Equity multiple
- 1.36×
- Total profit
- $25,219
- Equity at exit
- $37,276
- IRR
- 18.3%
- Equity multiple
- 2.52×
- Total profit
- $106,736
- Equity at exit
- $21,615
Cash invested: $70,000 (down + closing). Projections, not guarantees.
Landlord ↔ Tenant lean methodology
- Overall (STATE)
- 20 Strongly Tenant-Friendly
- State Massachusetts
- 20 Strongly Tenant-Friendly · D+15
- County
- — inherits STATE
- City
- — inherits STATE
ZIP-level market 01301
- Home prices YoY
- -24.0%
- Active inventory
- 18
- Price-to-rent
- 12.0×
Monthly cashflow live
- Estimated rent
- $3,486 medium interval (Pro) →
- Mortgage (P&I)
- −$1,311
- Tax from tax record
- −$308 /mo · $3,690/yr
- Insurance
- −$104
- HOA
- −$0
- Vacancy / Maint / Mgmt
- −$732
- Net cashflow
- $1,031
Break-even live
2-unit breakdown (identical units grouped — click to expand)
| Units | Beds | Baths | Est. rent |
|---|---|---|---|
| 2× units | 2 | 1 | $3,486 |
| #1 | 2 | 1 | $1,743 |
| #2 | 2 | 1 | $1,743 |
| Total (2 units) | $3,486 | ||
UW: 25.0% down · 7.5% · 30yr · 1.5% tax · 5.0% vac · 8.0% maint · 8.0% mgmt
Financing live
Cash to close
- Down payment
- $62,500
- Closing costs
- $7,500
- Reserves months
- —
- Total cash needed
- —
Loan-product check · same deal, 3 products live
Conventional
25% down · 7.5% · 30yr
- Down + closing
- —
- Monthly P&I
- —
- Monthly cashflow
- —
- DSCR
- —
- Eligible?
- —
Personal DTI + credit; lowest rate.
DSCR
20% down · 8.5% · 30yr
- Down + closing
- —
- Monthly P&I
- —
- Monthly cashflow
- —
- DSCR
- —
- Eligible?
- —
No personal income docs; deal must DSCR.
Hard money
10% down · 12.0% · 12mo
- Down + closing
- —
- Monthly P&I
- —
- Monthly cashflow
- —
- DSCR
- —
- Eligible?
- —
Short-term bridge; refi at stabilization.
Listing history 22 events
-
2026-06-18days on market $250,000 Active 106 DOM
-
2026-06-17days on market $250,000 Active 105 DOM
-
2026-06-16days on market $250,000 Active 104 DOM
-
2026-06-15days on market $250,000 Active 103 DOM
-
2026-06-14days on market $250,000 Active 101 DOM
-
2026-06-13days on market $250,000 Active 100 DOM
-
2026-06-10days on market $250,000 Active 98 DOM
-
2026-06-09days on market $250,000 Active 97 DOM
-
2026-06-08days on market $250,000 Active 96 DOM
-
2026-06-07statusdays on market $250,000 Active 95 DOM
-
2026-06-03days on market $250,000 Extended 91 DOM
-
2026-06-02days on market $250,000 Extended 90 DOM
-
2026-06-01days on market $250,000 Extended 89 DOM
-
2026-06-01status $250,000 Extended 88 DOM
-
2026-05-31days on market $250,000 Active 88 DOM
-
2026-05-30days on market $250,000 Active 87 DOM
-
2026-03-27price $250,000 704-char remark
Show marketing remark (704 chars)
INVESTORS TAKE NOTICE! Fantastic opportunity to own a 2-unit multi-family property in a prime, walk-to-town location. Whether you’re looking to expand your portfolio or dive into your next value-add project, this property offers tremendous potential.Each unit provides solid layout possibilities with separate utilities, and the chance to renovate, update, and maximize rental income or resale value. Conveniently located just steps from shops, restaurants, and local amenities, the location alone makes this a smart long-term investment.Bring your vision and ideas—this property is being sold as-is and is ready for its next chapter. Don’t miss the chance to unlock its full potential!
-
2026-03-04$280,000 New 704-char remark
Show marketing remark (704 chars)
INVESTORS TAKE NOTICE! Fantastic opportunity to own a 2-unit multi-family property in a prime, walk-to-town location. Whether you’re looking to expand your portfolio or dive into your next value-add project, this property offers tremendous potential.Each unit provides solid layout possibilities with separate utilities, and the chance to renovate, update, and maximize rental income or resale value. Conveniently located just steps from shops, restaurants, and local amenities, the location alone makes this a smart long-term investment.Bring your vision and ideas—this property is being sold as-is and is ready for its next chapter. Don’t miss the chance to unlock its full potential!
-
2009-12-04soldstatus $157,500 375-char remark
Show marketing remark (375 chars)
Here is one of the finest two family homes available on the market. Impeccable condition both inside and out, newer systems throughout, 2 high efficency Buderus boilers installed new in 2006. Over $39,000 in improvements completed within the last five years. Within walking distance to downtown, public transportation, Green River and 2 playgrounds. Great off street parking.
-
2009-12-04soldstatus $157,500
Show marketing remark (375 chars)
Here is one of the finest two family homes available on the market. Impeccable condition both inside and out, newer systems throughout, 2 high efficency Buderus boilers installed new in 2006. Over $39,000 in improvements completed within the last five years. Within walking distance to downtown, public transportation, Green River and 2 playgrounds. Great off street parking.
-
2009-08-14$162,500 375-char remark
Show marketing remark (375 chars)
Here is one of the finest two family homes available on the market. Impeccable condition both inside and out, newer systems throughout, 2 high efficency Buderus boilers installed new in 2006. Over $39,000 in improvements completed within the last five years. Within walking distance to downtown, public transportation, Green River and 2 playgrounds. Great off street parking.
-
2003-05-30soldstatus $106,250
ⓘ Source: listings_history table (triggers on properties + properties_extension) + one-shot
backfill from property_details.listing_events for pre-trigger history.
Tax reassessment forecast MA · Partial reset (capped growth)
- Current annual tax
- $3,690 · $308/mo
- Projected year-2 tax
- $3,690 · $308/mo
- Expected delta
- $0/yr ($0/mo · 0.0%)
ⓘ Screening estimate from a state-policy table — verify with the county assessor before closing.
Climate risk First Street
- Flood 1/10 Low FEMA zone X · 0% chance over 30 yrs
- Wildfire 1/10 Low
- Heat 3/10 Moderate 7 d/yr ≥96°F today · 16 d/yr by 30 yrs out
- Wind 4/10 Moderate 15% chance of damaging wind over 30 yrs
- Air quality 2/10 Low 0 unhealthy d/yr today · 1 by 30 yrs out
Nearby sold comps map
Loading sold comps map…
Walkable amenities ~0.75 mi
Loading nearby amenities…
Taxation est. · year 1
- Rental income
- $41,832
- − Mortgage interest
- −$14,004
- − Property taxes
- −$3,690
- − Insurance
- −$1,250
- − Repairs & maintenance
- −$3,347
- − Management
- −$3,347
- − Depreciation
- −$7,273
- Taxable income
- $8,922
- Est. tax owed @ 24.0%
- −$2,141
- After-tax cash flow
- $10,234/yr
For passive investors: Depreciation is non-cash, so a rental often shows a tax loss while cash-flowing — sheltering income. Rental losses are passive: they offset passive income freely, and up to $25,000/yr can offset ordinary (W-2) income if you actively participate and your MAGI is under $100k (phasing out to $0 by $150k); unused losses carry forward. On sale, claimed depreciation is recaptured at up to 25%, and gains may owe capital-gains tax (a 1031 exchange can defer both). Figures are a year-1 estimate at your 24.0% rate — not tax advice; consult a CPA.
Schools (NCES district)
- District
- Greenfield
- NCES district ID
- 2505490
- Math proficiency
- 15% ▼ -15.00%
- Reading proficiency
- 32% ▼ -1.00%
- Median HH income
- $46,910
- Composite
- 20.45/100
- National rank
- #8580
- State rank
- #279 of 302 in MA
Livability — Greenfield
No livability data for this city. (Only ~50 U.S. cities are tracked.)
Census & demographics
- Census place
- Greenfield, MA
- County
- Franklin County · 17,876 people
- City population
- 17,876
- Metro
- Springfield, MA
- Population (ZIP)
- 17,876
- Household income
- $56,176
- Rent vs Own
- Severe rent burden
- 1270.0
Population outlook (Franklin County) Hauer SSP2
- Today (2025)
- 68,566 people
- By 2030
- 66,543 · -3.0%
- By 2040
- 60,766 · -11.4%
- By 2050
- 54,971 · -19.8%
- By 2075
- 42,642 · -37.8%
- By 2100
- 31,861 · -53.5%
Race, ethnicity, and origin ACS 2023
- Neighborhood character
- Predominantly White (87%)
- Race & ethnicity
- White 87% Hispanic / Latino 6% Two or more races 4% Black 2% Asian 2%
- Hispanic origin (detail)
- Puerto Rican 3%
- Common ancestry
- Lithuanian 9% Romanian 7% Slovak 2%
- Foreign-born
- 6% · Canada, China, Jamaica
- Languages at home
- 92% English-only · Spanish 4% Other Indo-European 1% Chinese 1%
Political lean MEDSL · Franklin
- 2024 margin
- Solid D (+37.8) · D 67.3% · R 29.6% · Other 3.1%
- 2008→2024 swing
- -9.9pp toward R · 2008: 47.7pp · 2024: 37.8pp
- All cycles
- 2024: D+37.8 2020: D+44.4 2016: D+37.0 2012: D+47.0 2008: D+47.7
Not yet ingested
- Civics
- —
Market trends
- HPI YoY
- ▼ -85.80%
- Current HPI
- 272.1354
- Rent YoY
- —
- Metro
- Springfield, MA
- State GDP YoY
- ▲ 2.28%
- F500 in state
- 38
Industry mix (Fortune 500 HQ in MA)
| Industry | F500 HQs | Revenue |
|---|---|---|
| Technology | 3 | $17B |
|
||
| Insurance | 2 | $84B |
|
||
| Retail | 2 | $76B |
|
||
| Life Sciences | 1 | $43B |
|
||
| Energy Technology | 1 | $31B |
|
||
| Aerospace / Defense | 1 | $18B |
|
||
Price history
+135.3% since first listed6 events — show timeline
- 2026-03-27 Price Changed $250,000 MLS PIN
- 2026-03-04 Listed $280,000 MLS PIN
- 2009-12-04 Sold (Public Records) $157,500 Public Records
- 2009-12-04 Sold (MLS) $157,500 MLS PIN
- 2009-08-14 Listed $162,500 MLS PIN
- 2003-05-30 Sold (Public Records) $106,250 Public Records
Property tax history
+2.9%/yrLatest (2023): $3,690 · +1.7% YoY. Source: county tax records.
Cash-flow waterfall
monthlySold comps — $/sqft
last 12 mo · ≤1 miLoading sold comps…