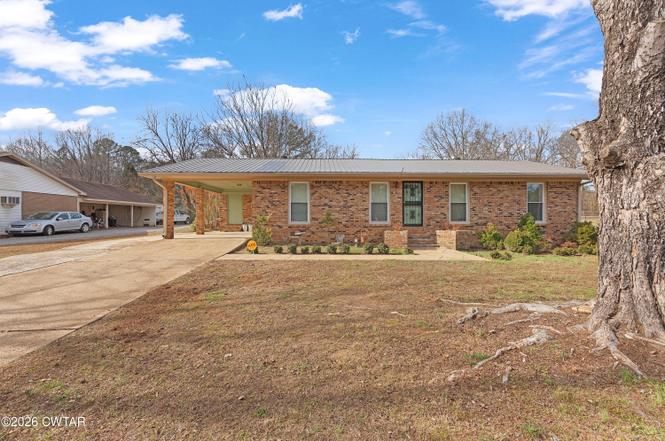
85 Meridian Dr · Jackson, TN
Flood risk 3/10 · Minor
- FEMA flood zone
- X (unshaded)
- Chance of flooding over 30 yrs
- 0.2%
- Est. flood insurance / yr
- $507 – $1,088
Fire risk 3/10 · Minor
- Est. fire insurance / yr
- $949 – $1,763
Heat risk 6/10 · Moderate
- Hot days now (above 109°F)
- 7 days/yr
- Hot days in 30 yrs
- 22 days/yr
Wind risk 4/10 · Minor
- Chance of severe wind over 30 yrs
- 15.0%
Air-quality risk 1/10 · Minimal
- Unhealthy air days now
- 0 days/yr
- Unhealthy air days in 30 yrs
- 0 days/yr
Risk factors via First Street. Map © Google.
Why this score? — see what drove the C- grade
The composite is a weighted blend of 9 inputs, each scored 0–100. Each bar is that input's sub-score; the figure is the points it added to the 100-point composite (weight × sub-score).
- Cash flow +16.9/30.0
- ARV discount +13.9/15.0
- DSCR +5.3/10.0
- Rent growth +3.8/5.0
- 1% rule +3.6/10.0
- Livability +3.1/5.0
- Condition / age +2.5/5.0
- Schools +1.2/10.0
- Appreciation +0.0/10.0
$175,000
🖨 Deal sheet (PDF) 📄 Offer letter ✓ Due diligence
Listing remarks
Welcome to Your next Home at 85 Meridian Drive! Discover the perfect blend of comfort, convenience, and charm in this stunning 3-bedroom, 2-bathroom brick beauty nestled in the desirable south Madison County area of Tennessee. Just minutes from everyday essentials like Walmart and Lowes, plus a fantastic array of dining options, and a luxury car wash, this home puts everything you need right at your fingertips—without sacrificing that peaceful, suburban feel. Step inside this meticulously maintained gem and fall in love with the spacious, well-designed layout that's ideal for family living and entertaining. Highlights include: Durable and stylish all-brick exterior with a sleek metal
Key facts
- Generous kitchen
- Metal roof
- Brick exterior
Tags
Property features AI
Finance
- Financial info: Annual tax amount listed
Exterior
- Parking: 2 total parking spaces; 1 carport space; Open parking (2 spaces)
- Security: Security system
- Utilities: Public water; Public sewer
- Home design: Single family residence; One level / single-story
- Construction: Brick construction; Block foundation
- Exterior features: Metal roof; Asphalt road access; Publicly maintained city street frontage; Lot dimensions approximately 100 x 200
Interior
- Kitchen: Dishwasher; Gas range
- Bedrooms: 3 bedrooms on the main level
- Flooring: Carpet; Ceramic tile; Laminate; Vinyl
- Bathrooms: 2 full bathrooms (both on the main level)
- Heating & cooling: Central heating (natural gas); Fireplace(s); Central air; Ceiling fans
- Interior features: Breakfast bar; Ceiling fans; Laminate countertops; Pantry; Gas log fireplace
- Laundry & utility: Laundry room with washer and electric dryer hookups
Neighborhood map
What this means for you Summary
Snapshot
- This is a 3-bed/1.0-bath single-family listed at $175k.
Deal economics
- At list price, monthly cash flow is $116 ($1k/yr) — positive.
- The deal already cash-flows at list — no discount required.
- To meet the 1% rule (rent ≥ 1% of price), the offer needs to be $151k (14.0% below list).
- Recommended offer: $151k (14.0% below list) — sets the bar for 1% rule.
- Cap rate 7.1% vs local median 3.5% in Jackson — top-decile yield for the area; either an underpriced asset or a hidden risk that comps aren't pricing in. Stress-test before assuming the spread holds.
Location & tenants
- Location reads 62/100 on livability (#216 in TN) — a middle-class / working-renter tenant base. Strengths: cost of living A+, housing A+; Watch: health & safety C-, crime F, amenities F.
- Madison County (urban): math 10% / reading 17% proficiency, ranked #131 of 139 in TN (top 94%) — low school quality limits family demand, transient renter base, plan for 1-2y turnover; 68% free/reduced lunch — lower-income household profile, screen leases tightly.
- Zoned schools: South Side High School (math 10% / reading 15%, grade F, #257 of 332 statewide, top 78%, 810 students, 0% FRL) — zoned schools average 0% FRL vs 68% district-wide (68 pts lower); this property's tenant base skews higher-income than the district average.
- Market conditions: Rents rising fast (+5.2%/yr); 255 active listings in the ZIP; lower-income renter base — watch delinquency; 247 units permitted in Madison County in 2024 (0 in 5+ unit buildings).
- This rent runs 42% of the median local income ($43k/yr) — at the standard rent-burdened threshold; future hikes will face affordability resistance.
Forward outlook
- Local home prices are declining (-3.0%/yr); year-one equity from $1k of loan paydown is wiped out by about $5k of value loss. Plan a longer hold.
- Madison County population projected at -12% by 2050 — secular population decline; favor cash flow + early exit over multi-decade hold.
Negotiation context
- It's been on market 136 days — a 12% lower offer ($154k) is reasonable based on typical stale-listing flexibility.
- 3 sale attempts; this cycle's ask has dropped $45k (20%) from the opening price — seller is motivated, your offer sets the floor, not the list.
Risks & watch-outs
- Climate carrying-cost: extreme-heat days projected 7→22/yr by 2055 (HVAC capex compounding) — expect insurance premiums to compound above CPI over the hold.
Questions for the listing agent
- It's been on market 136 days. Have you received any prior offers? Is the seller open to a 14% concession, seller financing, or rate buy-down credit?
- Built in 1968 — when were the roof, HVAC, electrical panel, plumbing, and water heater last replaced?
- Why hasn't it sold? Are there any deal-killer items the seller is aware of (foundation, flood, title, zoning, code violations)?
- Is there a deadline driving the sale (1031 exchange, divorce, estate, relocation)? That informs how much negotiation room exists.
- Schools are F-rated, which usually means shorter tenancies and higher turnover. Who's the typical renter profile here, and what's been the actual vacancy rate?
- Crime grade is F in this area — have there been break-ins, vandalism, or insurance claims at this property in the last 3 years? What carrier currently insures it and at what premium?
- What's the average days-on-market for RENTAL listings here right now (not sales)? A rising rental-DOM trend means longer vacancies and softer asking-rent achievability than the comps imply.
- What's the recent tenant-quality profile in this submarket — average credit score on applications, eviction rate, late-payment / NSF rate, and stable-employment percentage? A property-management company in the area should have these aggregated.
- How much new for-sale + rental construction is in the pipeline within 1–3 miles? Heavy new supply typically softens prices + rents 12–24 months out; constrained supply supports both.
Investment metrics
- 1% rule
- 0.86% ✗
- Cap rate
- 7.09%
- Cash-on-cash
- 2.84%
- DSCR
- 1.13
- GRM
- 9.7
CMA / ARV
- ARV (on-the-fly)
- $204,204
- Comps found
- 12
Show comp detail 12 sales within ~0.75 mi
| Address | Dist | Beds/Ba | Sqft | Sold | Price | $/sf | Match |
|---|---|---|---|---|---|---|---|
| 72 Edgehill Dr | 0.12mi | 3/2.0 | 1,399 (-2%) | 13mo | $199,900 | $143 | 76 |
| 162 Aspen Ave | 0.15mi | 3/2.0 | 1,283 (-10%) | 0mo | $210,000 | $164 | 72 |
| 252 Bolivar Hwy | 0.48mi | 2/1.0 (-1) | 1,372 (-4%) | 0mo | $190,000 | $138 | 66 |
| 90 Meridian Dr | 0.03mi | 3/2.0 | 1,233 (-14%) | 9mo | $198,000 | $161 | 64 |
| 19 Meridian Dr | 0.15mi | 4/2.0 (+1) | 1,585 (+11%) | 5mo | $170,000 | $107 | 62 |
| 69 Aspen Ave | 0.28mi | 3/2.0 | 1,374 (-4%) | 20mo | $215,000 | $156 | 60 |
| 135 Bellmeade Dr | 0.43mi | 3/2.0 | 1,375 (-4%) | 18mo | $209,000 | $152 | 54 |
| 205 Bolivar Hwy | 0.51mi | 3/1.5 | 1,569 (+10%) | 7mo | $159,000 | $101 | 52 |
| 385 Bolivar Hwy | 0.67mi | 2/1.0 (-1) | 1,300 (-9%) | 7mo | $215,000 | $165 | 43 |
| 291 Bolivar Hwy | 0.55mi | 3/1.5 | 1,312 (-8%) | 19mo | $180,000 | $137 | 43 |
| 124 Bellmeade Dr | 0.48mi | 3/2.0 | 1,300 (-9%) | 24mo | $121,000 | $93 | 39 |
| 34 Malesus Heights Dr | 0.51mi | 3/2.0 | 1,560 (+9%) | 23mo | $179,900 | $115 | 38 |
Match score weights: distance 35% · size 25% · config 20% · recency 20%. Top-matched comps best support the ARV.
Projected returns pro-forma
-3.0% appreciation · 5.19% rent growth · sell at horizon
- IRR
- -9.7%
- Equity multiple
- 0.64×
- Total profit
- $-17,655
- Equity at exit
- $26,093
- IRR
- 2.2%
- Equity multiple
- 1.17×
- Total profit
- $8,419
- Equity at exit
- $15,131
Cash invested: $49,000 (down + closing). Projections, not guarantees.
Landlord ↔ Tenant lean methodology
- Overall (STATE)
- 87 Strongly Landlord-Friendly
- State Tennessee
- 87 Strongly Landlord-Friendly · R+13
- County
- — inherits STATE
- City
- — inherits STATE
ZIP-level market 38301
- Rents YoY
- 5.2%
- Active inventory
- 255
- Price-to-rent
- 9.7×
Monthly cashflow live
- Estimated rent
- $1,505 medium interval (Pro) →
- Mortgage (P&I)
- −$918
- Tax from tax record
- −$83 /mo · $991/yr
- Insurance
- −$73
- HOA
- −$0
- Vacancy / Maint / Mgmt
- −$316
- Net cashflow
- $116
Break-even live
Sensitivity live
| Price | -10% $215 | -5% $165 | +0% $116 | +5% $66 | +10% $17 |
|---|---|---|---|---|---|
| Rent | -10% $-3 | -5% $56 | +0% $116 | +5% $175 | +10% $235 |
| Rate | -1.0pp $204 | -0.5pp $160 | base $116 | +0.5pp $70 | +1.0pp $24 |
UW: 25.0% down · 7.5% · 30yr · 1.5% tax · 5.0% vac · 8.0% maint · 8.0% mgmt
Financing live
Cash to close
- Down payment
- $43,750
- Closing costs
- $5,250
- Reserves months
- —
- Total cash needed
- —
Loan-product check · same deal, 3 products live
Conventional
25% down · 7.5% · 30yr
- Down + closing
- —
- Monthly P&I
- —
- Monthly cashflow
- —
- DSCR
- —
- Eligible?
- —
Personal DTI + credit; lowest rate.
DSCR
20% down · 8.5% · 30yr
- Down + closing
- —
- Monthly P&I
- —
- Monthly cashflow
- —
- DSCR
- —
- Eligible?
- —
No personal income docs; deal must DSCR.
Hard money
10% down · 12.0% · 12mo
- Down + closing
- —
- Monthly P&I
- —
- Monthly cashflow
- —
- DSCR
- —
- Eligible?
- —
Short-term bridge; refi at stabilization.
Listing history 18 events
-
2026-06-13pricestatusdays on market $175,000 Pending 136 DOM
-
2026-06-10days on market $189,900 Active 134 DOM
-
2026-06-09days on market $189,900 Active 133 DOM
-
2026-06-08days on market $189,900 Active 132 DOM
-
2026-06-07days on market $189,900 Active 131 DOM
-
2026-06-05days on market $189,900 Active 128 DOM
-
2026-06-03days on market $189,900 Active 127 DOM
-
2026-06-02days on market $189,900 Active 126 DOM
-
2026-06-01days on market $189,900 Active 125 DOM
-
2026-05-31days on market $189,900 Active 124 DOM
-
2026-05-30days on market $189,900 Active 123 DOM
-
2026-05-14status Active
-
2026-05-06status Pending
-
2026-04-28price $189,900
-
2026-03-09status Active
-
2026-02-26status Pending
-
2026-02-08price $209,900
-
2026-01-08$219,900 Active
ⓘ Source: listings_history table (triggers on properties + properties_extension) + one-shot
backfill from property_details.listing_events for pre-trigger history.
Tax reassessment forecast TN · Resets to sale price
- Current annual tax
- $991 · $83/mo
- Projected year-2 tax
- $1,242 · $104/mo
- Expected delta
- +$252/yr (+$21/mo · 25.4%)
ⓘ Screening estimate from a state-policy table — verify with the county assessor before closing.
Climate risk First Street
- Flood 3/10 Moderate FEMA zone X (unshaded) · 20% chance over 30 yrs
- Wildfire 3/10 Moderate
- Heat 6/10 Major 7 d/yr ≥109°F today · 22 d/yr by 30 yrs out
- Wind 4/10 Moderate 15% chance of damaging wind over 30 yrs
- Air quality 1/10 Low 0 unhealthy d/yr today · 0 by 30 yrs out
Nearby sold comps map
Loading sold comps map…
Walkable amenities ~0.75 mi
Loading nearby amenities…
Taxation est. · year 1
- Rental income
- $18,061
- − Mortgage interest
- −$9,803
- − Property taxes
- −$991
- − Insurance
- −$875
- − Repairs & maintenance
- −$1,445
- − Management
- −$1,445
- − Depreciation
- −$5,091
- Taxable loss
- −$1,588
- Est. tax savings @ 24.0%
- +$381
- After-tax cash flow
- $1,771/yr
For passive investors: Depreciation is non-cash, so a rental often shows a tax loss while cash-flowing — sheltering income. Rental losses are passive: they offset passive income freely, and up to $25,000/yr can offset ordinary (W-2) income if you actively participate and your MAGI is under $100k (phasing out to $0 by $150k); unused losses carry forward. On sale, claimed depreciation is recaptured at up to 25%, and gains may owe capital-gains tax (a 1031 exchange can defer both). Figures are a year-1 estimate at your 24.0% rate — not tax advice; consult a CPA.
Schools (NCES district)
- District
- Madison County
- NCES district ID
- 4702580
- Math proficiency
- 10% ▼ -11.00%
- Reading proficiency
- 17% ▼ -4.00%
- Median HH income
- $42,015
- Composite
- 11.74/100
- National rank
- #9687
- State rank
- #131 of 139 in TN
Livability — Jackson
- Score
- 62/100
- State rank
- #216
- US rank
- #16488
Category grades
Schools grade is shown separately in the Schools card above.
Census & demographics
- Census place
- Jackson, TN
- County
- Madison County · 87,024 people
- City population
- 87,024
- Metro
- Jackson, TN
- Population (ZIP)
- 33,536
- Household income
- $43,227
- Rent vs Own
- Severe rent burden
- 1701.0
Population outlook (Madison County) Hauer SSP2
- Today (2025)
- 95,952 people
- By 2030
- 94,264 · -1.8%
- By 2040
- 89,607 · -6.6%
- By 2050
- 84,133 · -12.3%
- By 2075
- 72,215 · -24.7%
- By 2100
- 62,062 · -35.3%
Race, ethnicity, and origin ACS 2023
- Neighborhood character
- Diverse neighborhood (Simpson 0.57)
- Race & ethnicity
- Black 50% White 42% Two or more races 5% Hispanic / Latino 4%
- Common ancestry
- Slovak 1% Serbian 1% Portuguese 1%
- Foreign-born
- 3% · Canada
- Languages at home
- 96% English-only · Spanish 3%
Political lean MEDSL · Madison
- 2024 margin
- R (+18.2) · D 40.3% · R 58.5% · Other 1.2%
- 2008→2024 swing
- +3.4pp toward D · 2008: -21.6pp · 2024: -18.2pp
- All cycles
- 2024: R+18.2 2020: R+12.9 2016: R+15.6 2012: R+8.9 2008: R+21.6
Not yet ingested
- Civics
- —
Market trends
- HPI YoY
- ▼ -112.26%
- Current HPI
- 162.2273
- Rent YoY
- ▲ 5.19%
- Metro
- Jackson, TN
- State GDP YoY
- ▲ 2.78%
- F500 in state
- 22
Industry mix (Fortune 500 HQ in TN)
| Industry | F500 HQs | Revenue |
|---|---|---|
| Healthcare | 3 | $91B |
|
||
| Retail | 3 | $72B |
|
||
| Transportation / Logistics | 1 | $88B |
|
||
| Paper / Packaging | 1 | $19B |
|
||
| Insurance | 1 | $13B |
|
||
| Energy | 1 | $12B |
|
||
Price history
-13.6% since first listed7 events — show timeline
- 2026-05-14 Relisted — CWTAR
- 2026-05-06 Pending — CWTAR
- 2026-04-28 Price Changed $189,900 CWTAR
- 2026-03-09 Relisted — CWTAR
- 2026-02-26 Pending — CWTAR
- 2026-02-08 Price Changed $209,900 CWTAR
- 2026-01-08 Listed $219,900 CWTAR
Property tax history
+3.4%/yrLatest (2025): $991 · +0.0% YoY. Source: county tax records.
Cash-flow waterfall
monthlySold comps — $/sqft
last 12 mo · ≤1 miLoading sold comps…