 Multi-family
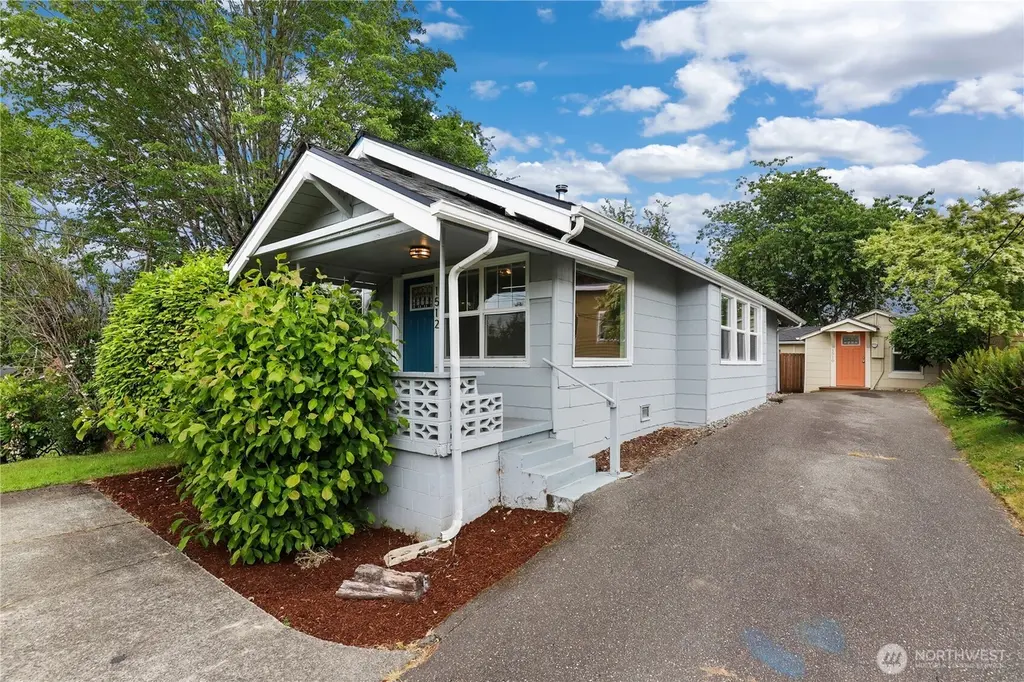
1512 1510 Naval Ave · Bremerton, WA
Flood risk 1/10 · Minimal
- FEMA flood zone
- X (unshaded)
- Chance of flooding over 30 yrs
- 0.0%
- Est. flood insurance / yr
- $507 – $1,088
Fire risk 1/10 · Minimal
- Est. fire insurance / yr
- $604 – $1,122
Heat risk 3/10 · Minor
- Hot days now (above 86°F)
- 7 days/yr
- Hot days in 30 yrs
- 14 days/yr
Wind risk 1/10 · Minimal
- Chance of severe wind over 30 yrs
- —
Air-quality risk 7/10 · Major
- Unhealthy air days now
- 9 days/yr
- Unhealthy air days in 30 yrs
- 10 days/yr
Risk factors via First Street. Map © Google.
Why this score? — see what drove the D- grade
The composite is a weighted blend of 9 inputs, each scored 0–100. Each bar is that input's sub-score; the figure is the points it added to the 100-point composite (weight × sub-score).
- Cash flow +17.1/30.0
- DSCR +5.3/10.0
- Livability +4.3/5.0
- 1% rule +3.9/10.0
- Schools +3.9/10.0
- Rent growth +2.6/5.0
- Condition / age +2.5/5.0
- ARV discount +0.0/15.0
- Appreciation +0.0/10.0
$445,000
🖨 Deal sheet 📄 Offer letter ✓ Due diligence
Multi-family units
County records classify this as Multi-Family (2-4 Unit). Listing-text estimate: 1 unit. estimate disagrees with records
Listing remarks
Don't miss this chance to own TWO beautifully updated homes! These homes are set just perfectly above street level for a little added privacy and have tons of parking. Conveniently located blocks from the public schools, Olympic College, shopping & dining! The moment you pull up you'll notice the old world charm of the main home with it's elevated front porch, inside a real craftsman touch that never ages and ample living & bedroom space! The DADU is fully functional with beautifully updated floors, cabinets and counters! The perfect place for any friends or maybe your first renter!? With this house hacking opportunity the options are endless. Maybe your looking for your first h
Key facts
- Updated cabinets
- Elevated front porch
- Updated floors
Tags
Property features AI
Finance
- Other: Possible use: Residential
- Financial info: Gross scheduled income: $40,800/year; Gross adjusted income: $37,390/year; Total monthly income: $3,400; Net operating income: $30,180/year; Total expenses: $7,210/year; Insurance expense: $2,000/year; Gross rent multiplier: 10.91; Acceptable financing: Cash, Conventional, FHA, State Bond, VA Loan
Exterior
- Parking: 6 uncovered parking spaces
- Utilities: Public water; Sewer connected; Electric and natural gas available; Power service by PSE
- Home design: Duplex (residential income, multi-family); Single-story (1 story); Updated/remodeled
- Construction: Cement and wood construction materials; Composition roof; Poured concrete foundation; Built as duplex
- Exterior features: Cement/concrete exterior; Wood and wood product accents; Deck; Patio; Cable TV available; High-speed internet available; Gas available; Paved site
Interior
- Kitchen: Unit 1512: Range/Oven, Refrigerator, Dishwasher; Unit 1510: Range/Oven, Refrigerator
- Bedrooms: Unit 1512: 2 bedrooms; Unit 1510: 1 bedroom
- Flooring: Laminate; Vinyl plank
- Bathrooms: Unit 1512: 1 bathroom; Unit 1510: 1 bathroom
- Heating & cooling: Forced air heating; Wall furnace; No central cooling
- Interior features: Updated/remodeled condition; Laminate flooring; Vinyl plank flooring
- Laundry & utility: Unit 1512: Washer and dryer included; Unit 1510: Washer and dryer included
Neighborhood map
What this means for you Summary
Snapshot
- This is a 2-bed/1.0-bath multifamily listed at $445k.
Deal economics
- At list price, monthly cash flow is $309 ($4k/yr) — positive.
- The deal already cash-flows at list — no discount required.
- To meet the 1% rule (rent ≥ 1% of price), the offer needs to be $394k (11.5% below list).
- Recommended offer: $394k (11.5% below list) — sets the bar for 1% rule.
- Cap rate 7.1% vs local median 3.5% in Bremerton — top-decile yield for the area; either an underpriced asset or a hidden risk that comps aren't pricing in. Stress-test before assuming the spread holds.
Location & tenants
- Location reads 86/100 on livability (#22 in WA, #431 nationally) — a professional / high-income tenant draw. Strengths: amenities A+, commute A+, housing A+; Watch: crime F.
- Bremerton School District (urban): math 36% / reading 51% proficiency, ranked #194 of 291 in WA (top 67%) — families likely to look elsewhere, expect single-tenant / working-renter base with shorter leases.
- Market conditions: Rents flat; 349 active listings in the ZIP; 40 comparable units currently listed for rent nearby; rentals at typical pace (median 21d on market — plan ~3-4 weeks tenant-placement turnaround); 48% of comp listings sitting > 30 days — soft ceiling on asking rent; solid renter incomes; 1,294 units permitted in Kitsap County in 2024 (302 in 5+ unit buildings).
- At $3,940/mo this rent would consume 52% of the median local household income ($90k/yr) (locally 993% of renters already pay >50% of income on rent) — very limited rent-growth headroom before tenants either downsize or default.
Forward outlook
- Local home prices are declining (-3.0%/yr); year-one equity from $3k of loan paydown is wiped out by about $13k of value loss. Plan a longer hold.
- Kitsap County population projected at +8% by 2050 — modest demand growth; plan on rents tracking national, not racing it.
Negotiation context
- Only 5 days on market — expect competitive offers; lowballing is unlikely to land.
- 7 sale attempts since 24y ago with the ask held roughly flat each time — persistent listings suggest the price (not the market) is what's stuck; bring a comps-based counter.
- Current owner paid $365k; 22% above their basis — modest negotiation headroom, anchor on the comps not their cost.
Risks & watch-outs
- Watch-outs: built in 1917 — expect roof / HVAC / electrical / plumbing capex.
Questions for the listing agent
- Built in 1917 — when were the roof, HVAC, electrical panel, plumbing, and water heater last replaced?
- Is there a deadline driving the sale (1031 exchange, divorce, estate, relocation)? That informs how much negotiation room exists.
- Schools are B-rated — typically a magnet for longer-tenancy family renters. What's the average tenant stay here, and is there a school-zone premium baked into asking?
- Crime grade is F in this area — have there been break-ins, vandalism, or insurance claims at this property in the last 3 years? What carrier currently insures it and at what premium?
- The area grade is low — what's the realistic commute time and amenity access for the typical tenant pool here? Any planned neighborhood developments (good or bad) we should know about?
- What's the average days-on-market for RENTAL listings here right now (not sales)? A rising rental-DOM trend means longer vacancies and softer asking-rent achievability than the comps imply.
- What's the recent tenant-quality profile in this submarket — average credit score on applications, eviction rate, late-payment / NSF rate, and stable-employment percentage? A property-management company in the area should have these aggregated.
- How much new apartment / multifamily construction is in the pipeline within 1–3 miles? Heavy new supply (>2% of stock underway) typically softens rents 12–24 months out; light construction supports rent growth.
Investment metrics
- 1% rule
- 0.89% ✗
- Cap rate
- 7.13%
- Cash-on-cash
- 2.98%
- DSCR
- 1.13
- GRM
- 9.4
CMA / ARV
- ARV (on-the-fly)
- $373,968
- Comps found
- 2
Show comp detail 2 sales within ~0.75 mi
| Address | Dist | Beds/Ba | Sqft | Sold | Price | $/sf | Match |
|---|---|---|---|---|---|---|---|
| 1323 N Wycoff | 0.41mi | 2/1.0 | 868 (-9%) | 10mo | $295,000 | $340 | 57 |
| 1106 Lincoln Ave | 0.52mi | 2/2.0 | 1,033 (+8%) | 5mo | $405,000 | $392 | 54 |
Match score weights: distance 35% · size 25% · config 20% · recency 20%. Top-matched comps best support the ARV.
Projected returns pro-forma
-3.0% appreciation · 0.28% rent growth · sell at horizon
- IRR
- -14.5%
- Equity multiple
- 0.49×
- Total profit
- $-63,007
- Equity at exit
- $66,351
- IRR
- -10.6%
- Equity multiple
- 0.43×
- Total profit
- $-70,721
- Equity at exit
- $38,475
Cash invested: $124,600 (down + closing). Projections, not guarantees.
Landlord ↔ Tenant lean methodology
- Overall (STATE)
- 28 Tenant-Leaning
- State Washington
- 28 Tenant-Leaning · D+8
- County
- — inherits STATE
- City
- — inherits STATE
ZIP-level market 98312
- Rents YoY
- 0.3%
- Active inventory
- 349
- Price-to-rent
- 18.8×
Monthly cashflow live
- Estimated rent
- $3,940 medium interval (Pro) →
- Mortgage (P&I)
- −$2,334
- Tax from tax record
- −$284 /mo · $3,410/yr
- Insurance
- −$185
- HOA
- −$0
- Vacancy / Maint / Mgmt
- −$827
- Net cashflow
- $309
Break-even live
2-unit breakdown (identical units grouped — click to expand)
| Units | Beds | Baths | Est. rent |
|---|---|---|---|
| 2× units | 3 | 1.5 | $3,940 |
| #1 | 3 | 1.5 | $1,970 |
| #2 | 3 | 1.5 | $1,970 |
| Total (2 units) | $3,940 | ||
UW: 25.0% down · 7.5% · 30yr · 1.5% tax · 5.0% vac · 8.0% maint · 8.0% mgmt
Financing live
Cash to close
- Down payment
- $111,250
- Closing costs
- $13,350
- Reserves months
- —
- Total cash needed
- —
Loan-product check · same deal, 3 products live
Conventional
25% down · 7.5% · 30yr
- Down + closing
- —
- Monthly P&I
- —
- Monthly cashflow
- —
- DSCR
- —
- Eligible?
- —
Personal DTI + credit; lowest rate.
DSCR
20% down · 8.5% · 30yr
- Down + closing
- —
- Monthly P&I
- —
- Monthly cashflow
- —
- DSCR
- —
- Eligible?
- —
No personal income docs; deal must DSCR.
Hard money
10% down · 12.0% · 12mo
- Down + closing
- —
- Monthly P&I
- —
- Monthly cashflow
- —
- DSCR
- —
- Eligible?
- —
Short-term bridge; refi at stabilization.
Rent comps 40 comps
| Address | Beds | Baths | Sqft | Rent | $/sqft | DOM | Units | Dist |
|---|---|---|---|---|---|---|---|---|
| 1604 Naval Ave Bremerton, WA | 2.0 | 2.0 | 1065 | $1,850 | $1.74 | 21d | 2 | 0.16mi |
| 1720 Olympic Ave Bremerton, WA | 3.0 | 1.0 | 855 | $2,100 | $2.46 | 43d | 1 | 0.18mi |
| 1588 Naval Ave #10 Bremerton, WA | 2.0 | 2.0 | 972 | $1,450 | $1.49 | 43d | 1 | 0.19mi |
| 1742 Anderson St Bremerton, WA | 3.0 | 1.0 | 855 | $1,899 | $2.22 | 43d | 1 | 0.19mi |
| 1708 Houston Ave Bremerton, WA | 3.0 | 1.0 | 854 | $1,750 | $2.05 | 13d | 1 | 0.21mi |
| 2127 12th St Unit A208 Bremerton, WA | 2.0 | 1.0 | 800 | $1,450 | $1.81 | 21d | 1 | 0.23mi |
| 2127 12th St Bremerton, WA | 2.0 | 1.0 | 800 | $1,500 | $1.88 | 21d | 1 | 0.23mi |
| 2127 12th St Unit C207 Bremerton, WA | 2.0 | 1.0 | 800 | $1,495 | $1.87 | 13d | 1 | 0.23mi |
| 2127 12th St Bremerton, WA | 2.0 | 1.0 | 800 | $1,595 | $1.99 | 43d | 1 | 0.23mi |
| 1540 N Callow Ave Apt D Bremerton, WA | 2.0 | 1.0 | 682 | $1,675 | $2.46 | 13d | 1 | 0.32mi |
| 1720 N Wycoff Ave Unit 2 Bremerton, WA | 3.0 | 2.0 | 1100 | $2,100 | $1.91 | 13d | 1 | 0.41mi |
| 2106 7th St Bremerton, WA | 2.0 | 2.0 | 1040 | $2,450 | $2.36 | 43d | 1 | 0.46mi |
| 1208 10th St Bremerton, WA | 2.0 | 1.0 | 950 | $1,850 | $1.95 | 43d | 1 | 0.56mi |
| 1222 9th St Bremerton, WA | 3.0 | 1.0 | 1072 | $2,000 | $1.87 | 43d | 1 | 0.56mi |
| 1736 4th St Bremerton, WA | 2.0 | 1.0 | 1035 | $1,700 | $1.64 | 43d | 1 | 0.64mi |
| 814 Chester Ave Unit B Bremerton, WA | 1.0 | 1.0 | 782 | $1,400 | $1.79 | 21d | 1 | 0.64mi |
| 828 Broadway Ave Unit A Bremerton, WA | 1.0 | 1.0 | 646 | $1,195 | $1.85 | 21d | 1 | 0.68mi |
| 1903 Burwell St Unit 2 Bremerton, WA | 2.0 | 1.0 | 858 | $1,895 | $2.21 | 21d | 1 | 0.71mi |
| 500 Lebo Blvd Apt 301 Bremerton, WA | 1.0 | 1.0 | 733 | $1,475 | $2.01 | 13d | 1 | 0.77mi |
| 500 Lebo Blvd Apt 205 Bremerton, WA | 1.0 | 1.0 | 733 | $1,425 | $1.94 | 21d | 1 | 0.77mi |
| 500 Lebo Blvd Unit 105 Bremerton, WA | 1.0 | 1.0 | 733 | $1,375 | $1.88 | 44d | 1 | 0.77mi |
| 500 Lebo Blvd Apt 205 Bremerton, WA | 1.0 | 1.0 | 733 | $1,450 | $1.98 | 43d | 1 | 0.77mi |
| 500 Lebo Blvd Apt 305 Bremerton, WA | 1.0 | 1.0 | 733 | $1,450 | $1.98 | 13d | 1 | 0.77mi |
| 500 Lebo Blvd Unit 102 Bremerton, WA | 1.0 | 1.0 | 733 | $1,400 | $1.91 | 43d | 1 | 0.77mi |
| 500 Lebo Blvd Unit 304 Bremerton, WA | 2.0 | 1.0 | 917 | $1,600 | $1.74 | 21d | 1 | 0.77mi |
| 114 Lebo Blvd Bremerton, WA | 1.0 | 1.0 | 600 | $1,450 | $2.42 | 13d | 1 | 0.79mi |
| 550 Lebo Blvd Bremerton, WA | 1.0 | 1.0 | 1000 | $1,550 | $1.55 | 13d | 1 | 0.80mi |
| 119 Elm St Unit A Bremerton WA 98310 Bremerton, WA | 2.0 | 1.0 | 600 | $2,000 | $3.33 | 43d | 1 | 0.80mi |
| 119 Elm St Unit B Bremerton, WA 98310 Bremerton, WA | 2.0 | 1.0 | 600 | $2,000 | $3.33 | 43d | 1 | 0.80mi |
| 2733 Hefner Ave Unit 2733 Bremerton, WA | 3.0 | 1.0 | 874 | $1,900 | $2.17 | 13d | 1 | 0.81mi |
| 100 N Lafayette Ave Bremerton, WA | 1.0 | 1.0 | 600 | $1,485 | $2.48 | 43d | 1 | 0.89mi |
| 1010 Burwell St Bremerton, WA | 1.0–2.0 | 1.0 | 719 | $2,100 | $2.92 | 43d | 4 | 0.89mi |
| 629 Adele Ave Unit B Bremerton, WA | 2.0 | 1.0 | 960 | $1,750 | $1.82 | 43d | 1 | 0.93mi |
| 1104 Pacific Ave Bremerton, WA | 1.0 | 1.0 | 600 | $1,475 | $2.46 | 21d | 1 | 0.93mi |
| 113 S Cambrian Ave Bremerton, WA | 1.0 | 1.0 | 540 | $1,350 | $2.50 | 43d | 1 | 0.93mi |
| 637 Pleasant Ave Bremerton, WA | 1.0 | 1.0 | 600 | $1,300 | $2.17 | 21d | 1 | 1.03mi |
| 602 4th St Bremerton, WA | 1.0 | 1.0 | 550 | $1,350 | $2.45 | 43d | 1 | 1.03mi |
| 614 Sheridan Rd Bremerton, WA | 1.0 | 1.0 | 550 | $1,600 | $2.91 | 13d | 4 | 1.03mi |
| 657 Highland Ave Bremerton, WA | 3.0 | 1.0 | 1014 | $2,200 | $2.17 | 43d | 1 | 1.05mi |
| 133 S Marion Ave Unit G Bremerton, WA | 1.0 | 1.0 | 528 | $1,275 | $2.41 | 13d | 1 | 1.05mi |
Listing history 5 events
-
2026-06-10status $445,000 Pending 5 DOM
-
2026-06-09days on market $445,000 Active 5 DOM
-
2026-06-08days on market $445,000 Active 4 DOM
-
2026-06-07remarks 691-char remark
-
2026-06-07$445,000 Active 3 DOM
ⓘ Source: listings_history table (triggers on properties + properties_extension) + one-shot
backfill from property_details.listing_events for pre-trigger history.
Tax reassessment forecast WA · Resets to sale price
- Current annual tax
- $3,410 · $284/mo
- Projected year-2 tax
- $4,361 · $363/mo
- Expected delta
- +$951/yr (+$79/mo · 27.9%)
ⓘ Screening estimate from a state-policy table — verify with the county assessor before closing.
Climate risk First Street
- Flood 1/10 Low FEMA zone X (unshaded) · 0% chance over 30 yrs
- Wildfire 1/10 Low
- Heat 3/10 Moderate 7 d/yr ≥86°F today · 14 d/yr by 30 yrs out
- Wind 1/10 Low
- Air quality 7/10 Severe 9 unhealthy d/yr today · 10 by 30 yrs out
Nearby sold comps map
Loading sold comps map…
Walkable amenities ~0.75 mi
Loading nearby amenities…
Taxation est. · year 1
- Rental income
- $47,280
- − Mortgage interest
- −$24,927
- − Property taxes
- −$3,410
- − Insurance
- −$2,225
- − Repairs & maintenance
- −$3,782
- − Management
- −$3,782
- − Depreciation
- −$12,945
- Taxable loss
- −$3,792
- Est. tax savings @ 24.0%
- +$910
- After-tax cash flow
- $4,623/yr
For passive investors: Depreciation is non-cash, so a rental often shows a tax loss while cash-flowing — sheltering income. Rental losses are passive: they offset passive income freely, and up to $25,000/yr can offset ordinary (W-2) income if you actively participate and your MAGI is under $100k (phasing out to $0 by $150k); unused losses carry forward. On sale, claimed depreciation is recaptured at up to 25%, and gains may owe capital-gains tax (a 1031 exchange can defer both). Figures are a year-1 estimate at your 24.0% rate — not tax advice; consult a CPA.
Schools (NCES district)
- District
- Bremerton School District
- NCES district ID
- 5300660
- Math proficiency
- 36% ▼ -3.00%
- Reading proficiency
- 51% ▲ 1.00%
- Median HH income
- $46,765
- Composite
- 39.34/100
- National rank
- #8163
- State rank
- #194 of 291 in WA
Livability — Bremerton
- Score
- 86/100
- State rank
- #22
- US rank
- #431
Category grades
Schools grade is shown separately in the Schools card above.
Census & demographics
- Census place
- Bremerton, WA
- County
- Kitsap County · 243,099 people
- City population
- 94,488
- Metro
- Bremerton-Silverdale-Port Orchard, WA
- Population (ZIP)
- 36,307
- Household income
- $90,449
- Rent vs Own
- Severe rent burden
- 993.0
Population outlook (Kitsap County) Hauer SSP2
- Today (2025)
- 277,525 people
- By 2030
- 285,040 · +2.7%
- By 2040
- 294,957 · +6.3%
- By 2050
- 300,622 · +8.3%
- By 2075
- 315,580 · +13.7%
- By 2100
- 304,340 · +9.7%
Race, ethnicity, and origin ACS 2023
- Neighborhood character
- Predominantly White (68%)
- Race & ethnicity
- White 68% Two or more races 13% Hispanic / Latino 12% Asian 4% Black 4% Native American 1%
- Hispanic origin (detail)
- Mexican 6% Puerto Rican 1%
- Common ancestry
- Italian 7% Portuguese 5% Slovak 4%
- Foreign-born
- 6% · Canada, China
- Languages at home
- 91% English-only · Spanish 4% Tagalog/Filipino 2% Other Asian/Pacific 1%
Political lean MEDSL · Kitsap
- 2024 margin
- Strong D (+20.9) · D 58.8% · R 37.9% · Other 3.3%
- 2008→2024 swing
- +8.6pp toward D · 2008: 12.3pp · 2024: 20.9pp
- All cycles
- 2024: D+20.9 2020: D+18.1 2016: D+11.6 2012: D+11.1 2008: D+12.3
Not yet ingested
- Civics
- —
Market trends
- HPI YoY
- ▼ -436.68%
- Current HPI
- 379.2342
- Rent YoY
- ▲ 0.28%
- Metro
- Bremerton-Silverdale-Port Orchard, WA
- State GDP YoY
- ▲ 4.65%
- F500 in state
- 22
Industry mix (Fortune 500 HQ in WA)
| Industry | F500 HQs | Revenue |
|---|---|---|
| Retail | 2 | $269B |
|
||
| Technology / Retail | 1 | $638B |
|
||
| Technology | 1 | $245B |
|
||
| Telecommunications | 1 | $38B |
|
||
| Food / Beverage | 1 | $36B |
|
||
| Automotive / Trucks | 1 | $34B |
|
||
Price history
+888.9% since first listed25 events — show timeline
- 2026-06-04 Listed $445,000 NWMLS as Distributed by MLS Grid
- 2026-06-04 Listed $445,000 NWMLS as Distributed by MLS Grid
- 2021-06-09 Sold (MLS) $365,000 NWMLS as Distributed by MLS Grid
- 2021-06-09 Sold (MLS) $365,000 NWMLS as Distributed by MLS Grid
- 2021-05-06 Pending — NWMLS as Distributed by MLS Grid
- 2021-05-06 Pending — NWMLS as Distributed by MLS Grid
- 2021-05-05 Pending — NWMLS as Distributed by MLS Grid
- 2021-05-05 Pending — NWMLS as Distributed by MLS Grid
- 2021-05-01 Listed $319,950 NWMLS as Distributed by MLS Grid
- 2021-05-01 Listed $319,950 NWMLS as Distributed by MLS Grid
- 2007-04-27 Sold (Public Records) $156,250 Public Records
- 2007-04-27 Sold (MLS) $156,250 NWMLS as Distributed by MLS Grid
- 2007-04-27 Sold (MLS) $156,250 NWMLS as Distributed by MLS Grid
- 2007-04-23 Delisted — NWMLS as Distributed by MLS Grid
- 2007-04-20 Price Changed $165,000 NWMLS as Distributed by MLS Grid
- 2007-03-11 Price Changed $199,900 NWMLS as Distributed by MLS Grid
- 2007-02-07 Price Changed $205,000 NWMLS as Distributed by MLS Grid
- 2007-01-17 Listed $165,000 NWMLS as Distributed by MLS Grid
- 2007-01-12 Price Changed $214,900 NWMLS as Distributed by MLS Grid
- 2006-12-20 Listed $219,950 NWMLS as Distributed by MLS Grid
- 2002-05-21 Sold (Public Records) $98,500 Public Records
- 2002-05-21 Sold (MLS) $98,500 NWMLS as Distributed by MLS Grid
- 2002-01-18 Listed $99,500 NWMLS as Distributed by MLS Grid
- 1998-10-28 Sold (Public Records) $85,000 Public Records
- 1986-10-09 Sold (Public Records) $45,000 Public Records
Property tax history
+4.5%/yrLatest (2026): $3,410 · +0.5% YoY. Source: county tax records.
Cash-flow waterfall
monthlySold comps — $/sqft
last 12 mo · ≤1 miLoading sold comps…