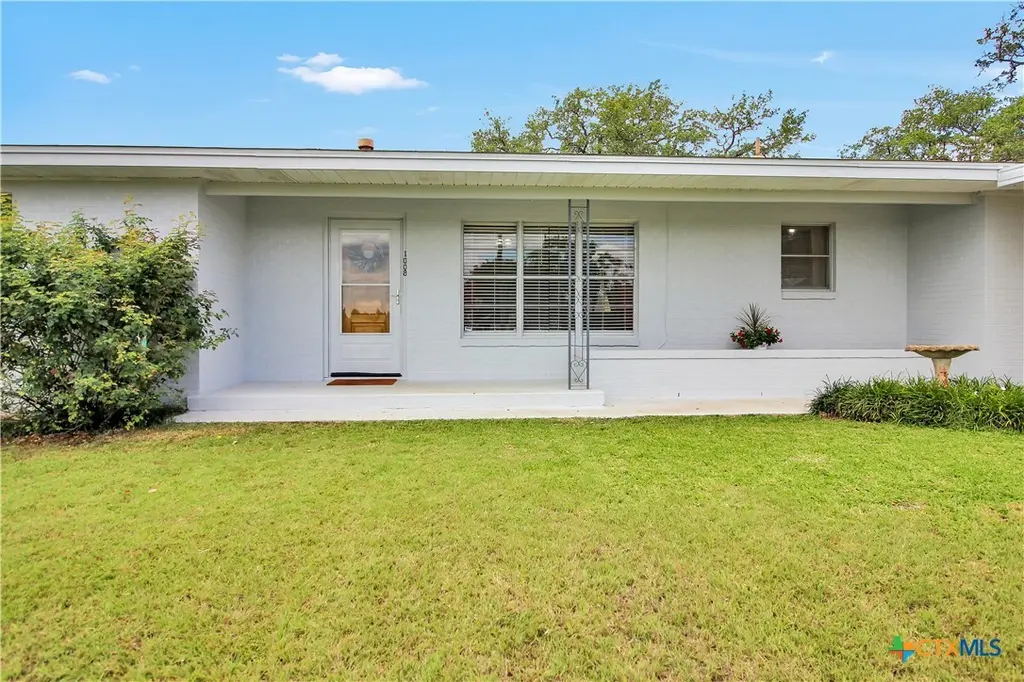
1008 W Avenue D Ave · Belton, TX
Flood risk 1/10 · Minimal
- FEMA flood zone
- X (unshaded)
- Chance of flooding over 30 yrs
- 0.0%
- Est. flood insurance / yr
- $507 – $1,088
Fire risk 4/10 · Minor
- Est. fire insurance / yr
- $1,222 – $2,270
Heat risk 8/10 · Major
- Hot days now (above 108°F)
- 7 days/yr
- Hot days in 30 yrs
- 25 days/yr
Wind risk 6/10 · Moderate
- Chance of severe wind over 30 yrs
- 70.0%
Air-quality risk 1/10 · Minimal
- Unhealthy air days now
- 0 days/yr
- Unhealthy air days in 30 yrs
- 0 days/yr
Risk factors via First Street. Map © Google.
Why this score? — see what drove the D- grade
The composite is a weighted blend of 9 inputs, each scored 0–100. Each bar is that input's sub-score; the figure is the points it added to the 100-point composite (weight × sub-score).
- ARV discount +14.0/15.0
- Cash flow +7.2/30.0
- Schools +3.8/10.0
- Livability +3.4/5.0
- Rent growth +2.8/5.0
- Condition / age +2.5/5.0
- 1% rule +2.2/10.0
- DSCR +1.4/10.0
- Appreciation +0.0/10.0
$199,000
🖨 Deal sheet (PDF) 📄 Offer letter ✓ Due diligence
Listing remarks
Adorable 1960's ranch-style home featuring 3 bedrooms, 2 full baths, and a room used for flexible space. Conveniently located near downtown Belton and all three schools, this home is a fantastic opportunity for a first-time buyer or investor to make it their own. Recent updates include a replaced A/C in 2024, a tankless water heater installed in 2024, and fresh paint completed outside in Spring 2026. Situated on a spacious . 26-acre lot, the property offers a large shop in the backyard, a comfortable 2-car carport, and a stunning oversized shade tree—perfect for a swing and relaxing backyard afternoons. Adding to the home’s charm, the vintage tile in the bathrooms brings a wonde
Key facts
- 2-car carport
- Replaced a/c
- Oversized shade tree
Tags
Property features AI
Exterior
- Parking: Attached garage (1 space); Carport (2 spaces); Detached carport; Single garage door; Garage with opener; Oversized garage
- Utilities: Public water; Electricity available; Natural gas available
- Home design: Single-story; Resale property
- Construction: Brick/masonry construction; Composition/shingle roof; Slab foundation; Year built (per assessor)
- Exterior features: Private yard; Outbuilding; Back yard chain-link fence (full)
Interior
- Kitchen: Electric cooktop
- Flooring: Parquet
- Bathrooms: 2 full bathrooms
- Heating & cooling: Central heating (electric); Central air conditioning
- Interior features: Ceiling fan(s); Separate shower; Tub with shower; Breakfast bar; Breakfast area; Eat-in kitchen; Kitchen/dining combo; See remarks
- Laundry & utility: Washer hookup; Electric dryer hookup; Gas water heater; Tankless water heater; Some electric appliances
Neighborhood map
What this means for you Summary
Snapshot
- This is a 2-bed/2.0-bath single-family listed at $199k.
Deal economics
- At list price, monthly cash flow is $-276 ($-3k/yr) — negative.
- To cash-flow at today's rent, offer at most $150k (24.5% below list).
- To meet the 1% rule (rent ≥ 1% of price), the offer needs to be $144k (27.8% below list).
- Recommended offer: $144k (27.8% below list) — sets the bar for 1% rule.
- Cap rate 4.6% vs local median 3.6% in Belton — meaningfully above typical; check what's discounted (condition, days-on-market, listing class) to confirm the premium yield is real.
Location & tenants
- Location reads 68/100 on livability (#462 in TX) — a middle-class / working-renter tenant base. Strengths: cost of living A+, housing A+, crime A-; Watch: employment C-, schools D, amenities F.
- Belton ISD (suburban): math 39% / reading 46% proficiency, ranked #285 of 826 in TX (top 34%) — families likely to look elsewhere, expect single-tenant / working-renter base with shorter leases.
- Market conditions: Rents rising (+1.3%/yr); 750 active listings in the ZIP; 39 comparable units currently listed for rent nearby; rentals at typical pace (median 25d on market — plan ~3-4 weeks tenant-placement turnaround); 46% of comp listings sitting > 30 days — soft ceiling on asking rent; solid renter incomes; 3,222 units permitted in Bell County in 2024 (246 in 5+ unit buildings).
Forward outlook
- Local home prices are declining (-3.0%/yr); year-one equity from $1k of loan paydown is wiped out by about $6k of value loss. Plan a longer hold.
- Bell County population projected at +21% by 2050 — long-run rental-demand tailwind backs the buy-and-hold thesis.
Negotiation context
- It's been on market 15 days — a 2% lower offer ($196k) is reasonable based on typical stale-listing flexibility.
Risks & watch-outs
- Watch-outs: built in 1959 — expect roof / HVAC / electrical / plumbing capex.
- Climate carrying-cost: major wind risk, 70% chance of damaging wind over 30y; extreme-heat days projected 7→25/yr by 2055 (HVAC capex compounding) — expect insurance premiums to compound above CPI over the hold.
Questions for the listing agent
- What do current leases actually rent for vs. the listed asking? Can we see a recent rent roll and the last 12 months of T-12 income?
- Built in 1959 — when were the roof, HVAC, electrical panel, plumbing, and water heater last replaced?
- Is there a deadline driving the sale (1031 exchange, divorce, estate, relocation)? That informs how much negotiation room exists.
- Schools are D-rated, which usually means shorter tenancies and higher turnover. Who's the typical renter profile here, and what's been the actual vacancy rate?
- The area grade is low — what's the realistic commute time and amenity access for the typical tenant pool here? Any planned neighborhood developments (good or bad) we should know about?
- What's the average days-on-market for RENTAL listings here right now (not sales)? A rising rental-DOM trend means longer vacancies and softer asking-rent achievability than the comps imply.
- What's the recent tenant-quality profile in this submarket — average credit score on applications, eviction rate, late-payment / NSF rate, and stable-employment percentage? A property-management company in the area should have these aggregated.
- How much new for-sale + rental construction is in the pipeline within 1–3 miles? Heavy new supply typically softens prices + rents 12–24 months out; constrained supply supports both.
Investment metrics
- 1% rule
- 0.72% ✗
- Cap rate
- 4.63%
- Cash-on-cash
- -5.94%
- DSCR
- 0.74
- GRM
- 11.5
CMA / ARV
- ARV (on-the-fly)
- $232,484
- Comps found
- 5
Show comp detail 5 sales within ~0.75 mi
| Address | Dist | Beds/Ba | Sqft | Sold | Price | $/sf | Match |
|---|---|---|---|---|---|---|---|
| 717 Surghnor St | 0.42mi | 3/2.0 (+1) | 1,482 (+3%) | 2mo | $130,000 | $88 | 70 |
| 1210 W Avenue D | 0.14mi | 3/2.0 (+1) | 1,296 (-10%) | 8mo | $165,000 | $127 | 65 |
| 601 Marshall Dr | 0.19mi | 3/2.0 (+1) | 1,653 (+14%) | 2mo | $290,000 | $175 | 61 |
| 1218 Dowdy Dr | 0.70mi | 3/2.0 (+1) | 1,390 (-4%) | 4mo | $244,900 | $176 | 53 |
| 1226 Dowdy Dr | 0.72mi | 3/2.0 (+1) | 1,550 (+7%) | 7mo | $249,900 | $161 | 43 |
Match score weights: distance 35% · size 25% · config 20% · recency 20%. Top-matched comps best support the ARV.
Projected returns pro-forma
-3.0% appreciation · 1.29% rent growth · sell at horizon
- IRR
- -28.4%
- Equity multiple
- 0.06×
- Total profit
- $-52,191
- Equity at exit
- $29,672
- IRR
- -36.1%
- Equity multiple
- -0.39×
- Total profit
- $-77,519
- Equity at exit
- $17,206
Cash invested: $55,720 (down + closing). Projections, not guarantees.
Landlord ↔ Tenant lean methodology
- Overall (STATE)
- 87 Strongly Landlord-Friendly
- State Texas
- 87 Strongly Landlord-Friendly · R+5
- County
- — inherits STATE
- City
- — inherits STATE
ZIP-level market 76513
- Rents YoY
- 1.3%
- Active inventory
- 750
- Price-to-rent
- 11.5×
Monthly cashflow live
- Estimated rent
- $1,438 high interval (Pro) →
- Mortgage (P&I)
- −$1,044
- Tax from tax record
- −$285 /mo · $3,419/yr
- Insurance
- −$83
- HOA
- −$0
- Vacancy / Maint / Mgmt
- −$302
- Net cashflow
- $-276
Break-even live
Sensitivity live
| Price | -10% $-163 | -5% $-219 | +0% $-276 | +5% $-332 | +10% $-388 |
|---|---|---|---|---|---|
| Rent | -10% $-389 | -5% $-332 | +0% $-276 | +5% $-219 | +10% $-162 |
| Rate | -1.0pp $-175 | -0.5pp $-225 | base $-276 | +0.5pp $-327 | +1.0pp $-380 |
UW: 25.0% down · 7.5% · 30yr · 1.5% tax · 5.0% vac · 8.0% maint · 8.0% mgmt
Financing live
Cash to close
- Down payment
- $49,750
- Closing costs
- $5,970
- Reserves months
- —
- Total cash needed
- —
Loan-product check · same deal, 3 products live
Conventional
25% down · 7.5% · 30yr
- Down + closing
- —
- Monthly P&I
- —
- Monthly cashflow
- —
- DSCR
- —
- Eligible?
- —
Personal DTI + credit; lowest rate.
DSCR
20% down · 8.5% · 30yr
- Down + closing
- —
- Monthly P&I
- —
- Monthly cashflow
- —
- DSCR
- —
- Eligible?
- —
No personal income docs; deal must DSCR.
Hard money
10% down · 12.0% · 12mo
- Down + closing
- —
- Monthly P&I
- —
- Monthly cashflow
- —
- DSCR
- —
- Eligible?
- —
Short-term bridge; refi at stabilization.
Rent comps 39 comps
| Address | Beds | Baths | Sqft | Rent | $/sqft | DOM | Units | Dist |
|---|---|---|---|---|---|---|---|---|
| 302 Kegley St Belton, TX | 2.0 | 2.0 | 1350 | $1,500 | $1.11 | 24d | 1 | 0.25mi |
| 907 Margaret Ann St Belton, TX | 3.0 | 2.0 | 1532 | $1,645 | $1.07 | 24d | 1 | 0.34mi |
| 1124 W Avenue O Belton, TX | 1.0–2.0 | 1.0–2.0 | 853 | $1,375 | $1.61 | 15d | 14 | 0.66mi |
| 1044 Hibiscus Dr Belton, TX | 2.0 | 2.0 | 1210 | $1,450 | $1.20 | 45d | 1 | 0.73mi |
| 1003 Laurel Dr Belton, TX | 1.0 | 1.0 | 904 | $1,295 | $1.43 | 24d | 1 | 0.77mi |
| 1057 Hibiscus Dr Belton, TX | 2.0 | 2.0 | 1210 | $1,450 | $1.20 | 45d | 1 | 0.77mi |
| 1075 Hibiscus Dr Belton, TX | 2.0 | 2.0 | 1210 | $1,450 | $1.20 | 45d | 1 | 0.77mi |
| 1221 Jasmine Dr Belton, TX | 1.0–2.0 | 1.0–2.0 | 1057 | $1,450 | $1.37 | 15d | 4 | 0.78mi |
| 1011 Laurel Dr Belton, TX | 1.0 | 1.0 | 904 | $1,295 | $1.43 | 45d | 1 | 0.80mi |
| 1538 Kal Ct Belton, TX | 3.0 | 2.0 | 1338 | $1,345 | $1.01 | 45d | 1 | 0.80mi |
| 1560 Kal Ct Belton, TX | 3.0 | 2.0 | 1338 | $1,345 | $1.01 | 22d | 1 | 0.83mi |
| 1539 Chance Ct Belton, TX | 3.0 | 2.0 | 1207 | $1,345 | $1.11 | 45d | 1 | 0.83mi |
| 1572 Brady Way Belton, TX | 3.0 | 2.0 | 1203 | $1,295 | $1.08 | 22d | 1 | 0.87mi |
| 1013 Laila Ln Belton, TX | 3.0 | 2.0 | 1338 | $1,240 | $0.93 | 24d | 1 | 0.88mi |
| 945 Laila Ln Belton, TX | 3.0 | 2.0 | 1338 | $1,345 | $1.01 | 45d | 1 | 0.89mi |
| 829 Laila Ln Belton, TX | 3.0 | 2.0 | 1338 | $1,345 | $1.01 | 24d | 1 | 0.90mi |
| 234 W 7th Ave Belton, TX | 2.0 | 1.0 | 986 | $855 | $0.87 | 24d | 1 | 0.91mi |
| 725 Laila Ln Belton, TX | 3.0 | 2.0 | 1207 | $1,345 | $1.11 | 15d | 1 | 0.91mi |
| 614 Laila Ln Belton, TX | 3.0 | 3.0 | 1510 | $1,575 | $1.04 | 45d | 1 | 0.92mi |
| 1032 Mason Dr Belton, TX | 3.0 | 2.0 | 1293 | $1,395 | $1.08 | 24d | 1 | 0.92mi |
| 1044 Edwards Dr Belton, TX | 3.0 | 2.0 | 1293 | $1,290 | $1.00 | 24d | 1 | 0.95mi |
| 1032 Edwards Dr Belton, TX | 3.0 | 2.0 | 1293 | $1,395 | $1.08 | 24d | 1 | 0.96mi |
| 912 Mason Dr Belton, TX | 3.0 | 2.0 | 1293 | $1,395 | $1.08 | 45d | 1 | 0.97mi |
| 912 Mason Dr Belton, TX | 3.0 | 2.0 | 1293 | $1,395 | $1.08 | 15d | 1 | 0.97mi |
| 1851 Connell St Belton, TX | 3.0 | 2.0 | 1344 | $1,550 | $1.15 | 45d | 1 | 0.98mi |
| 1903 Connell St Belton, TX | 3.0 | 2.0 | 1293 | $1,342 | $1.04 | 15d | 10 | 1.00mi |
| 1004 Kerr Ct Belton, TX | 3.0 | 2.0 | 1293 | $1,395 | $1.08 | 45d | 1 | 1.02mi |
| 1012 Kerr Ct Belton, TX | 3.0 | 2.0 | 1293 | $1,395 | $1.08 | 45d | 1 | 1.04mi |
| 1013 Kerr Ct Belton, TX | 3.0 | 2.0 | 1293 | $1,290 | $1.00 | 24d | 1 | 1.05mi |
| 415 E 4th Ave Belton, TX | 2.0 | 1.0 | 1148 | $1,200 | $1.05 | 45d | 1 | 1.08mi |
| 901 Carla Kay Dr Unit B Belton, TX | 3.0 | 2.5 | 1459 | $1,360 | $0.93 | 45d | 1 | 1.15mi |
| 902 N Wall St Belton, TX | 3.0 | 2.0 | 1572 | $1,800 | $1.15 | 15d | 1 | 1.24mi |
| 1027 N Wall St Belton, TX | 2.0 | 1.5 | 1000 | $1,025 | $1.02 | 45d | 1 | 1.32mi |
| 1031 N Wall St Belton, TX | 3.0 | 1.5 | 1300 | $1,060 | $0.82 | 24d | 1 | 1.33mi |
| 1124 N Penelope St Belton, TX | 3.0 | 2.5 | 1390 | $1,650 | $1.19 | 45d | 1 | 1.33mi |
| 301 W 14th Ave Belton, TX | 2.0 | 1.0 | 1229 | $1,250 | $1.02 | 45d | 1 | 1.36mi |
| 211 W 14th Ave Belton, TX | 3.0 | 2.0 | 1285 | $1,495 | $1.16 | 15d | 1 | 1.37mi |
| 1107 N Wall St Belton, TX | 3.0 | 2.0 | 1470 | $1,650 | $1.12 | 15d | 1 | 1.40mi |
| 1319 N Penelope St Belton, TX | 3.0 | 2.0 | 1494 | $1,795 | $1.20 | 45d | 1 | 1.49mi |
Listing history 18 events
-
2026-06-15status $199,000 Pending 15 DOM
-
2026-06-15days on market $199,000 Active Under Contract 15 DOM
-
2026-06-14days on market $199,000 Active Under Contract 13 DOM
-
2026-06-13statusdays on market $199,000 Active Under Contract 12 DOM
-
2026-06-10days on market $199,000 Active 10 DOM
-
2026-06-09days on market $199,000 Active 9 DOM
-
2026-06-08days on market $199,000 Active 8 DOM
-
2026-06-07days on market $199,000 Active 7 DOM
-
2026-06-05days on market $199,000 Active 4 DOM
-
2026-06-03days on market $199,000 Active 3 DOM
-
2026-06-02days on market $199,000 Active 2 DOM
-
2026-06-01days on market $199,000 Active 1 DOM
-
2026-05-31days on market $199,000 Active 10 DOM
-
2026-05-30days on market $199,000 Active 9 DOM
-
2026-05-21$199,000 Active
-
2001-08-17soldstatus
-
1997-03-25soldstatus
-
1994-07-29soldstatus
ⓘ Source: listings_history table (triggers on properties + properties_extension) + one-shot
backfill from property_details.listing_events for pre-trigger history.
Tax reassessment forecast TX · Resets to sale price
- Current annual tax
- $3,419 · $285/mo
- Projected year-2 tax
- $3,642 · $303/mo
- Expected delta
- +$223/yr (+$19/mo · 6.5%)
ⓘ Screening estimate from a state-policy table — verify with the county assessor before closing.
Climate risk First Street
- Flood 1/10 Low FEMA zone X (unshaded) · 0% chance over 30 yrs
- Wildfire 4/10 Moderate
- Heat 8/10 Severe 7 d/yr ≥108°F today · 25 d/yr by 30 yrs out
- Wind 6/10 Major 70% chance of damaging wind over 30 yrs
- Air quality 1/10 Low 0 unhealthy d/yr today · 0 by 30 yrs out
Nearby sold comps map
Loading sold comps map…
Walkable amenities ~0.75 mi
Loading nearby amenities…
Taxation est. · year 1
- Rental income
- $17,252
- − Mortgage interest
- −$11,147
- − Property taxes
- −$3,419
- − Insurance
- −$995
- − Repairs & maintenance
- −$1,380
- − Management
- −$1,380
- − Depreciation
- −$5,789
- Taxable loss
- −$6,858
- Est. tax savings @ 24.0%
- +$1,646
- After-tax cash flow
- $-1,662/yr
For passive investors: Depreciation is non-cash, so a rental often shows a tax loss while cash-flowing — sheltering income. Rental losses are passive: they offset passive income freely, and up to $25,000/yr can offset ordinary (W-2) income if you actively participate and your MAGI is under $100k (phasing out to $0 by $150k); unused losses carry forward. On sale, claimed depreciation is recaptured at up to 25%, and gains may owe capital-gains tax (a 1031 exchange can defer both). Figures are a year-1 estimate at your 24.0% rate — not tax advice; consult a CPA.
Schools (NCES district)
- District
- Belton ISD
- NCES district ID
- 4809860
- Math proficiency
- 39% ▼ -14.00%
- Reading proficiency
- 46% ▼ -4.00%
- Median HH income
- $61,239
- Composite
- 37.62/100
- National rank
- #4378
- State rank
- #285 of 826 in TX
Livability — Belton
- Score
- 68/100
- State rank
- #462
- US rank
- #9300
Category grades
Schools grade is shown separately in the Schools card above.
Census & demographics
- Census place
- Belton, TX
- County
- Bell County · 345,090 people
- City population
- 45,928
- Metro
- Killeen-Temple, TX
- Population (ZIP)
- 45,928
- Household income
- $80,661
- Rent vs Own
- Severe rent burden
- 1198.0
Population outlook (Bell County) Hauer SSP2
- Today (2025)
- 371,114 people
- By 2030
- 389,104 · +4.8%
- By 2040
- 420,592 · +13.3%
- By 2050
- 447,779 · +20.7%
- By 2075
- 499,130 · +34.5%
- By 2100
- 505,680 · +36.3%
Race, ethnicity, and origin ACS 2023
- Neighborhood character
- Majority White (62%)
- Race & ethnicity
- White 62% Hispanic / Latino 24% Two or more races 14% Black 6% Asian 2%
- Hispanic origin (detail)
- Mexican 19% Puerto Rican 1%
- Common ancestry
- Italian 3% Slovak 2% Lithuanian 2%
- Foreign-born
- 9% · Canada, Vietnam
- Languages at home
- 83% English-only · Spanish 13% Korean 1% Other Indo-European 1%
Political lean MEDSL · Bell
- 2024 margin
- R (+16.2) · D 41.3% · R 57.6% · Other 1.1%
- 2008→2024 swing
- -6.5pp toward R · 2008: -9.8pp · 2024: -16.2pp
- All cycles
- 2024: R+16.2 2020: R+8.5 2016: R+15.1 2012: R+16.4 2008: R+9.8
Not yet ingested
- Civics
- —
Market trends
- HPI YoY
- ▼ -105.10%
- Current HPI
- 183.6715
- Rent YoY
- ▲ 1.29%
- Metro
- Killeen-Temple, TX
- State GDP YoY
- ▲ 3.95%
- F500 in state
- 110
Industry mix (Fortune 500 HQ in TX)
| Industry | F500 HQs | Revenue |
|---|---|---|
| Energy | 16 | $1,198B |
|
||
| Technology | 5 | $198B |
|
||
| Engineering / Construction | 4 | $72B |
|
||
| Energy Services | 3 | $60B |
|
||
| Utilities | 3 | $41B |
|
||
| Healthcare | 2 | $330B |
|
||
Price history
4 events — show timeline
- 2026-05-21 Listed $199,000 CTXMLS
- 2001-08-17 Sold (Public Records) — Public Records
- 1997-03-25 Sold (Public Records) — Public Records
- 1994-07-29 Sold (Public Records) — Public Records
Property tax history
+4.3%/yrLatest (2025): $3,419 · +9.4% YoY. Source: county tax records.
Cash-flow waterfall
monthlySold comps — $/sqft
last 12 mo · ≤1 miLoading sold comps…