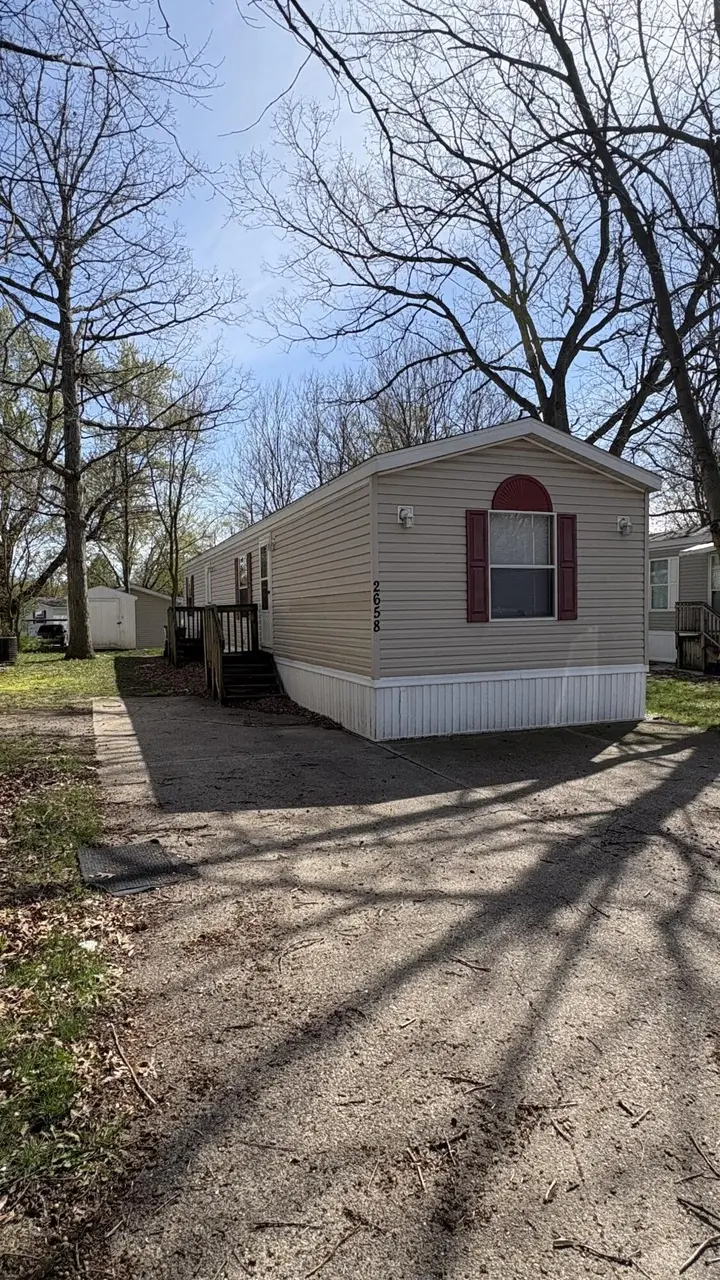
2658 Kitchener St SW · Wyoming, MI
Flood risk No data
- FEMA flood zone
- —
- Chance of flooding over 30 yrs
- —
- Est. flood insurance / yr
- —
Fire risk No data
- Est. fire insurance / yr
- —
Heat risk No data
- Hot days now (above threshold)
- —
- Hot days in 30 yrs
- —
Wind risk No data
- Chance of severe wind over 30 yrs
- —
Air-quality risk No data
- Unhealthy air days now
- —
- Unhealthy air days in 30 yrs
- —
Risk factors via First Street. Map © Google.
Why this score? — see what drove the B- grade
The composite is a weighted blend of 9 inputs, each scored 0–100. Each bar is that input's sub-score; the figure is the points it added to the 100-point composite (weight × sub-score).
- Cash flow +19.7/30.0
- ARV discount +15.0/15.0
- 1% rule +10.0/10.0
- DSCR +6.2/10.0
- Rent growth +5.0/5.0
- Schools +4.8/10.0
- Condition / age +4.0/5.0
- Livability +3.9/5.0
- Appreciation +0.0/10.0
$64,900
🖨 Deal sheet 📄 Offer letter ✓ Due diligence
Listing remarks
OBO-This manufactured home is located in a park and the transaction is subject to the park's approval of the buyer. Call Ferrands Estates for approval application at 616-538-9470. Located off of 44th Street in Wyoming. The Community features a swimming pool, playground, fitness center, clubhouse and much more. Near malls, stores, grocery, highway and more. Features two full baths. The monthly Park fee is $755
Key facts
- Built 2012
- Listed 43 days
Property features AI
Finance
- HOA & community: Association fee of $755 (includes trash, snow removal, and lawn/yard care); Association present
Exterior
- Home design: Residential property; Other architectural style; Built in 2012
- Construction: Vinyl siding
- Exterior features: Public water
Interior
- Kitchen: Dishwasher; Oven; Range; Refrigerator
- Bathrooms: 2 full bathrooms
- Heating & cooling: Forced air heating
- Interior features: Total of 4 rooms; Crawl space basement
- Laundry & utility: Dryer
Neighborhood map
What this means for you Summary
Snapshot
- This is a 2-bed/2.0-bath manufactured listed at $65k. Condition is rated good.
Deal economics
- At list price, monthly cash flow is $76 ($910/yr) — positive.
- The deal already cash-flows at list — no discount required.
- Meets the 1% rule at list price ($2k rent vs $65k).
- Recommended offer: $63k (3.0% below list) — sets the bar for market timing.
- Cap rate 7.7% vs local median 3.8% in Wyoming — top-decile yield for the area; either an underpriced asset or a hidden risk that comps aren't pricing in. Stress-test before assuming the spread holds.
Location & tenants
- Location reads 77/100 on livability (#126 in MI, #3,095 nationally) — a middle-class / working-renter tenant base. Strengths: cost of living A+, housing A+, health & safety A+; Watch: schools D+, crime D-, amenities F.
- Grandville Public Schools (suburban): math 49% / reading 61% proficiency, ranked #70 of 540 in MI (top 13%) — acceptable for families but not a draw, mixed tenant base, ~2y average lease.
- Market conditions: Rents rising fast (+10.5%/yr); 92 active listings in the ZIP; 5 comparable units currently listed for rent nearby; rentals leasing fast (median 3d on market — plan ~1-2 weeks tenant-placement turnaround); 2,253 units permitted in Kent County in 2024 (969 in 5+ unit buildings).
Forward outlook
- Local home prices are declining (-3.0%/yr); year-one equity from $449 of loan paydown is wiped out by about $2k of value loss. Plan a longer hold.
- Kent County population projected at +22% by 2050 — long-run rental-demand tailwind backs the buy-and-hold thesis.
- At projected returns (-3.0% appreciation + 8.0% rent growth), your $18k cash investment doubles in ~7 years — after that, you're playing with house money.
Negotiation context
- It's been on market 43 days — a 3% lower offer ($63k) is reasonable based on typical stale-listing flexibility.
Risks & watch-outs
- Watch-outs: HOA is 47% of rent.
Questions for the listing agent
- It's been on market 43 days. Have you received any prior offers? Is the seller open to a 3% concession, seller financing, or rate buy-down credit?
- What does the HOA fee cover, when was the last increase, and are there any pending special assessments or reserve-fund shortfalls?
- Is there a deadline driving the sale (1031 exchange, divorce, estate, relocation)? That informs how much negotiation room exists.
- Schools are D-rated, which usually means shorter tenancies and higher turnover. Who's the typical renter profile here, and what's been the actual vacancy rate?
- Crime grade is D in this area — have there been break-ins, vandalism, or insurance claims at this property in the last 3 years? What carrier currently insures it and at what premium?
- What's the average days-on-market for RENTAL listings here right now (not sales)? A rising rental-DOM trend means longer vacancies and softer asking-rent achievability than the comps imply.
- What's the recent tenant-quality profile in this submarket — average credit score on applications, eviction rate, late-payment / NSF rate, and stable-employment percentage? A property-management company in the area should have these aggregated.
- How much new for-sale + rental construction is in the pipeline within 1–3 miles? Heavy new supply typically softens prices + rents 12–24 months out; constrained supply supports both.
Investment metrics
- 1% rule
- 2.50% ✓
- Cap rate
- 7.70%
- Cash-on-cash
- 5.01%
- DSCR
- 1.22
- GRM
- 3.3
CMA / ARV
- ARV (median comp)
- $90,000
- List price
- $64,900
- Delta
- -39.00%
- Verdict
- UNDERPRICED
- Comps
- 1 within 2.0 mi
Show comp detail 1 sale within ~0.75 mi
| Address | Dist | Beds/Ba | Sqft | Sold | Price | $/sf | Match |
|---|---|---|---|---|---|---|---|
| 4743 Quebec Ave SW | 0.15mi | 3/2.0 (+1) | 1,056 (+1%) | 2mo | $90,000 | $85 | 86 |
Match score weights: distance 35% · size 25% · config 20% · recency 20%. Top-matched comps best support the ARV.
Projected returns pro-forma
-3.0% appreciation · 8.0% rent growth · sell at horizon
- IRR
- 4.3%
- Equity multiple
- 1.19×
- Total profit
- $3,362
- Equity at exit
- $9,677
- IRR
- 21.6%
- Equity multiple
- 3.76×
- Total profit
- $50,087
- Equity at exit
- $5,611
Cash invested: $18,172 (down + closing). Projections, not guarantees.
Landlord ↔ Tenant lean methodology
- Overall (STATE)
- 62 Landlord-Friendly
- State Michigan
- 62 Landlord-Friendly · EVEN
- County
- — inherits STATE
- City
- — inherits STATE
ZIP-level market 49519
- Rents YoY
- 10.5%
- Active inventory
- 92
- Price-to-rent
- 3.3×
Monthly cashflow live
- Estimated rent
- $1,619 high interval (Pro) →
- Mortgage (P&I)
- −$340
- Tax est. 1.5%
- −$81 /mo · $974/yr
- Insurance
- −$27
- HOA
- −$755
- Vacancy / Maint / Mgmt
- −$340
- Net cashflow
- $76
Break-even live
UW: 25.0% down · 7.5% · 30yr · 1.5% tax · 5.0% vac · 8.0% maint · 8.0% mgmt
Financing live
Cash to close
- Down payment
- $16,225
- Closing costs
- $1,947
- Reserves months
- —
- Total cash needed
- —
Loan-product check · same deal, 3 products live
Conventional
25% down · 7.5% · 30yr
- Down + closing
- —
- Monthly P&I
- —
- Monthly cashflow
- —
- DSCR
- —
- Eligible?
- —
Personal DTI + credit; lowest rate.
DSCR
20% down · 8.5% · 30yr
- Down + closing
- —
- Monthly P&I
- —
- Monthly cashflow
- —
- DSCR
- —
- Eligible?
- —
No personal income docs; deal must DSCR.
Hard money
10% down · 12.0% · 12mo
- Down + closing
- —
- Monthly P&I
- —
- Monthly cashflow
- —
- DSCR
- —
- Eligible?
- —
Short-term bridge; refi at stabilization.
Rent comps 5 comps
| Address | Beds | Baths | Sqft | Rent | $/sqft | DOM | Units | Dist |
|---|---|---|---|---|---|---|---|---|
| 4528 Halifax Ave SW Wyoming, MI | 3.0–4.0 | 1.0–2.0 | 1360 | $1,549 | $1.14 | 2d | 1 | 0.09mi |
| 4702 Rivertown Commons Dr SW Grandville, MI | 1.0–3.0 | 1.0–2.0 | 981 | $2,090 | $2.13 | 2d | 54 | 0.60mi |
| 1933 Iowa St SW Wyoming, MI | 3.0 | 1.0 | 1200 | $1,695 | $1.41 | 2d | 1 | 1.17mi |
| 3711 Groveland Ave SW Wyoming, MI | 3.0 | 2.0 | 1344 | $1,900 | $1.41 | 2d | 1 | 1.40mi |
| 6219 S Saint SW Grandville, MI | 1.0–3.0 | 1.0–3.5 | 1349 | $2,466 | $1.83 | 2d | 18 | 1.50mi |
HOA detail
- Monthly dues
- $755 · $9,060/yr
- Likely covers
- poolgym
Listing history 11 events
-
2026-06-08days on market $64,900 Active 43 DOM
-
2026-06-07days on market $64,900 Active 42 DOM
-
2026-06-05days on market $64,900 Active 39 DOM
-
2026-06-03days on market $64,900 Active 38 DOM
-
2026-06-03days on market $64,900 Active 37 DOM
-
2026-06-02price $64,900 Active 36 DOM
-
2026-06-01days on market $74,900 Active 36 DOM
-
2026-05-31days on market $74,900 Active 35 DOM
-
2026-04-20$74,900 Active 417-char remark
-
2026-04-20$74,900 Active 413-char remark
-
2026-04-20$74,900 Active
ⓘ Source: listings_history table (triggers on properties + properties_extension) + one-shot
backfill from property_details.listing_events for pre-trigger history.
Nearby sold comps map
Loading sold comps map…
Walkable amenities ~0.75 mi
Loading nearby amenities…
Taxation est. · year 1
- Rental income
- $19,434
- − Mortgage interest
- −$3,635
- − Property taxes
- −$974
- − Insurance
- −$324
- − Repairs & maintenance
- −$1,555
- − Management
- −$1,555
- − HOA
- −$9,060
- − Depreciation
- −$1,888
- Taxable income
- $443
- Est. tax owed @ 24.0%
- −$106
- After-tax cash flow
- $804/yr
For passive investors: Depreciation is non-cash, so a rental often shows a tax loss while cash-flowing — sheltering income. Rental losses are passive: they offset passive income freely, and up to $25,000/yr can offset ordinary (W-2) income if you actively participate and your MAGI is under $100k (phasing out to $0 by $150k); unused losses carry forward. On sale, claimed depreciation is recaptured at up to 25%, and gains may owe capital-gains tax (a 1031 exchange can defer both). Figures are a year-1 estimate at your 24.0% rate — not tax advice; consult a CPA.
Condition & rehab AI · 11 photos
This manufactured home is in good condition with a cosmetic rehab level, featuring good exterior, interior, and mechanical systems. It is located in a park with amenities, making it suitable for both resale and rental.
Value-add opportunities
- Resale Paint exterior siding — Fresh paint can enhance curb appeal and the home's overall appearance.
- Rental Clean gutters — Clean gutters improve drainage and prevent water damage, which is important for rental properties.
Renovation cost estimate screening
Value-add ROI direction
- Resale Paint exterior siding — Fresh paint can enhance curb appeal and the home's overall appearance. ↑
- Rental Clean gutters — Clean gutters improve drainage and prevent water damage, which is important for rental properties. ↑
ⓘ Cost ranges are severity-bucket heuristics (US national rule-of-thumb). Get contractor quotes + a written scope before underwriting a rehab budget.
Schools (NCES district)
- District
- Grandville Public Schools
- NCES district ID
- 2616470
- Math proficiency
- 49% ▼ -5.00%
- Reading proficiency
- 61% ▼ -1.00%
- Median HH income
- $58,935
- Composite
- 47.74/100
- National rank
- #2234
- State rank
- #70 of 540 in MI
Livability — Wyoming
- Score
- 77/100
- State rank
- #126
- US rank
- #3095
Category grades
Schools grade is shown separately in the Schools card above.
Census & demographics
- Census place
- Wyoming, MI
- County
- Kent County · 533,805 people
- City population
- 56,117
- Metro
- Grand Rapids-Kentwood, MI
- Population (ZIP)
- 27,965
- Household income
- $73,762
- Rent vs Own
- Severe rent burden
- 847.0
Population outlook (Kent County) Hauer SSP2
- Today (2025)
- 712,484 people
- By 2030
- 748,618 · +5.1%
- By 2040
- 814,777 · +14.4%
- By 2050
- 868,556 · +21.9%
- By 2075
- 966,487 · +35.7%
- By 2100
- 967,975 · +35.9%
Race, ethnicity, and origin ACS 2023
- Neighborhood character
- Predominantly White (66%)
- Race & ethnicity
- White 66% Hispanic / Latino 18% Two or more races 14% Black 9% Asian 2%
- Hispanic origin (detail)
- Mexican 13% Puerto Rican 2%
- Common ancestry
- Iranian 18% Romanian 5% Slovak 2%
- Foreign-born
- 8% · Canada
- Languages at home
- 85% English-only · Spanish 12% Other Indo-European 1%
Political lean MEDSL · Kent
- 2024 margin
- Lean D (+5.4) · D 51.8% · R 46.5% · Other 1.7%
- 2008→2024 swing
- +4.8pp toward D · 2008: 0.5pp · 2024: 5.4pp
- All cycles
- 2024: D+5.4 2020: D+6.1 2016: R+3.1 2012: R+7.9 2008: D+0.5
Not yet ingested
- Civics
- —
Market trends
- HPI YoY
- ▼ -244.17%
- Current HPI
- 274.6556
- Rent YoY
- ▲ 10.46%
- Metro
- Grand Rapids-Kentwood, MI
- State GDP YoY
- ▲ 1.37%
- F500 in state
- 28
Industry mix (Fortune 500 HQ in MI)
| Industry | F500 HQs | Revenue |
|---|---|---|
| Automotive Parts | 3 | $48B |
|
||
| Automotive | 2 | $372B |
|
||
| Chemicals | 1 | $45B |
|
||
| Automotive Retail | 1 | $29B |
|
||
| Healthcare / Medical Devices | 1 | $23B |
|
||
| Automotive Technology | 1 | $20B |
|
||
Cash-flow waterfall
monthlySold comps — $/sqft
last 12 mo · ≤1 miLoading sold comps…