40411 Valley Of The Fls · Oak Glen, CA
Flood risk 6/10 · Moderate
- FEMA flood zone
- X (unshaded)
- Chance of flooding over 30 yrs
- 0.75%
- Est. flood insurance / yr
- $507 – $1,088
Fire risk 7/10 · Major
- Est. fire insurance / yr
- $659 – $1,223
Heat risk 2/10 · Minimal
- Hot days now (above 82°F)
- 14 days/yr
- Hot days in 30 yrs
- 38 days/yr
Wind risk 1/10 · Minimal
- Chance of severe wind over 30 yrs
- —
Air-quality risk 10/10 · Severe
- Unhealthy air days now
- 42 days/yr
- Unhealthy air days in 30 yrs
- 50 days/yr
Risk factors via First Street. Map © Google.
Why this score? — see what drove the C+ grade
The composite is a weighted blend of 9 inputs, each scored 0–100. Each bar is that input's sub-score; the figure is the points it added to the 100-point composite (weight × sub-score).
- ARV discount +15.0/15.0
- Cash flow +13.9/30.0
- Appreciation +10.0/10.0
- 1% rule +6.4/10.0
- Schools +4.7/10.0
- DSCR +4.2/10.0
- Rent growth +2.5/5.0
- Condition / age +2.5/5.0
- Livability +2.0/5.0
$169,900
🖨 Deal sheet 📄 Offer letter ✓ Due diligence
Listing remarks MLS
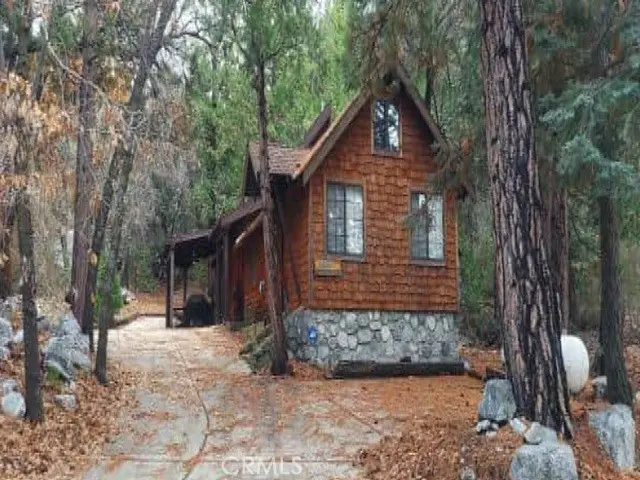
Want to get away to Forest Falls, CA. Nearby activities include Oak Tree Mountain and apple orchards. This home sits on 16,400 sq. ft. of land and has approx. 1,131 sq. ft. An affordable investment opportunity if you blink it will be SOLD. Buyers check City, County, Zoning, Tax, and other records to their satisfaction. AS-IS SALE property.
Key facts
- $148 HOA
- Garage
- Built 1925
Neighborhood map
What this means for you Summary
Snapshot
- This is a 2-bed/1.0-bath condo listed at $170k.
Deal economics
- At list price, monthly cash flow is $20 ($241/yr) — positive.
- The deal already cash-flows at list — no discount required.
- Meets the 1% rule at list price ($2k rent vs $170k).
- Recommended offer: $150k (12.0% below list) — sets the bar for market timing.
- Cap rate 6.4% vs local median 3.6% in Oak Glen — top-decile yield for the area; either an underpriced asset or a hidden risk that comps aren't pricing in. Stress-test before assuming the spread holds.
Location & tenants
- Location reads 40/100 on livability (#1,386 in CA) — a working-class tenant base; expect higher turnover. Strengths: housing A+, crime A; Watch: schools D, amenities F, commute F.
- Redlands Unified (urban): math 44% / reading 57% proficiency, ranked #390 of 1,400 in CA (top 28%) — acceptable for families but not a draw, mixed tenant base, ~2y average lease.
- Market conditions: 21 active listings in the ZIP; 5,458 units permitted in San Bernardino County in 2024 (1,500 in 5+ unit buildings).
Forward outlook
- In year one you build about $18k of equity ($1k loan paydown + $17k appreciation (10.0% local appreciation)).
- San Bernardino County population projected at +15% by 2050 — modest demand growth; plan on rents tracking national, not racing it.
- At projected returns (10.0% appreciation + 3.0% rent growth), your $48k cash investment doubles in ~3 years — after that, you're playing with house money.
- By year 3, paydown + projected appreciation supports a ~$46k cash-out refi (75% LTV) — recoverable capital for the next deal without selling this one.
Negotiation context
- It's been on market 152 days — a 12% lower offer ($150k) is reasonable based on typical stale-listing flexibility.
Risks & watch-outs
- Watch-outs: property tax is 2.9% of price; built in 1925 — expect roof / HVAC / electrical / plumbing capex.
- Climate carrying-cost: major flood risk; major wildfire risk — expect insurance premiums to compound above CPI over the hold.
Questions for the listing agent
- It's been on market 152 days. Have you received any prior offers? Is the seller open to a 12% concession, seller financing, or rate buy-down credit?
- Built in 1925 — when were the roof, HVAC, electrical panel, plumbing, and water heater last replaced?
- Property tax is high relative to price — has the assessment been appealed recently, and will the sale trigger a re-assessment?
- What does the HOA fee cover, when was the last increase, and are there any pending special assessments or reserve-fund shortfalls?
- Any open or pending special assessments — roof, HVAC, plumbing, elevator, façade? What's the per-unit balance and payoff schedule, and is the seller paying it off at close or rolling it to the buyer?
- Why hasn't it sold? Are there any deal-killer items the seller is aware of (foundation, flood, title, zoning, code violations)?
- Is there a deadline driving the sale (1031 exchange, divorce, estate, relocation)? That informs how much negotiation room exists.
- Schools are D-rated, which usually means shorter tenancies and higher turnover. Who's the typical renter profile here, and what's been the actual vacancy rate?
- What's the average days-on-market for RENTAL listings here right now (not sales)? A rising rental-DOM trend means longer vacancies and softer asking-rent achievability than the comps imply.
- What's the recent tenant-quality profile in this submarket — average credit score on applications, eviction rate, late-payment / NSF rate, and stable-employment percentage? A property-management company in the area should have these aggregated.
- How much new apartment / multifamily construction is in the pipeline within 1–3 miles? Heavy new supply (>2% of stock underway) typically softens rents 12–24 months out; light construction supports rent growth.
Investment metrics
- 1% rule
- 1.14% ✓
- Cap rate
- 6.43%
- Cash-on-cash
- 0.51%
- DSCR
- 1.02
- GRM
- 7.3
CMA / ARV
- ARV (median comp)
- $214,032
- List price
- $169,900
- Delta
- -20.62%
- Verdict
- UNDERPRICED
- Comps
- 2 within 1.0 mi
Projected returns pro-forma
10.0% appreciation · 3.0% rent growth · sell at horizon
- IRR
- 24.7%
- Equity multiple
- 2.98×
- Total profit
- $94,052
- Equity at exit
- $153,059
- IRR
- 21.9%
- Equity multiple
- 6.81×
- Total profit
- $276,436
- Equity at exit
- $330,078
Cash invested: $47,572 (down + closing). Projections, not guarantees.
Landlord ↔ Tenant lean methodology
- Overall (STATE)
- 18 Strongly Tenant-Friendly
- State California
- 18 Strongly Tenant-Friendly · D+13
- County
- — inherits STATE
- City
- — inherits STATE
ZIP-level market 92339
- Home prices YoY
- 9.8%
- Active inventory
- 21
- Price-to-rent
- 7.3×
Monthly cashflow live
- Estimated rent
- $1,945 medium interval (Pro) →
- Mortgage (P&I)
- −$891
- Tax from tax record
- −$406 /mo · $4,876/yr
- Insurance
- −$71
- HOA
- −$148
- Vacancy / Maint / Mgmt
- −$408
- Net cashflow
- $20
Break-even live
UW: 25.0% down · 7.5% · 30yr · 1.5% tax · 5.0% vac · 8.0% maint · 8.0% mgmt
Financing live
Cash to close
- Down payment
- $42,475
- Closing costs
- $5,097
- Reserves months
- —
- Total cash needed
- —
Loan-product check · same deal, 3 products live
Conventional
25% down · 7.5% · 30yr
- Down + closing
- —
- Monthly P&I
- —
- Monthly cashflow
- —
- DSCR
- —
- Eligible?
- —
Personal DTI + credit; lowest rate.
DSCR
20% down · 8.5% · 30yr
- Down + closing
- —
- Monthly P&I
- —
- Monthly cashflow
- —
- DSCR
- —
- Eligible?
- —
No personal income docs; deal must DSCR.
Hard money
10% down · 12.0% · 12mo
- Down + closing
- —
- Monthly P&I
- —
- Monthly cashflow
- —
- DSCR
- —
- Eligible?
- —
Short-term bridge; refi at stabilization.
HOA detail condo
- Monthly dues
- $148 · $1,776/yr
- Assessments
- None detected in remarks — confirm with the listing agent.
Listing history 22 events
-
2026-06-16days on market $169,900 Active 152 DOM
-
2026-06-15days on market $169,900 Active 151 DOM
-
2026-06-13days on market $169,900 Active 149 DOM
-
2026-06-13days on market $169,900 Active 148 DOM
-
2026-06-09days on market $169,900 Active 145 DOM
-
2026-06-08days on market $169,900 Active 144 DOM
-
2026-06-07days on market $169,900 Active 143 DOM
-
2026-06-04pricedays on market $169,900 Active 140 DOM
-
2026-06-03days on market $183,100 Active 139 DOM
-
2026-06-02days on market $183,100 Active 138 DOM
-
2026-06-01days on market $183,100 Active 137 DOM
-
2026-05-31days on market $183,100 Active 136 DOM
-
2026-05-14price $183,100 341-char remark
Show marketing remark (341 chars)
Want to get away to Forest Falls, CA. Nearby activities include Oak Tree Mountain and apple orchards. This home sits on 16,400 sq. ft. of land and has approx. 1,131 sq. ft. An affordable investment opportunity if you blink it will be SOLD. Buyers check City, County, Zoning, Tax, and other records to their satisfaction. AS-IS SALE property.
-
2026-04-22price $204,600 341-char remark
Show marketing remark (341 chars)
Want to get away to Forest Falls, CA. Nearby activities include Oak Tree Mountain and apple orchards. This home sits on 16,400 sq. ft. of land and has approx. 1,131 sq. ft. An affordable investment opportunity if you blink it will be SOLD. Buyers check City, County, Zoning, Tax, and other records to their satisfaction. AS-IS SALE property.
-
2026-04-07price $221,300 341-char remark
Show marketing remark (341 chars)
Want to get away to Forest Falls, CA. Nearby activities include Oak Tree Mountain and apple orchards. This home sits on 16,400 sq. ft. of land and has approx. 1,131 sq. ft. An affordable investment opportunity if you blink it will be SOLD. Buyers check City, County, Zoning, Tax, and other records to their satisfaction. AS-IS SALE property.
-
2026-03-23price $238,800 341-char remark
Show marketing remark (341 chars)
Want to get away to Forest Falls, CA. Nearby activities include Oak Tree Mountain and apple orchards. This home sits on 16,400 sq. ft. of land and has approx. 1,131 sq. ft. An affordable investment opportunity if you blink it will be SOLD. Buyers check City, County, Zoning, Tax, and other records to their satisfaction. AS-IS SALE property.
-
2026-03-05price $264,500 341-char remark
Show marketing remark (341 chars)
Want to get away to Forest Falls, CA. Nearby activities include Oak Tree Mountain and apple orchards. This home sits on 16,400 sq. ft. of land and has approx. 1,131 sq. ft. An affordable investment opportunity if you blink it will be SOLD. Buyers check City, County, Zoning, Tax, and other records to their satisfaction. AS-IS SALE property.
-
2026-02-17price $297,800 341-char remark
Show marketing remark (341 chars)
Want to get away to Forest Falls, CA. Nearby activities include Oak Tree Mountain and apple orchards. This home sits on 16,400 sq. ft. of land and has approx. 1,131 sq. ft. An affordable investment opportunity if you blink it will be SOLD. Buyers check City, County, Zoning, Tax, and other records to their satisfaction. AS-IS SALE property.
-
2026-02-02price $321,600 341-char remark
Show marketing remark (341 chars)
Want to get away to Forest Falls, CA. Nearby activities include Oak Tree Mountain and apple orchards. This home sits on 16,400 sq. ft. of land and has approx. 1,131 sq. ft. An affordable investment opportunity if you blink it will be SOLD. Buyers check City, County, Zoning, Tax, and other records to their satisfaction. AS-IS SALE property.
-
2026-01-15$349,800 Active 341-char remark
Show marketing remark (341 chars)
Want to get away to Forest Falls, CA. Nearby activities include Oak Tree Mountain and apple orchards. This home sits on 16,400 sq. ft. of land and has approx. 1,131 sq. ft. An affordable investment opportunity if you blink it will be SOLD. Buyers check City, County, Zoning, Tax, and other records to their satisfaction. AS-IS SALE property.
-
2006-01-03soldstatus $305,000
-
2002-10-24soldstatus $65,000
ⓘ Source: listings_history table (triggers on properties + properties_extension) + one-shot
backfill from property_details.listing_events for pre-trigger history.
Tax reassessment forecast CA · Resets to sale price
- Current annual tax
- $4,876 · $406/mo
- Projected year-2 tax
- $4,876 · $406/mo
- Expected delta
- $0/yr ($0/mo · 0.0%)
ⓘ Screening estimate from a state-policy table — verify with the county assessor before closing.
Climate risk First Street
- Flood 6/10 Major FEMA zone X (unshaded) · 75% chance over 30 yrs
- Wildfire 7/10 Severe
- Heat 2/10 Low 14 d/yr ≥82°F today · 38 d/yr by 30 yrs out
- Wind 1/10 Low
- Air quality 10/10 Extreme 42 unhealthy d/yr today · 50 by 30 yrs out
Nearby sold comps map
Loading sold comps map…
Walkable amenities ~0.75 mi
Loading nearby amenities…
Taxation est. · year 1
- Rental income
- $23,334
- − Mortgage interest
- −$9,517
- − Property taxes
- −$4,876
- − Insurance
- −$850
- − Repairs & maintenance
- −$1,867
- − Management
- −$1,867
- − HOA
- −$1,776
- − Depreciation
- −$4,943
- Taxable loss
- −$2,360
- Est. tax savings @ 24.0%
- +$566
- After-tax cash flow
- $808/yr
For passive investors: Depreciation is non-cash, so a rental often shows a tax loss while cash-flowing — sheltering income. Rental losses are passive: they offset passive income freely, and up to $25,000/yr can offset ordinary (W-2) income if you actively participate and your MAGI is under $100k (phasing out to $0 by $150k); unused losses carry forward. On sale, claimed depreciation is recaptured at up to 25%, and gains may owe capital-gains tax (a 1031 exchange can defer both). Figures are a year-1 estimate at your 24.0% rate — not tax advice; consult a CPA.
Schools (NCES district)
- District
- Redlands Unified
- NCES district ID
- 0632070
- Math proficiency
- 44% ▼ -1.00%
- Reading proficiency
- 57% ▼ -2.00%
- Median HH income
- $67,959
- Composite
- 46.88/100
- National rank
- #5185
- State rank
- #390 of 1400 in CA
Livability — Oak Glen
- Score
- 40/100
- State rank
- #1386
- US rank
- #27266
Category grades
Schools grade is shown separately in the Schools card above.
Census & demographics
- Population (ZIP)
- 1,277
Population outlook (San Bernardino County) Hauer SSP2
- Today (2025)
- 2,300,329 people
- By 2030
- 2,378,907 · +3.4%
- By 2040
- 2,523,137 · +9.7%
- By 2050
- 2,642,388 · +14.9%
- By 2075
- 2,880,769 · +25.2%
- By 2100
- 2,909,436 · +26.5%
Race, ethnicity, and origin ACS 2023
- Neighborhood character
- Diverse neighborhood (Simpson 0.60)
- Race & ethnicity
- White 57% Hispanic / Latino 27% Two or more races 21%
- Hispanic origin (detail)
- Mexican 22% Puerto Rican 1%
- Common ancestry
- Italian 3% Slovak 3% Iranian 1%
- Foreign-born
- 6% · Canada
- Languages at home
- 93% English-only · Spanish 7%
Political lean MEDSL · San Bernardino
- 2024 margin
- Toss-up / Even · D 47.5% · R 49.7% · Other 2.8%
- 2008→2024 swing
- -8.5pp toward R · 2008: 6.3pp · 2024: -2.1pp
- All cycles
- 2024: R+2.1 2020: D+10.7 2016: D+9.8 2012: D+5.4 2008: D+6.3
Not yet ingested
- Civics
- —
Market trends
- HPI YoY
- ▲ 26.65%
- Current HPI
- 298.6731
- Rent YoY
- —
- Metro
- —
- State GDP YoY
- ▲ 3.21%
- F500 in state
- 116
Industry mix (Fortune 500 HQ in CA)
| Industry | F500 HQs | Revenue |
|---|---|---|
| Technology | 27 | $1,492B |
|
||
| Financial Services | 3 | $174B |
|
||
| Retail | 3 | $44B |
|
||
| Insurance | 3 | $26B |
|
||
| Media / Entertainment | 2 | $115B |
|
||
| Pharmaceuticals / Biotech | 2 | $62B |
|
||
Price history
+181.7% since first listed10 events — show timeline
- 2026-05-14 Price Changed $183,100 CRMLS
- 2026-04-22 Price Changed $204,600 CRMLS
- 2026-04-07 Price Changed $221,300 CRMLS
- 2026-03-23 Price Changed $238,800 CRMLS
- 2026-03-05 Price Changed $264,500 CRMLS
- 2026-02-17 Price Changed $297,800 CRMLS
- 2026-02-02 Price Changed $321,600 CRMLS
- 2026-01-15 Listed $349,800 CRMLS
- 2006-01-03 Sold (Public Records) $305,000 Public Records
- 2002-10-24 Sold (Public Records) $65,000 Public Records
Property tax history
+3.2%/yrLatest (2025): $4,876 · +7.5% YoY. Source: county tax records.
Cash-flow waterfall
monthlySold comps — $/sqft
last 12 mo · ≤1 miLoading sold comps…