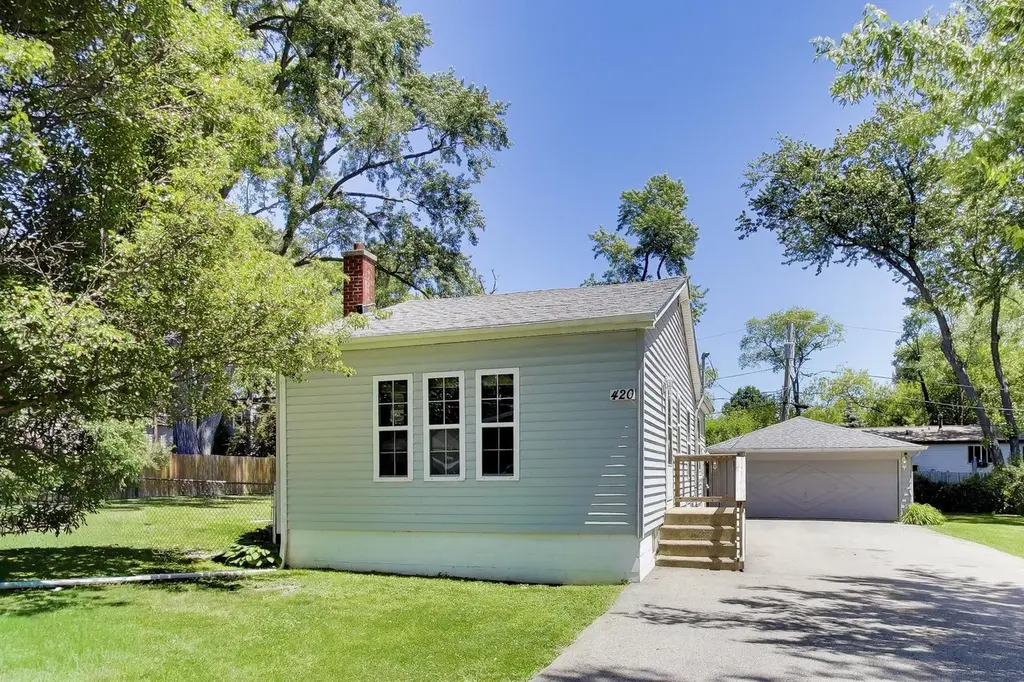
420 Lily Ln · Lakemoor, IL
Flood risk 1/10 · Minimal
- FEMA flood zone
- X (unshaded)
- Chance of flooding over 30 yrs
- 0.0%
- Est. flood insurance / yr
- $473 – $860
Fire risk 2/10 · Minimal
- Est. fire insurance / yr
- $804 – $1,492
Heat risk 2/10 · Minimal
- Hot days now (above 100°F)
- 7 days/yr
- Hot days in 30 yrs
- 14 days/yr
Wind risk 2/10 · Minimal
- Chance of severe wind over 30 yrs
- —
Air-quality risk 2/10 · Minimal
- Unhealthy air days now
- 1 days/yr
- Unhealthy air days in 30 yrs
- 2 days/yr
Risk factors via First Street. Map © Google.
Why this score? — see what drove the D- grade
The composite is a weighted blend of 9 inputs, each scored 0–100. Each bar is that input's sub-score; the figure is the points it added to the 100-point composite (weight × sub-score).
- Appreciation +10.0/10.0
- Cash flow +9.2/30.0
- 1% rule +3.7/10.0
- Livability +3.6/5.0
- Schools +2.7/10.0
- DSCR +2.6/10.0
- Rent growth +2.5/5.0
- Condition / age +2.5/5.0
- ARV discount +0.0/15.0
$224,900
🖨 Deal sheet (PDF) 📄 Offer letter ✓ Due diligence
Listing remarks
Welcome home to this charming and move-in ready ranch situated on an oversized . 31-acre lot in Lakemoor! Offering approximately 1,000 square feet of comfortable living space, this 2-bedroom, 1-bath home combines modern updates with everyday functionality. The spacious kitchen features newer cabinetry, recessed lighting, and an eat-in area perfect for casual meals and morning coffee. Neutral paint colors and updated flooring throughout create a bright, welcoming atmosphere that will complement any decor style. The 2nd bedroom can be used as a family room or flex space. Outside, you'll find one of the home's standout features-a huge yard with endless possibilities for entertaining, gardening
Key facts
- 0.31 acre lot
- 2 garage spots
- Built 1937
Property features AI
Finance
- Other: School bus service available; Property not currently leased
- HOA & community: No master association fee required
Exterior
- Parking: Two garage spaces in a detached garage; Concrete driveway; Garage with opener; owned garage and owned parking; Total parking for seven vehicles
- Utilities: Well water source; Public sewer
- Home design: Detached single-family home; One-story layout; Fee simple ownership; Built approximately 81–90 years ago; Estimated living area and main level area reported
- Construction: Vinyl siding exterior; Asphalt roof; Unfinished basement (approx. 654 sq ft)
- Exterior features: Deck; Fenced yard; Mature trees on the lot
Interior
- Kitchen: Kitchen on the main level
- Bedrooms: Two bedrooms (both on the main level); Master bedroom on the main level
- Flooring: Wood laminate flooring throughout main living areas and bedrooms; Window blinds installed in main living areas and bedrooms
- Bathrooms: One full bathroom
- Heating & cooling: Natural gas heating; Central air conditioning
- Interior features: Four total rooms; Basement is unfinished with partial crawl space
- Laundry & utility: Laundry in unit with utility sink
Neighborhood map
What this means for you Summary
Snapshot
- This is a 2-bed/1.0-bath single-family listed at $225k.
Deal economics
- At list price, monthly cash flow is $-168 ($-2k/yr) — negative.
- To cash-flow at today's rent, offer at most $195k (13.2% below list).
- To meet the 1% rule (rent ≥ 1% of price), the offer needs to be $196k (13.1% below list).
- Recommended offer: $195k (13.2% below list) — sets the bar for cash-flow.
- Cap rate 5.4% vs local median 3.9% in Lakemoor — top-decile yield for the area; either an underpriced asset or a hidden risk that comps aren't pricing in. Stress-test before assuming the spread holds.
Location & tenants
- Location reads 72/100 on livability (#317 in IL) — a middle-class / working-renter tenant base. Strengths: employment A+, housing A+, health & safety A-; Watch: amenities F, commute F.
- Mchenry Chsd 156 (suburban): math 27% / reading 30% proficiency, ranked #244 of 620 in IL (top 39%) — low school quality limits family demand, transient renter base, plan for 1-2y turnover.
- Zoned schools: Hilltop Elem School (math 22% / reading 22%, grade F, #940 of 2,056 statewide, top 49%, 461 students, 0% FRL); Mchenry Middle School (math 15% / reading 31%, grade F, #377 of 665 statewide, top 58%, 696 students, 0% FRL); Mchenry Community High School (2,222 students, 0% FRL).
- Market conditions: 151 active listings in the ZIP; 2 comparable units currently listed for rent nearby; 1,595 units permitted in McHenry County in 2024 (485 in 5+ unit buildings).
Forward outlook
- In year one you build about $24k of equity ($2k loan paydown + $22k appreciation (10.0% local appreciation)).
- McHenry County population projected at -12% by 2050 — secular population decline; favor cash flow + early exit over multi-decade hold.
- By year 2, paydown + projected appreciation supports a ~$39k cash-out refi (75% LTV) — recoverable capital for the next deal without selling this one.
Negotiation context
- It's been on market 17 days — a 2% lower offer ($222k) is reasonable based on typical stale-listing flexibility.
- Current owner paid $175k; 29% above their basis — modest negotiation headroom, anchor on the comps not their cost.
Risks & watch-outs
- Watch-outs: built in 1937 — expect roof / HVAC / electrical / plumbing capex.
Questions for the listing agent
- What do current leases actually rent for vs. the listed asking? Can we see a recent rent roll and the last 12 months of T-12 income?
- Built in 1937 — when were the roof, HVAC, electrical panel, plumbing, and water heater last replaced?
- Is there a deadline driving the sale (1031 exchange, divorce, estate, relocation)? That informs how much negotiation room exists.
- Schools are F-rated, which usually means shorter tenancies and higher turnover. Who's the typical renter profile here, and what's been the actual vacancy rate?
- The area grade is low — what's the realistic commute time and amenity access for the typical tenant pool here? Any planned neighborhood developments (good or bad) we should know about?
- What's the average days-on-market for RENTAL listings here right now (not sales)? A rising rental-DOM trend means longer vacancies and softer asking-rent achievability than the comps imply.
- What's the recent tenant-quality profile in this submarket — average credit score on applications, eviction rate, late-payment / NSF rate, and stable-employment percentage? A property-management company in the area should have these aggregated.
- How much new for-sale + rental construction is in the pipeline within 1–3 miles? Heavy new supply typically softens prices + rents 12–24 months out; constrained supply supports both.
Investment metrics
- 1% rule
- 0.87% ✗
- Cap rate
- 5.40%
- Cash-on-cash
- -3.20%
- DSCR
- 0.86
- GRM
- 9.6
CMA / ARV
- ARV (on-the-fly)
- $174,858
- Comps found
- 9
Show comp detail 9 sales within ~0.75 mi
| Address | Dist | Beds/Ba | Sqft | Sold | Price | $/sf | Match |
|---|---|---|---|---|---|---|---|
| 514 Tia Juana Dr | 0.14mi | 2/1.0 | 1,000 (+10%) | 6mo | $76,500 | $77 | 71 |
| 313 Tia Juana Dr | 0.14mi | 2/2.0 | 840 (-7%) | 13mo | $230,000 | $274 | 67 |
| 137 Park Rd | 0.44mi | 2/1.0 | 846 (-7%) | 14mo | $55,000 | $65 | 57 |
| 238 S Sheridan Rd | 0.54mi | 2/1.0 | 952 (+5%) | 13mo | $128,000 | $134 | 56 |
| 724 W Friendly Ave | 0.52mi | 2/2.0 | 789 (-13%) | 7mo | $185,000 | $234 | 44 |
| 112 S Sheridan Rd | 0.39mi | 2/1.5 | 1,016 (+12%) | 21mo | $196,000 | $193 | 42 |
| 819 Southside Ave | 0.61mi | 3/1.0 (+1) | 800 (-12%) | 8mo | $195,000 | $244 | 40 |
| 320 Glenwood Ave | 0.57mi | 3/1.0 (+1) | 780 (-14%) | 8mo | $256,000 | $328 | 38 |
| 816 West Blvd | 0.56mi | 2/1.0 | 1,025 (+13%) | 20mo | $175,000 | $171 | 35 |
Match score weights: distance 35% · size 25% · config 20% · recency 20%. Top-matched comps best support the ARV.
Projected returns pro-forma
10.0% appreciation · 3.0% rent growth · sell at horizon
- IRR
- 22.0%
- Equity multiple
- 2.78×
- Total profit
- $111,912
- Equity at exit
- $202,608
- IRR
- 19.8%
- Equity multiple
- 6.37×
- Total profit
- $338,230
- Equity at exit
- $436,931
Cash invested: $62,972 (down + closing). Projections, not guarantees.
Landlord ↔ Tenant lean methodology
- Overall (STATE)
- 43 Moderately Tenant-Leaning
- State Illinois
- 43 Moderately Tenant-Leaning · D+7
- County
- — inherits STATE
- City
- — inherits STATE
ZIP-level market 60051
- Home prices YoY
- 4.9%
- Active inventory
- 151
- Price-to-rent
- 9.6×
Monthly cashflow live
- Estimated rent
- $1,955 medium interval (Pro) →
- Mortgage (P&I)
- −$1,179
- Tax from tax record
- −$440 /mo · $5,277/yr
- Insurance
- −$94
- HOA
- −$0
- Vacancy / Maint / Mgmt
- −$411
- Net cashflow
- $-168
Break-even live
Sensitivity live
| Price | -10% $-41 | -5% $-104 | +0% $-168 | +5% $-232 | +10% $-295 |
|---|---|---|---|---|---|
| Rent | -10% $-323 | -5% $-245 | +0% $-168 | +5% $-91 | +10% $-14 |
| Rate | -1.0pp $-55 | -0.5pp $-111 | base $-168 | +0.5pp $-226 | +1.0pp $-286 |
UW: 25.0% down · 7.5% · 30yr · 1.5% tax · 5.0% vac · 8.0% maint · 8.0% mgmt
Financing live
Cash to close
- Down payment
- $56,225
- Closing costs
- $6,747
- Reserves months
- —
- Total cash needed
- —
Loan-product check · same deal, 3 products live
Conventional
25% down · 7.5% · 30yr
- Down + closing
- —
- Monthly P&I
- —
- Monthly cashflow
- —
- DSCR
- —
- Eligible?
- —
Personal DTI + credit; lowest rate.
DSCR
20% down · 8.5% · 30yr
- Down + closing
- —
- Monthly P&I
- —
- Monthly cashflow
- —
- DSCR
- —
- Eligible?
- —
No personal income docs; deal must DSCR.
Hard money
10% down · 12.0% · 12mo
- Down + closing
- —
- Monthly P&I
- —
- Monthly cashflow
- —
- DSCR
- —
- Eligible?
- —
Short-term bridge; refi at stabilization.
Rent comps 2 comps
| Address | Beds | Baths | Sqft | Rent | $/sqft | DOM | Units | Dist |
|---|---|---|---|---|---|---|---|---|
| 241 S Highland Dr Lakemoor, IL | 3.0 | 1.0 | 1125 | $1,750 | $1.56 | 17d | 1 | 0.59mi |
| 450 Sullivan Lake Blvd Lakemoor, IL | 1.0–2.0 | 1.0–2.5 | 1009 | $2,300 | $2.28 | 0d | 18 | 1.10mi |
Listing history 12 events
-
2026-06-21days on market $224,900 Active 17 DOM
-
2026-06-18days on market $224,900 Active 14 DOM
-
2026-06-17days on market $224,900 Active 13 DOM
-
2026-06-16days on market $224,900 Active 12 DOM
-
2026-06-15days on market $224,900 Active 11 DOM
-
2026-06-13days on market $224,900 Active 9 DOM
-
2026-06-13days on market $224,900 Active 8 DOM
-
2026-06-09days on market $224,900 Active 5 DOM
-
2026-06-08days on market $224,900 Active 4 DOM
-
2026-06-07days on market $224,900 Active 3 DOM
-
2026-06-04remarks 699-char remark
-
2026-06-04$224,900 Active 1 DOM
ⓘ Source: listings_history table (triggers on properties + properties_extension) + one-shot
backfill from property_details.listing_events for pre-trigger history.
Tax reassessment forecast IL · Partial reset (capped growth)
- Current annual tax
- $5,277 · $440/mo
- Projected year-2 tax
- $5,277 · $440/mo
- Expected delta
- $0/yr ($0/mo · 0.0%)
ⓘ Screening estimate from a state-policy table — verify with the county assessor before closing.
Climate risk First Street
- Flood 1/10 Low FEMA zone X (unshaded) · 0% chance over 30 yrs
- Wildfire 2/10 Low
- Heat 2/10 Low 7 d/yr ≥100°F today · 14 d/yr by 30 yrs out
- Wind 2/10 Low
- Air quality 2/10 Low 1 unhealthy d/yr today · 2 by 30 yrs out
Nearby sold comps map
Loading sold comps map…
Walkable amenities ~0.75 mi
Loading nearby amenities…
Taxation est. · year 1
- Rental income
- $23,465
- − Mortgage interest
- −$12,598
- − Property taxes
- −$5,277
- − Insurance
- −$1,124
- − Repairs & maintenance
- −$1,877
- − Management
- −$1,877
- − Depreciation
- −$6,543
- Taxable loss
- −$5,831
- Est. tax savings @ 24.0%
- +$1,399
- After-tax cash flow
- $-617/yr
For passive investors: Depreciation is non-cash, so a rental often shows a tax loss while cash-flowing — sheltering income. Rental losses are passive: they offset passive income freely, and up to $25,000/yr can offset ordinary (W-2) income if you actively participate and your MAGI is under $100k (phasing out to $0 by $150k); unused losses carry forward. On sale, claimed depreciation is recaptured at up to 25%, and gains may owe capital-gains tax (a 1031 exchange can defer both). Figures are a year-1 estimate at your 24.0% rate — not tax advice; consult a CPA.
Schools (NCES district)
- District
- Mchenry Chsd 156
- NCES district ID
- 1725320
- Math proficiency
- 27% ▼ -7.00%
- Reading proficiency
- 30% ▼ -7.00%
- Median HH income
- $66,681
- Composite
- 26.55/100
- National rank
- #7188
- State rank
- #244 of 620 in IL
Livability — Lakemoor
- Score
- 72/100
- State rank
- #317
- US rank
- #6294
Category grades
Schools grade is shown separately in the Schools card above.
Census & demographics
- Census place
- Lakemoor, IL
- Population (ZIP)
- 23,931
Population outlook (McHenry County) Hauer SSP2
- Today (2025)
- 305,342 people
- By 2030
- 301,491 · -1.3%
- By 2040
- 288,211 · -5.6%
- By 2050
- 268,430 · -12.1%
- By 2075
- 226,209 · -25.9%
- By 2100
- 181,247 · -40.6%
Race, ethnicity, and origin ACS 2023
- Neighborhood character
- Predominantly White (84%)
- Race & ethnicity
- White 84% Hispanic / Latino 10% Two or more races 6% Asian 2%
- Hispanic origin (detail)
- Mexican 8%
- Common ancestry
- Romanian 12% Slovak 2% Lithuanian 2%
- Foreign-born
- 5% · Canada
- Languages at home
- 92% English-only · Spanish 5% Other Indo-European 2% Russian/Polish/Slavic 1%
Political lean MEDSL · McHenry
- 2024 margin
- Lean R (+5.3) · D 46.6% · R 51.9% · Other 1.5%
- 2008→2024 swing
- -10.6pp toward R · 2008: 5.3pp · 2024: -5.3pp
- All cycles
- 2024: R+5.3 2020: R+2.5 2016: R+8.1 2012: R+8.8 2008: D+5.3
Not yet ingested
- Civics
- —
Market trends
- HPI YoY
- ▲ 28.50%
- Current HPI
- 612.07
- Rent YoY
- —
- Metro
- —
- State GDP YoY
- ▲ 1.59%
- F500 in state
- 60
Industry mix (Fortune 500 HQ in IL)
| Industry | F500 HQs | Revenue |
|---|---|---|
| Insurance | 4 | $201B |
|
||
| Consumer Goods | 4 | $87B |
|
||
| Industrial Machinery | 3 | $64B |
|
||
| Healthcare | 2 | $55B |
|
||
| Retail / Pharmacy | 1 | $148B |
|
||
| Agriculture / Food | 1 | $86B |
|
||
Price history
+28.5% since first listed2 events — show timeline
- 2026-06-04 Listed $224,900 MRED as Distributed by MLS Grid
- 2021-12-02 Sold (Public Records) $175,000 Public Records
Property tax history
+8.3%/yrLatest (2024): $5,277 · +2.7% YoY. Source: county tax records.
Cash-flow waterfall
monthlySold comps — $/sqft
last 12 mo · ≤1 miLoading sold comps…