1116 Lake Ter #207 · Boynton Beach, FL
Flood risk 4/10 · Minor
- FEMA flood zone
- X (unshaded)
- Chance of flooding over 30 yrs
- 0.2%
- Est. flood insurance / yr
- $507 – $1,088
Fire risk 1/10 · Minimal
- Est. fire insurance / yr
- $947 – $1,759
Heat risk 9/10 · Severe
- Hot days now (above 105°F)
- 6 days/yr
- Hot days in 30 yrs
- 22 days/yr
Wind risk 10/10 · Severe
- Chance of severe wind over 30 yrs
- 99.0%
Air-quality risk 2/10 · Minimal
- Unhealthy air days now
- 1 days/yr
- Unhealthy air days in 30 yrs
- 2 days/yr
Risk factors via First Street. Map © Google.
Why this score? — see what drove the B grade
The composite is a weighted blend of 9 inputs, each scored 0–100. Each bar is that input's sub-score; the figure is the points it added to the 100-point composite (weight × sub-score).
- Cash flow +30.0/30.0
- 1% rule +10.0/10.0
- DSCR +10.0/10.0
- ARV discount +7.5/15.0
- Schools +4.3/10.0
- Livability +3.6/5.0
- Rent growth +2.7/5.0
- Condition / age +2.5/5.0
- Appreciation +0.0/10.0
$95,000
🖨 Deal sheet (PDF) 📄 Offer letter ✓ Due diligence
Listing remarks MLS
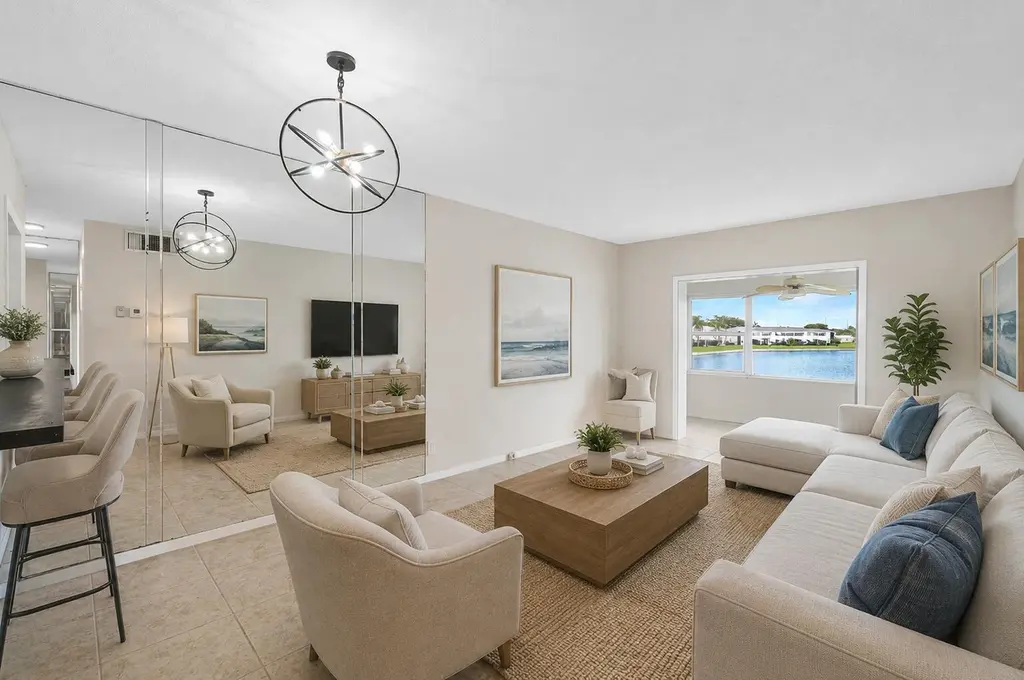
Turnkey fully furnished unit overlooking the lake. Community offers three pools which are heated in the winter and cooled in the summer, three club houses, 18 hole golf course and lots of activities in this 55+ community No pets and No pickup trucks.
Key facts
- Fitness center
- Lake views
- Updated condo
Tags
Property features AI
Finance
- HOA & community: Monthly association fee; Association amenities: Clubhouse, Golf Course, Pool, Sauna, Shuffleboard Court, Spa/Hot Tub, Bocce Ball, Community Room, Library, Putting Green, Security; Association fee includes insurance, grounds maintenance, structure maintenance, sewer, trash, water, common areas, and golf; Part of a senior community; Pets allowed (dogs OK, cats allowed; number limits may apply)
Exterior
- Parking: Assigned parking (11 total spaces)
- Security: Security patrol
- Utilities: Public water; Public sewer; Cable available; Electricity connected
- Home design: Condominium; Resale property; 2 total stories; Entry on level 2; Faces west
- Construction: Built with CBS construction; Shingle roof
- Exterior features: Waterfront (no specific waterfront features listed)
Interior
- Kitchen: Electric range; Refrigerator
- Bedrooms: 1 bedroom on the main level
- Flooring: Ceramic tile; Tile
- Bathrooms: 1 full bathroom
- Heating & cooling: Central electric heating; Central air; Ceiling fan(s)
- Interior features: Walk-in closet(s); Single-hung metal windows
Neighborhood map
What this means for you Summary
Snapshot
- This is a 1-bed/1.0-bath condo listed at $95k.
Deal economics
- At list price, monthly cash flow is $527 ($6k/yr) — positive.
- The deal already cash-flows at list — no discount required.
- Meets the 1% rule at list price ($2k rent vs $95k).
- Recommended offer: $94k (1.5% below list) — sets the bar for market timing.
Location & tenants
- Location reads 72/100 on livability (#351 in FL) — a middle-class / working-renter tenant base. Strengths: housing A+, health & safety B+, cost of living B; Watch: amenities D+, crime D-, commute F.
- Palm Beach (suburban): math 46% / reading 53% proficiency, ranked #34 of 73 in FL (top 47%) — families likely to look elsewhere, expect single-tenant / working-renter base with shorter leases.
- Zoned schools: Galaxy Elementary School (math 36% / reading 39%, grade F, #1,596 of 2,144 statewide, top 75%, 617 students, 87% FRL); Congress Community Middle School (math 21% / reading 28%, grade F, #522 of 571 statewide, top 93%, 988 students, 72% FRL); Boynton Beach Community High (math 13% / reading 25%, grade F, #565 of 667 statewide, top 85%, 1,547 students, 65% FRL) — zoned schools average 75% FRL vs 52% district-wide (23 pts higher); higher-poverty schools than district average — tighter screening recommended.
- Zoned-school proficiency averages 27% at this address vs 50% district-wide (-22 pts) — the specific schools serving this property underperform the Palm Beach average; the district grade overstates school quality for this exact location.
- Market conditions: Rents flat; 232 active listings in the ZIP; 8 comparable units currently listed for rent nearby; rentals leasing fast (median 13d on market — plan ~1-2 weeks tenant-placement turnaround); 3,974 units permitted in Palm Beach County in 2024 (1,012 in 5+ unit buildings).
Forward outlook
- Local home prices are declining (-3.0%/yr); year-one equity from $657 of loan paydown is wiped out by about $3k of value loss. Plan a longer hold.
- Palm Beach County population projected at +30% by 2050 — long-run rental-demand tailwind backs the buy-and-hold thesis.
- At projected returns (-3.0% appreciation + 0.9% rent growth), your $27k cash investment doubles in ~6 years — after that, you're playing with house money.
Negotiation context
- It's been on market 18 days — a 2% lower offer ($94k) is reasonable based on typical stale-listing flexibility.
- 5 sale attempts since 12y ago; this cycle's ask has dropped $13k (12%) from the opening price — seller is motivated, your offer sets the floor, not the list.
- Current owner paid $60k; list at $95k implies a 59% gain — meaningful room to come down on a strong offer.
Risks & watch-outs
- Watch-outs: HOA is 23% of rent.
- Climate carrying-cost: severe wind risk, 99% chance of damaging wind over 30y; extreme-heat days projected 6→22/yr by 2055 (HVAC capex compounding) — expect insurance premiums to compound above CPI over the hold.
Questions for the listing agent
- Built in 1973 — when were the roof, HVAC, electrical panel, plumbing, and water heater last replaced?
- What does the HOA fee cover, when was the last increase, and are there any pending special assessments or reserve-fund shortfalls?
- Any open or pending special assessments — roof, HVAC, plumbing, elevator, façade? What's the per-unit balance and payoff schedule, and is the seller paying it off at close or rolling it to the buyer?
- Is there a deadline driving the sale (1031 exchange, divorce, estate, relocation)? That informs how much negotiation room exists.
- Crime grade is D in this area — have there been break-ins, vandalism, or insurance claims at this property in the last 3 years? What carrier currently insures it and at what premium?
- What's the average days-on-market for RENTAL listings here right now (not sales)? A rising rental-DOM trend means longer vacancies and softer asking-rent achievability than the comps imply.
- What's the recent tenant-quality profile in this submarket — average credit score on applications, eviction rate, late-payment / NSF rate, and stable-employment percentage? A property-management company in the area should have these aggregated.
- How much new apartment / multifamily construction is in the pipeline within 1–3 miles? Heavy new supply (>2% of stock underway) typically softens rents 12–24 months out; light construction supports rent growth.
Investment metrics
- 1% rule
- 2.06% ✓
- Cap rate
- 12.95%
- Cash-on-cash
- 23.78%
- DSCR
- 2.06
- GRM
- 4.1
CMA / ARV
No comps found within radius.
Projected returns pro-forma
-3.0% appreciation · 0.93% rent growth · sell at horizon
- IRR
- 14.0%
- Equity multiple
- 1.54×
- Total profit
- $14,446
- Equity at exit
- $14,165
- IRR
- 20.8%
- Equity multiple
- 2.55×
- Total profit
- $41,136
- Equity at exit
- $8,214
Cash invested: $26,600 (down + closing). Projections, not guarantees.
Landlord ↔ Tenant lean methodology
- Overall (STATE)
- 87 Strongly Landlord-Friendly
- State Florida
- 87 Strongly Landlord-Friendly · R+3
- County
- — inherits STATE
- City
- — inherits STATE
ZIP-level market 33426
- Rents YoY
- 0.9%
- Active inventory
- 232
- Price-to-rent
- 4.1×
Monthly cashflow live
- Estimated rent
- $1,954 high interval (Pro) →
- Mortgage (P&I)
- −$498
- Tax from tax record
- −$33 /mo · $393/yr
- Insurance
- −$40
- HOA
- −$446
- Vacancy / Maint / Mgmt
- −$410
- Net cashflow
- $527
Break-even live
Sensitivity live
| Price | -10% $581 | -5% $554 | +0% $527 | +5% $500 | +10% $473 |
|---|---|---|---|---|---|
| Rent | -10% $373 | -5% $450 | +0% $527 | +5% $604 | +10% $682 |
| Rate | -1.0pp $575 | -0.5pp $551 | base $527 | +0.5pp $503 | +1.0pp $478 |
UW: 25.0% down · 7.5% · 30yr · 1.5% tax · 5.0% vac · 8.0% maint · 8.0% mgmt
Financing live
Cash to close
- Down payment
- $23,750
- Closing costs
- $2,850
- Reserves months
- —
- Total cash needed
- —
Loan-product check · same deal, 3 products live
Conventional
25% down · 7.5% · 30yr
- Down + closing
- —
- Monthly P&I
- —
- Monthly cashflow
- —
- DSCR
- —
- Eligible?
- —
Personal DTI + credit; lowest rate.
DSCR
20% down · 8.5% · 30yr
- Down + closing
- —
- Monthly P&I
- —
- Monthly cashflow
- —
- DSCR
- —
- Eligible?
- —
No personal income docs; deal must DSCR.
Hard money
10% down · 12.0% · 12mo
- Down + closing
- —
- Monthly P&I
- —
- Monthly cashflow
- —
- DSCR
- —
- Eligible?
- —
Short-term bridge; refi at stabilization.
Rent comps 8 comps
| Address | Beds | Baths | Sqft | Rent | $/sqft | DOM | Units | Dist |
|---|---|---|---|---|---|---|---|---|
| 1100 Audace Ave Boynton Beach, FL | 1.0–3.0 | 1.0–2.0 | 1021 | $2,012 | $1.97 | 0d | 22 | 0.73mi |
| 4 Renaissance Way #302 Boynton Beach, FL | 1.0 | 1.0 | 747 | $1,945 | $2.60 | 12d | 1 | 0.95mi |
| 2407 Renaissance Way Boynton Beach, FL | 1.0 | 1.0 | 744 | $1,950 | $2.62 | 9d | 1 | 1.03mi |
| 1660 Renaissance Commons Blvd Boynton Beach, FL | 1.0 | 1.0 | 798 | $1,962 | $2.46 | 0d | 2 | 1.13mi |
| 1690 Renaissance Commons Blvd Boynton Beach, FL | 2.0–3.0 | 2.0 | 940 | $2,300 | $2.45 | 1d | 3 | 1.13mi |
| 430 NW 12th Ave Unit A Boynton Beach, FL | 1.0 | 1.0 | 500 | $2,195 | $4.39 | 26d | 1 | 1.29mi |
| 408 NW 13th Ave Unit 2 Boynton Beach, FL | 1.0 | 1.0 | 400 | $1,375 | $3.44 | 26d | 1 | 1.36mi |
| 115 SW 1st Ave Boynton Beach, FL | 1.0–2.0 | 1.0–2.0 | 804 | $1,875 | $2.33 | 16d | 2 | 1.38mi |
HOA detail condo
- Monthly dues
- $446 · $5,352/yr
- Likely covers
- pool
- Assessments
- None detected in remarks — confirm with the listing agent.
Listing history 12 events
-
2026-06-21days on market $95,000 Active 18 DOM
-
2026-06-18days on market $95,000 Active 15 DOM
-
2026-06-17price $95,000 Active 14 DOM
-
2026-06-17days on market $108,000 Active 14 DOM
-
2026-06-16days on market $108,000 Active 13 DOM
-
2026-06-15days on market $108,000 Active 12 DOM
-
2026-06-13days on market $108,000 Active 10 DOM
-
2026-06-09days on market $108,000 Active 6 DOM
-
2026-06-08days on market $108,000 Active 5 DOM
-
2026-06-07days on market $108,000 Active 4 DOM
-
2026-06-04remarks 572-char remark
-
2026-06-04$108,000 Active 1 DOM
ⓘ Source: listings_history table (triggers on properties + properties_extension) + one-shot
backfill from property_details.listing_events for pre-trigger history.
Tax reassessment forecast FL · Resets to sale price
- Current annual tax
- $393 · $33/mo
- Projected year-2 tax
- $788 · $66/mo
- Expected delta
- +$396/yr (+$33/mo · 100.9%)
ⓘ Screening estimate from a state-policy table — verify with the county assessor before closing.
Climate risk First Street
- Flood 4/10 Moderate FEMA zone X (unshaded) · 20% chance over 30 yrs
- Wildfire 1/10 Low
- Heat 9/10 Extreme 6 d/yr ≥105°F today · 22 d/yr by 30 yrs out
- Wind 10/10 Extreme 99% chance of damaging wind over 30 yrs
- Air quality 2/10 Low 1 unhealthy d/yr today · 2 by 30 yrs out
Nearby sold comps map
Loading sold comps map…
Walkable amenities ~0.75 mi
Loading nearby amenities…
Taxation est. · year 1
- Rental income
- $23,448
- − Mortgage interest
- −$5,321
- − Property taxes
- −$393
- − Insurance
- −$475
- − Repairs & maintenance
- −$1,876
- − Management
- −$1,876
- − HOA
- −$5,352
- − Depreciation
- −$2,764
- Taxable income
- $5,392
- Est. tax owed @ 24.0%
- −$1,294
- After-tax cash flow
- $5,032/yr
For passive investors: Depreciation is non-cash, so a rental often shows a tax loss while cash-flowing — sheltering income. Rental losses are passive: they offset passive income freely, and up to $25,000/yr can offset ordinary (W-2) income if you actively participate and your MAGI is under $100k (phasing out to $0 by $150k); unused losses carry forward. On sale, claimed depreciation is recaptured at up to 25%, and gains may owe capital-gains tax (a 1031 exchange can defer both). Figures are a year-1 estimate at your 24.0% rate — not tax advice; consult a CPA.
Schools (NCES district)
- District
- Palm Beach
- NCES district ID
- 1201500
- Math proficiency
- 46% ▼ -16.00%
- Reading proficiency
- 53% ▼ -4.00%
- Median HH income
- $53,943
- Composite
- 42.72/100
- National rank
- #3160
- State rank
- #34 of 73 in FL
Livability — Boynton Beach
- Score
- 72/100
- State rank
- #351
- US rank
- #6098
Category grades
Schools grade is shown separately in the Schools card above.
Census & demographics
- Census place
- Boynton Beach, FL
- County
- Palm Beach County · 1,438,312 people
- City population
- 148,060
- Metro
- Miami-Fort Lauderdale-Pompano Beach, FL
- Population (ZIP)
- 24,255
- Household income
- $74,223
- Rent vs Own
- Severe rent burden
- 1417.0
Population outlook (Palm Beach County) Hauer SSP2
- Today (2025)
- 1,637,487 people
- By 2030
- 1,743,255 · +6.5%
- By 2040
- 1,948,712 · +19.0%
- By 2050
- 2,132,979 · +30.3%
- By 2075
- 2,530,027 · +54.5%
- By 2100
- 2,706,979 · +65.3%
Race, ethnicity, and origin ACS 2023
- Neighborhood character
- Diverse neighborhood (Simpson 0.66)
- Race & ethnicity
- White 51% Black 23% Hispanic / Latino 17% Two or more races 14% Asian 4%
- Hispanic origin (detail)
- Puerto Rican 3% Cuban 2%
- Common ancestry
- Hispanic 9% Romanian 2% Lithuanian 2%
- Foreign-born
- 29% · Canada, Jamaica, Vietnam
- Languages at home
- 66% English-only · Spanish 16% French/Haitian/Cajun 11% Other Indo-European 5%
Political lean MEDSL · Palm Beach
- 2024 margin
- Toss-up / Even · D 50.0% · R 49.2%
- 2008→2024 swing
- -22.1pp toward R · 2008: 22.9pp · 2024: 0.8pp
- All cycles
- 2024: D+0.8 2020: D+12.8 2016: D+15.3 2012: D+17.0 2008: D+22.9
Not yet ingested
- Civics
- —
Market trends
- HPI YoY
- ▼ -205.96%
- Current HPI
- 335.3805
- Rent YoY
- ▲ 0.93%
- Metro
- Miami-Fort Lauderdale-Pompano Beach, FL
- State GDP YoY
- ▲ 3.28%
- F500 in state
- 36
Industry mix (Fortune 500 HQ in FL)
| Industry | F500 HQs | Revenue |
|---|---|---|
| Industrial Technology | 2 | $29B |
|
||
| Insurance | 2 | $17B |
|
||
| Retail | 1 | $60B |
|
||
| Technology Distribution | 1 | $58B |
|
||
| Homebuilding | 1 | $35B |
|
||
| Technology Manufacturing | 1 | $35B |
|
||
Price history
+390.9% since first listed20 events — show timeline
- 2026-06-03 Listed $108,000 Beaches MLS
- 2022-10-24 Listing Removed — Beaches MLS
- 2022-10-22 Listed $129,000 Beaches MLS
- 2017-07-05 Sold (Public Records) $59,750 Public Records
- 2017-06-30 Sold (MLS) $59,750 Beaches MLS
- 2017-05-24 Pending — Beaches MLS
- 2017-04-12 Price Changed $63,000 Beaches MLS
- 2017-04-04 Listed $69,000 Beaches MLS
- 2016-07-14 Listing Removed — Beaches MLS
- 2014-09-02 Price Changed $59,500 Beaches MLS
- 2014-09-02 Price Changed $69,000 Beaches MLS
- 2014-07-17 Sold (Public Records) $49,000 Public Records
- 2014-07-15 Listed $63,500 Beaches MLS
- 2014-07-10 Sold (MLS) $49,000 Beaches MLS
- 2014-07-06 Pending — Beaches MLS
- 2014-06-19 Contingent — Beaches MLS
- 2014-06-17 Listed $53,000 Beaches MLS
- 2004-09-15 Sold (Public Records) $56,500 Public Records
- 1998-03-16 Sold (Public Records) $25,000 Public Records
- 1995-11-03 Sold (Public Records) $22,000 Public Records
Property tax history
-4.5%/yrLatest (2025): $393 · +4.2% YoY. Source: county tax records.
Cash-flow waterfall
monthlySold comps — $/sqft
last 12 mo · ≤1 miLoading sold comps…