385 Lone Ash Rd · Allisonia, VA
Flood risk 1/10 · Minimal
- FEMA flood zone
- X (unshaded)
- Chance of flooding over 30 yrs
- 0.0%
- Est. flood insurance / yr
- $507 – $1,088
Fire risk 5/10 · Moderate
- Est. fire insurance / yr
- $666 – $1,236
Heat risk 3/10 · Minor
- Hot days now (above 94°F)
- 7 days/yr
- Hot days in 30 yrs
- 19 days/yr
Wind risk 2/10 · Minimal
- Chance of severe wind over 30 yrs
- 1.0%
Air-quality risk 1/10 · Minimal
- Unhealthy air days now
- 0 days/yr
- Unhealthy air days in 30 yrs
- 0 days/yr
Risk factors via First Street. Map © Google.
Why this score? — see what drove the D- grade
The composite is a weighted blend of 9 inputs, each scored 0–100. Each bar is that input's sub-score; the figure is the points it added to the 100-point composite (weight × sub-score).
- Appreciation +8.6/10.0
- ARV discount +7.5/15.0
- Schools +6.0/10.0
- Cash flow +5.6/30.0
- Livability +2.7/5.0
- Rent growth +2.5/5.0
- Condition / age +2.5/5.0
- 1% rule +1.1/10.0
- DSCR +0.0/10.0
$195,000
🖨 Deal sheet (PDF) 📄 Offer letter ✓ Due diligence
Listing remarks MLS
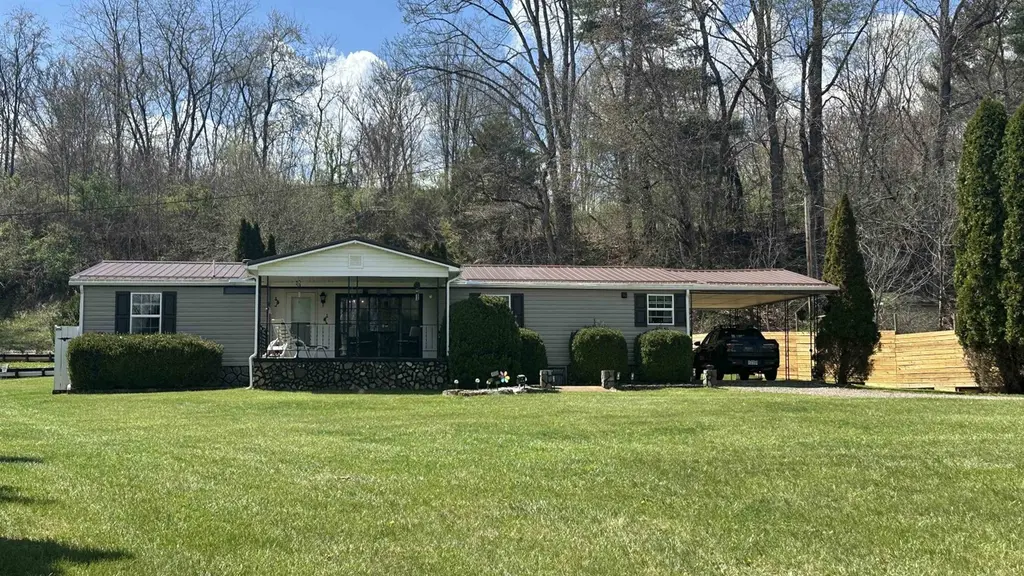
Updated home on . 73 acres with a large garden, outdoor cellar, and easy access to the New River Trail. Don’t miss this opportunity to own a well-maintained property in a peaceful rural setting. The mostly level lot offers a spacious garden area—perfect for outdoor living, raising chickens, or enjoying the surrounding nature, with frequent deer sightings adding to the charm. The home features several recent updates, including a new metal roof (2023), vinyl siding (2024), LVP flooring (2024), and a new Harman pellet stove (2025) for added comfort and efficiency. A 10x16 storage shed (2023) provides additional storage, along with a large outdoor cellar ideal for food storage or homesteading needs. Seller recently converted home to Public water. Conveniently located near the New River Trail, this property offers easy access to biking, fishing, and outdoor recreation while still maintaining privacy and tranquility. Perfect for a primary residence, second home, or investment opportunity.
Key facts
- New metal roof
- Recent updates
- Large garden
Tags
Neighborhood map
What this means for you Summary
Snapshot
- This is a 3-bed/2.0-bath manufactured listed at $195k.
Deal economics
- At list price, monthly cash flow is $-408 ($-5k/yr) — negative.
- To cash-flow at today's rent, offer at most $136k (30.3% below list).
- To meet the 1% rule (rent ≥ 1% of price), the offer needs to be $119k (39.0% below list).
- Recommended offer: $119k (39.0% below list) — sets the bar for 1% rule.
Location & tenants
- Location reads 53/100 on livability (#533 in VA) — a working-class tenant base; expect higher turnover. Strengths: cost of living B; Watch: amenities F, commute F, employment D-.
- Wythe County Public School District (rural): math 67% / reading 77% proficiency, ranked #20 of 131 in VA (top 15%) — strong family-tenant draw, lease renewals of 3-5y typical.
- Zoned schools: Jackson Memorial Elementary (math 57% / reading 67%, grade B, #480 of 1,108 statewide, top 46%, 212 students, 74% FRL); Fort Chiswell Middle (math 70% / reading 83%, grade A, #40 of 342 statewide, top 12%, 316 students, 74% FRL); Fort Chiswell High (math 52% / reading 72%, grade B-, #231 of 319 statewide, top 75%, 435 students, 73% FRL) — zoned schools average 74% FRL vs 41% district-wide (33 pts higher); higher-poverty schools than district average — tighter screening recommended.
- Market conditions: 4 active listings in the ZIP; 63 units permitted in Wythe County in 2024 (12 in 5+ unit buildings).
Forward outlook
- In year one you build about $15k of equity ($1k loan paydown + $14k appreciation (7.2% local appreciation)).
- Wythe County population projected to shrink 7% by 2050 — rents likely to lag national; underwrite the cash flow, not the appreciation.
- By year 3, paydown + projected appreciation supports a ~$38k cash-out refi (75% LTV) — recoverable capital for the next deal without selling this one.
Negotiation context
- It's been on market 75 days — a 6% lower offer ($183k) is reasonable based on typical stale-listing flexibility.
Risks & watch-outs
- Climate carrying-cost: moderate wildfire risk — expect insurance premiums to compound above CPI over the hold.
Questions for the listing agent
- What do current leases actually rent for vs. the listed asking? Can we see a recent rent roll and the last 12 months of T-12 income?
- It's been on market 75 days. Have you received any prior offers? Is the seller open to a 39% concession, seller financing, or rate buy-down credit?
- Why hasn't it sold? Are there any deal-killer items the seller is aware of (foundation, flood, title, zoning, code violations)?
- Is there a deadline driving the sale (1031 exchange, divorce, estate, relocation)? That informs how much negotiation room exists.
- The area grade is low — what's the realistic commute time and amenity access for the typical tenant pool here? Any planned neighborhood developments (good or bad) we should know about?
- What's the average days-on-market for RENTAL listings here right now (not sales)? A rising rental-DOM trend means longer vacancies and softer asking-rent achievability than the comps imply.
- What's the recent tenant-quality profile in this submarket — average credit score on applications, eviction rate, late-payment / NSF rate, and stable-employment percentage? A property-management company in the area should have these aggregated.
- How much new for-sale + rental construction is in the pipeline within 1–3 miles? Heavy new supply typically softens prices + rents 12–24 months out; constrained supply supports both.
Investment metrics
- 1% rule
- 0.61% ✗
- Cap rate
- 3.78%
- Cash-on-cash
- -8.98%
- DSCR
- 0.60
- GRM
- 13.7
CMA / ARV
No comps found within radius.
Projected returns pro-forma
7.23% appreciation · 3.0% rent growth · sell at horizon
- IRR
- 11.4%
- Equity multiple
- 1.82×
- Total profit
- $44,858
- Equity at exit
- $138,069
- IRR
- 12.1%
- Equity multiple
- 3.74×
- Total profit
- $149,647
- Equity at exit
- $264,975
Cash invested: $54,600 (down + closing). Projections, not guarantees.
Landlord ↔ Tenant lean methodology
- Overall (STATE)
- 55 Moderately Landlord-Leaning
- State Virginia
- 55 Moderately Landlord-Leaning · D+2
- County
- — inherits STATE
- City
- — inherits STATE
ZIP-level market 24313
- Home prices YoY
- 4.0%
- Active inventory
- 4
- Price-to-rent
- 13.7×
Monthly cashflow live
- Estimated rent
- $1,189 medium interval (Pro) →
- Mortgage (P&I)
- −$1,023
- Tax est. 1.5%
- −$244 /mo · $2,925/yr
- Insurance
- −$81
- HOA
- −$0
- Vacancy / Maint / Mgmt
- −$250
- Net cashflow
- $-408
Break-even live
Sensitivity live
| Price | -10% $-274 | -5% $-341 | +0% $-408 | +5% $-476 | +10% $-543 |
|---|---|---|---|---|---|
| Rent | -10% $-502 | -5% $-455 | +0% $-408 | +5% $-362 | +10% $-315 |
| Rate | -1.0pp $-310 | -0.5pp $-359 | base $-408 | +0.5pp $-459 | +1.0pp $-510 |
UW: 25.0% down · 7.5% · 30yr · 1.5% tax · 5.0% vac · 8.0% maint · 8.0% mgmt
Financing live
Cash to close
- Down payment
- $48,750
- Closing costs
- $5,850
- Reserves months
- —
- Total cash needed
- —
Loan-product check · same deal, 3 products live
Conventional
25% down · 7.5% · 30yr
- Down + closing
- —
- Monthly P&I
- —
- Monthly cashflow
- —
- DSCR
- —
- Eligible?
- —
Personal DTI + credit; lowest rate.
DSCR
20% down · 8.5% · 30yr
- Down + closing
- —
- Monthly P&I
- —
- Monthly cashflow
- —
- DSCR
- —
- Eligible?
- —
No personal income docs; deal must DSCR.
Hard money
10% down · 12.0% · 12mo
- Down + closing
- —
- Monthly P&I
- —
- Monthly cashflow
- —
- DSCR
- —
- Eligible?
- —
Short-term bridge; refi at stabilization.
Listing history 18 events
-
2026-06-21days on market $195,000 Active 75 DOM
-
2026-06-21days on market $195,000 Active 74 DOM
-
2026-06-18days on market $195,000 Active 72 DOM
-
2026-06-17days on market $195,000 Active 71 DOM
-
2026-06-16days on market $195,000 Active 70 DOM
-
2026-06-15days on market $195,000 Active 69 DOM
-
2026-06-15days on market $195,000 Active 68 DOM
-
2026-06-13days on market $195,000 Active 67 DOM
-
2026-06-12days on market $195,000 Active 66 DOM
-
2026-06-09days on market $195,000 Active 63 DOM
-
2026-06-08days on market $195,000 Active 62 DOM
-
2026-06-08days on market $195,000 Active 61 DOM
-
2026-06-07days on market $195,000 Active 60 DOM
-
2026-06-03days on market $195,000 Active 57 DOM
-
2026-06-02days on market $195,000 Active 56 DOM
-
2026-06-01days on market $195,000 Active 55 DOM
-
2026-05-31days on market $195,000 Active 54 DOM
-
2026-04-08$195,000 Active 1009-char remark
Show marketing remark (1009 chars)
Updated home on . 73 acres with a large garden, outdoor cellar, and easy access to the New River Trail. Don’t miss this opportunity to own a well-maintained property in a peaceful rural setting. The mostly level lot offers a spacious garden area—perfect for outdoor living, raising chickens, or enjoying the surrounding nature, with frequent deer sightings adding to the charm. The home features several recent updates, including a new metal roof (2023), vinyl siding (2024), LVP flooring (2024), and a new Harman pellet stove (2025) for added comfort and efficiency. A 10x16 storage shed (2023) provides additional storage, along with a large outdoor cellar ideal for food storage or homesteading needs. Seller recently converted home to Public water. Conveniently located near the New River Trail, this property offers easy access to biking, fishing, and outdoor recreation while still maintaining privacy and tranquility. Perfect for a primary residence, second home, or investment opportunity.
ⓘ Source: listings_history table (triggers on properties + properties_extension) + one-shot
backfill from property_details.listing_events for pre-trigger history.
Climate risk First Street
- Flood 1/10 Low FEMA zone X (unshaded) · 0% chance over 30 yrs
- Wildfire 5/10 Major
- Heat 3/10 Moderate 7 d/yr ≥94°F today · 19 d/yr by 30 yrs out
- Wind 2/10 Low 100% chance of damaging wind over 30 yrs
- Air quality 1/10 Low 0 unhealthy d/yr today · 0 by 30 yrs out
Nearby sold comps map
Loading sold comps map…
Walkable amenities ~0.75 mi
Loading nearby amenities…
Taxation est. · year 1
- Rental income
- $14,265
- − Mortgage interest
- −$10,923
- − Property taxes
- −$2,925
- − Insurance
- −$975
- − Repairs & maintenance
- −$1,141
- − Management
- −$1,141
- − Depreciation
- −$5,673
- Taxable loss
- −$8,513
- Est. tax savings @ 24.0%
- +$2,043
- After-tax cash flow
- $-2,859/yr
For passive investors: Depreciation is non-cash, so a rental often shows a tax loss while cash-flowing — sheltering income. Rental losses are passive: they offset passive income freely, and up to $25,000/yr can offset ordinary (W-2) income if you actively participate and your MAGI is under $100k (phasing out to $0 by $150k); unused losses carry forward. On sale, claimed depreciation is recaptured at up to 25%, and gains may owe capital-gains tax (a 1031 exchange can defer both). Figures are a year-1 estimate at your 24.0% rate — not tax advice; consult a CPA.
Schools (NCES district)
- District
- Wythe County Public School District
- NCES district ID
- 5104110
- Math proficiency
- 67% ▼ -23.00%
- Reading proficiency
- 77% ▼ -9.00%
- Median HH income
- $41,665
- Composite
- 60.19/100
- National rank
- #863
- State rank
- #20 of 131 in VA
Livability — Allisonia
- Score
- 53/100
- State rank
- #533
- US rank
- #24398
Category grades
Schools grade is shown separately in the Schools card above.
Census & demographics
- Population (ZIP)
- 831
Population outlook (Wythe County) Hauer SSP2
- Today (2025)
- 29,176 people
- By 2030
- 28,993 · -0.6%
- By 2040
- 28,273 · -3.1%
- By 2050
- 27,055 · -7.3%
- By 2075
- 23,668 · -18.9%
- By 2100
- 18,904 · -35.2%
Race, ethnicity, and origin ACS 2023
- Neighborhood character
- Predominantly White (90%)
- Race & ethnicity
- White 90% Two or more races 10%
- Common ancestry
- Serbian 3%
Political lean MEDSL · Wythe
- 2024 margin
- Solid R (+59.5) · D 19.9% · R 79.5%
- 2008→2024 swing
- -26.7pp toward R · 2008: -32.8pp · 2024: -59.5pp
- All cycles
- 2024: R+59.5 2020: R+57.0 2016: R+54.9 2012: R+36.8 2008: R+32.8
Not yet ingested
- Civics
- —
Market trends
- HPI YoY
- ▲ 7.23%
- Current HPI
- 189.1203
- Rent YoY
- —
- Metro
- —
- State GDP YoY
- ▲ 2.40%
- F500 in state
- 50
Industry mix (Fortune 500 HQ in VA)
| Industry | F500 HQs | Revenue |
|---|---|---|
| Aerospace / Defense | 4 | $236B |
|
||
| Technology / Defense | 3 | $32B |
|
||
| Financial Services | 2 | $176B |
|
||
| Utilities | 2 | $27B |
|
||
| Insurance | 2 | $25B |
|
||
| Technology | 2 | $15B |
|
||
Price history
1 event — show timeline
- 2026-04-08 Listed $195,000 NRVMLS
Cash-flow waterfall
monthlySold comps — $/sqft
last 12 mo · ≤1 miLoading sold comps…