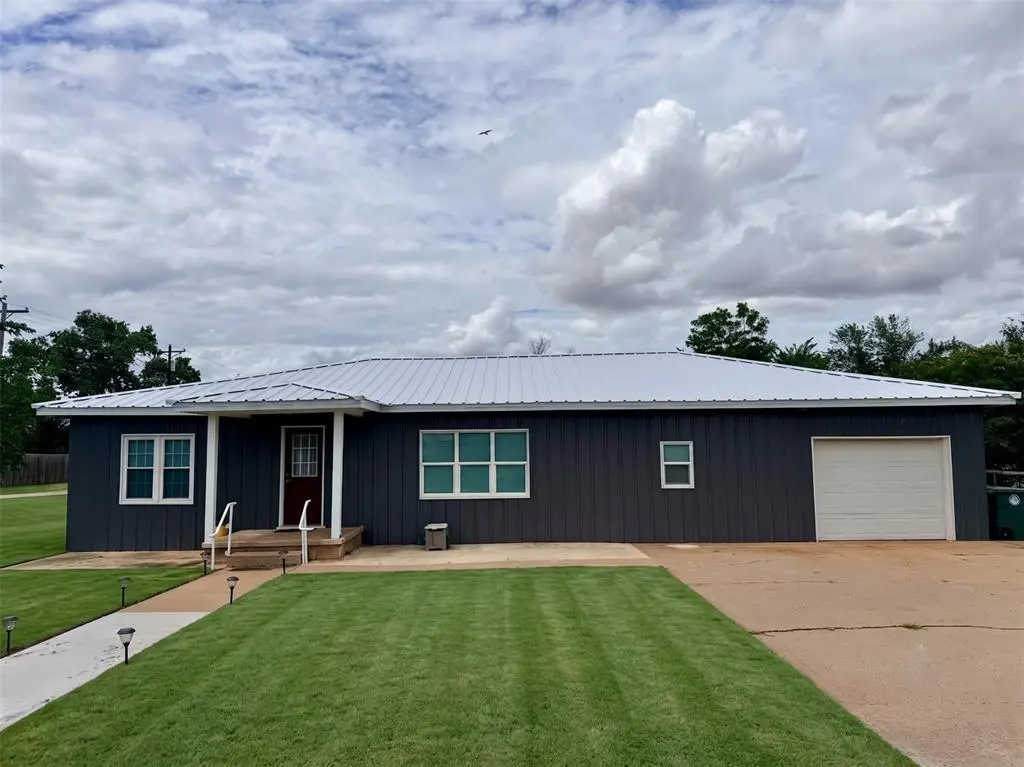
711 E Walnut St · Fairview, OK
Flood risk 4/10 · Minor
- FEMA flood zone
- X
- Chance of flooding over 30 yrs
- 0.22%
- Est. flood insurance / yr
- $507 – $1,088
Fire risk 5/10 · Moderate
- Est. fire insurance / yr
- $2,463 – $4,575
Heat risk 6/10 · Moderate
- Hot days now (above 109°F)
- 7 days/yr
- Hot days in 30 yrs
- 19 days/yr
Wind risk 2/10 · Minimal
- Chance of severe wind over 30 yrs
- 1.0%
Air-quality risk 2/10 · Minimal
- Unhealthy air days now
- 0 days/yr
- Unhealthy air days in 30 yrs
- 1 days/yr
Risk factors via First Street. Map © Google.
Why this score? — see what drove the D- grade
The composite is a weighted blend of 9 inputs, each scored 0–100. Each bar is that input's sub-score; the figure is the points it added to the 100-point composite (weight × sub-score).
- Cash flow +8.9/30.0
- ARV discount +7.5/15.0
- Appreciation +4.7/10.0
- Livability +3.6/5.0
- Schools +3.0/10.0
- DSCR +2.5/10.0
- Rent growth +2.5/5.0
- Condition / age +2.5/5.0
- 1% rule +1.4/10.0
$175,000
🖨 Deal sheet (PDF) 📄 Offer letter ✓ Due diligence
Listing remarks MLS
80% Conventional Loan @Farmers & Merchants Nat'l Bank of Fairview, 5% int, 7 yr Balloon 1580 sq ft mol per Courtnouse Records No Concessions pd by seller for buyer Appraised by Jami Brownlee Property sells "As Is-Where Is" Sellers will make no repairs. This house is located in close proximity to the high school campus and also the elementary and middle school complex in Fairview; so good spot for the kiddos! Sits on large lot with very nice backyard. Heat and air units were replaced in 2014. Great potential!
Key facts
- Custom accent wall
- Utility room
- All-new appliances
Tags
Property features AI
Finance
- Other: Homestead status claimed
- Financial info: Eligible for cash, conventional, Rural Housing Services, or VA financing; Loan qualifying information available; Not assumable
- HOA & community: No mandatory association dues
Exterior
- Parking: 1-car garage
- Utilities: Cable available; Electricity available; Public utilities
- Home design: Single-family residence; One-level home; Faces south
- Construction: Metal siding; Metal roof; Built as existing property; Conventional foundation
- Exterior features: Covered porch; Chain-link fencing; Interior lot
Interior
- Kitchen: Free-standing electric range and oven; Dishwasher
- Bedrooms: 4 bedrooms
- Flooring: Carpet; Tile; Vinyl
- Bathrooms: 2 full bathrooms
- Heating & cooling: Electric heating
- Interior features: Dishwasher included; No fireplace
- Laundry & utility: Garage door lift (mechanical feature)
Neighborhood map
What this means for you Summary
Snapshot
- This is a 3-bed/2.0-bath single-family listed at $175k.
Deal economics
- At list price, monthly cash flow is $-141 ($-2k/yr) — negative.
- To cash-flow at today's rent, offer at most $150k (14.3% below list).
- To meet the 1% rule (rent ≥ 1% of price), the offer needs to be $111k (36.4% below list).
- Recommended offer: $111k (36.4% below list) — sets the bar for 1% rule.
Location & tenants
- Location reads 72/100 on livability (#22 in OK) — a middle-class / working-renter tenant base. Strengths: crime A+, cost of living A+, housing A+; Watch: health & safety C-, amenities F, commute F.
- Fairview (rural): math 34% / reading 35% proficiency, ranked #40 of 270 in OK (top 15%) — families likely to look elsewhere, expect single-tenant / working-renter base with shorter leases.
- Zoned schools: Cornelsen Es (math 42% / reading 32%, grade F, #132 of 845 statewide, top 19%, 377 students, 0% FRL); Chamberlain Ms (math 32% / reading 37%, grade F, #24 of 345 statewide, top 8%, 167 students, 0% FRL); Fairview Hs (math 34% / reading 34%, grade F, #48 of 447 statewide, top 14%, 211 students, 0% FRL) — zoned schools average 0% FRL vs 41% district-wide (41 pts lower); this property's tenant base skews higher-income than the district average.
- Market conditions: 10 active listings in the ZIP; 2 units permitted in Major County in 2024 (0 in 5+ unit buildings).
Forward outlook
- In year one you build about $144 of equity ($1k loan paydown + $-1k appreciation (-0.6% local appreciation)).
- Major County population projected at +19% by 2050 — long-run rental-demand tailwind backs the buy-and-hold thesis.
Negotiation context
- It's been on market 15 days — a 2% lower offer ($172k) is reasonable based on typical stale-listing flexibility.
- 2 sale attempts since 10y ago with the ask held roughly flat each time — persistent listings suggest the price (not the market) is what's stuck; bring a comps-based counter.
- Current owner paid $65k; list at $175k implies a 169% gain — meaningful room to come down on a strong offer.
Risks & watch-outs
- Watch-outs: built in 1950 — expect roof / HVAC / electrical / plumbing capex.
- Climate carrying-cost: moderate wildfire risk; extreme-heat days projected 7→19/yr by 2055 (HVAC capex compounding) — expect insurance premiums to compound above CPI over the hold.
Questions for the listing agent
- What do current leases actually rent for vs. the listed asking? Can we see a recent rent roll and the last 12 months of T-12 income?
- Built in 1950 — when were the roof, HVAC, electrical panel, plumbing, and water heater last replaced?
- Is there a deadline driving the sale (1031 exchange, divorce, estate, relocation)? That informs how much negotiation room exists.
- The area grade is low — what's the realistic commute time and amenity access for the typical tenant pool here? Any planned neighborhood developments (good or bad) we should know about?
- What's the average days-on-market for RENTAL listings here right now (not sales)? A rising rental-DOM trend means longer vacancies and softer asking-rent achievability than the comps imply.
- What's the recent tenant-quality profile in this submarket — average credit score on applications, eviction rate, late-payment / NSF rate, and stable-employment percentage? A property-management company in the area should have these aggregated.
- How much new for-sale + rental construction is in the pipeline within 1–3 miles? Heavy new supply typically softens prices + rents 12–24 months out; constrained supply supports both.
Investment metrics
- 1% rule
- 0.64% ✗
- Cap rate
- 5.32%
- Cash-on-cash
- -3.46%
- DSCR
- 0.85
- GRM
- 13.1
CMA / ARV
No comps found within radius.
Projected returns pro-forma
-0.61% appreciation · 3.0% rent growth · sell at horizon
- IRR
- -8.8%
- Equity multiple
- 0.61×
- Total profit
- $-19,180
- Equity at exit
- $45,548
- IRR
- -2.3%
- Equity multiple
- 0.77×
- Total profit
- $-11,189
- Equity at exit
- $50,706
Cash invested: $49,000 (down + closing). Projections, not guarantees.
Landlord ↔ Tenant lean methodology
- Overall (STATE)
- 83 Strongly Landlord-Friendly
- State Oklahoma
- 83 Strongly Landlord-Friendly · R+20
- County
- — inherits STATE
- City
- — inherits STATE
ZIP-level market 73737
- Home prices YoY
- -0.3%
- Active inventory
- 10
- Price-to-rent
- 13.1×
Monthly cashflow live
- Estimated rent
- $1,113 medium interval (Pro) →
- Mortgage (P&I)
- −$918
- Tax from tax record
- −$30 /mo · $363/yr
- Insurance
- −$73
- HOA
- −$0
- Vacancy / Maint / Mgmt
- −$234
- Net cashflow
- $-141
Break-even live
Sensitivity live
| Price | -10% $-42 | -5% $-92 | +0% $-141 | +5% $-390 | +10% $-451 |
|---|---|---|---|---|---|
| Rent | -10% $-229 | -5% $-185 | +0% $-141 | +5% $-98 | +10% $-54 |
| Rate | -1.0pp $-53 | -0.5pp $-97 | base $-141 | +0.5pp $-187 | +1.0pp $-233 |
UW: 25.0% down · 7.5% · 30yr · 1.5% tax · 5.0% vac · 8.0% maint · 8.0% mgmt
Financing live
Cash to close
- Down payment
- $43,750
- Closing costs
- $5,250
- Reserves months
- —
- Total cash needed
- —
Loan-product check · same deal, 3 products live
Conventional
25% down · 7.5% · 30yr
- Down + closing
- —
- Monthly P&I
- —
- Monthly cashflow
- —
- DSCR
- —
- Eligible?
- —
Personal DTI + credit; lowest rate.
DSCR
20% down · 8.5% · 30yr
- Down + closing
- —
- Monthly P&I
- —
- Monthly cashflow
- —
- DSCR
- —
- Eligible?
- —
No personal income docs; deal must DSCR.
Hard money
10% down · 12.0% · 12mo
- Down + closing
- —
- Monthly P&I
- —
- Monthly cashflow
- —
- DSCR
- —
- Eligible?
- —
Short-term bridge; refi at stabilization.
Listing history 12 events
-
2026-06-21days on market $175,000 Active 15 DOM
-
2026-06-21days on market $175,000 Active 14 DOM
-
2026-06-18days on market $175,000 Active 12 DOM
-
2026-06-17days on market $175,000 Active 11 DOM
-
2026-06-16days on market $175,000 Active 10 DOM
-
2026-06-15days on market $175,000 Active 9 DOM
-
2026-06-13days on market $175,000 Active 7 DOM
-
2026-06-12days on market $175,000 Active 6 DOM
-
2026-06-09days on market $175,000 Active 3 DOM
-
2026-06-08days on market $175,000 Active 2 DOM
-
2026-06-07remarks 631-char remark
-
2026-06-07$175,000 Active 1 DOM
ⓘ Source: listings_history table (triggers on properties + properties_extension) + one-shot
backfill from property_details.listing_events for pre-trigger history.
Tax reassessment forecast OK · Resets to sale price
- Current annual tax
- $363 · $30/mo
- Projected year-2 tax
- $1,575 · $131/mo
- Expected delta
- +$1,212/yr (+$101/mo · 333.9%)
ⓘ Screening estimate from a state-policy table — verify with the county assessor before closing.
Climate risk First Street
- Flood 4/10 Moderate FEMA zone X · 22% chance over 30 yrs
- Wildfire 5/10 Major
- Heat 6/10 Major 7 d/yr ≥109°F today · 19 d/yr by 30 yrs out
- Wind 2/10 Low 100% chance of damaging wind over 30 yrs
- Air quality 2/10 Low 0 unhealthy d/yr today · 1 by 30 yrs out
Nearby sold comps map
Loading sold comps map…
Walkable amenities ~0.75 mi
Loading nearby amenities…
Taxation est. · year 1
- Rental income
- $13,358
- − Mortgage interest
- −$9,803
- − Property taxes
- −$363
- − Insurance
- −$875
- − Repairs & maintenance
- −$1,069
- − Management
- −$1,069
- − Depreciation
- −$5,091
- Taxable loss
- −$4,911
- Est. tax savings @ 24.0%
- +$1,179
- After-tax cash flow
- $-519/yr
For passive investors: Depreciation is non-cash, so a rental often shows a tax loss while cash-flowing — sheltering income. Rental losses are passive: they offset passive income freely, and up to $25,000/yr can offset ordinary (W-2) income if you actively participate and your MAGI is under $100k (phasing out to $0 by $150k); unused losses carry forward. On sale, claimed depreciation is recaptured at up to 25%, and gains may owe capital-gains tax (a 1031 exchange can defer both). Figures are a year-1 estimate at your 24.0% rate — not tax advice; consult a CPA.
Schools (NCES district)
- District
- Fairview
- NCES district ID
- 4011280
- Math proficiency
- 34% ▼ -6.00%
- Reading proficiency
- 35% ▼ -8.00%
- Median HH income
- $47,230
- Composite
- 29.67/100
- National rank
- #6464
- State rank
- #40 of 270 in OK
Livability — Fairview
- Score
- 72/100
- State rank
- #22
- US rank
- #5863
Category grades
Schools grade is shown separately in the Schools card above.
Census & demographics
- Census place
- Fairview, OK
- Population (ZIP)
- 3,618
Population outlook (Major County) Hauer SSP2
- Today (2025)
- 8,197 people
- By 2030
- 8,447 · +3.0%
- By 2040
- 9,030 · +10.2%
- By 2050
- 9,753 · +19.0%
- By 2075
- 12,114 · +47.8%
- By 2100
- 13,913 · +69.7%
Race, ethnicity, and origin ACS 2023
- Neighborhood character
- Predominantly White (83%)
- Race & ethnicity
- White 83% Two or more races 11% Hispanic / Latino 9% Native American 2%
- Hispanic origin (detail)
- Mexican 8%
- Common ancestry
- Iranian 4% Romanian 4% Portuguese 2%
- Foreign-born
- 1% · Canada
- Languages at home
- 96% English-only · Spanish 4%
Political lean MEDSL · Major
- 2024 margin
- Solid R (+79.4) · D 9.4% · R 88.8% · Other 1.8%
- 2008→2024 swing
- -9.0pp toward R · 2008: -70.3pp · 2024: -79.4pp
- All cycles
- 2024: R+79.4 2020: R+79.7 2016: R+77.4 2012: R+71.6 2008: R+70.3
Not yet ingested
- Civics
- —
Market trends
- HPI YoY
- ▼ -0.61%
- Current HPI
- 180.6875
- Rent YoY
- —
- Metro
- —
- State GDP YoY
- ▲ 1.55%
- F500 in state
- 6
Industry mix (Fortune 500 HQ in OK)
| Industry | F500 HQs | Revenue |
|---|---|---|
| Energy | 3 | $48B |
|
||
Price history
+276.3% since first listed4 events — show timeline
- 2026-06-06 Listed $175,000 MLSOK
- 2024-12-05 Sold (Public Records) $65,000 Public Records
- 2017-01-09 Sold (MLS) $32,000 NWOAR
- 2016-11-15 Listed $46,500 NWOAR
Property tax history
+13.4%/yrLatest (2025): $363 · -0.3% YoY. Source: county tax records.
Cash-flow waterfall
monthlySold comps — $/sqft
last 12 mo · ≤1 miLoading sold comps…