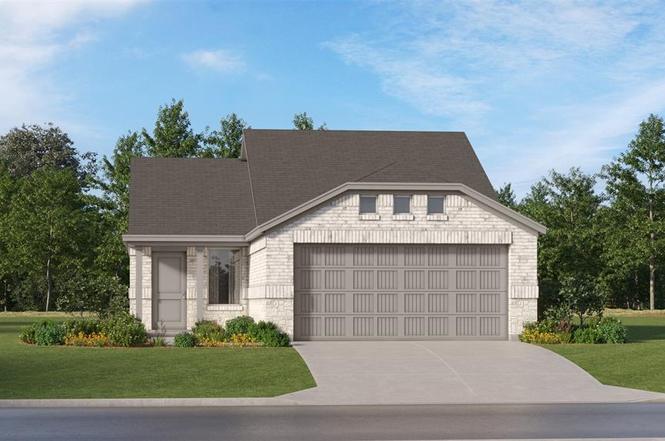
2152 Jesse James Ln · Burleson, TX
Flood risk No data
- FEMA flood zone
- —
- Chance of flooding over 30 yrs
- —
- Est. flood insurance / yr
- —
Fire risk No data
- Est. fire insurance / yr
- —
Heat risk No data
- Hot days now (above threshold)
- —
- Hot days in 30 yrs
- —
Wind risk No data
- Chance of severe wind over 30 yrs
- —
Air-quality risk No data
- Unhealthy air days now
- —
- Unhealthy air days in 30 yrs
- —
Risk factors via First Street. Map © Google.
Why this score? — see what drove the C+ grade
The composite is a weighted blend of 9 inputs, each scored 0–100. Each bar is that input's sub-score; the figure is the points it added to the 100-point composite (weight × sub-score).
- Cash flow +24.3/30.0
- ARV discount +11.0/15.0
- DSCR +7.8/10.0
- 1% rule +6.6/10.0
- Schools +4.5/10.0
- Livability +4.0/5.0
- Rent growth +2.5/5.0
- Condition / age +2.2/5.0
- Appreciation +0.0/10.0
$228,999
🖨 Deal sheet (PDF) 📄 Offer letter ✓ Due diligence
Listing remarks
LENNAR - Frontier - Kitson Floorplan
Key facts
- 6,011 sq ft lot
- 2 garage spots
- Built 2025
Neighborhood map
What this means for you Summary
Snapshot
- This is a 3-bed/2.0-bath single-family listed at $229k. Condition is rated fair.
Deal economics
- At list price, monthly cash flow is $461 ($6k/yr) — positive.
- The deal already cash-flows at list — no discount required.
- Meets the 1% rule at list price ($3k rent vs $229k).
- Cap rate 8.7% vs local median 3.5% in Burleson — top-decile yield for the area; either an underpriced asset or a hidden risk that comps aren't pricing in. Stress-test before assuming the spread holds.
Location & tenants
- Location reads 79/100 on livability (#53 in TX, #2,133 nationally) — a middle-class / working-renter tenant base. Strengths: employment A+, cost of living A+, housing A+; Watch: amenities F, commute F.
- Joshua ISD (rural): math 52% / reading 50% proficiency, ranked #139 of 826 in TX (top 17%) — acceptable for families but not a draw, mixed tenant base, ~2y average lease.
- Zoned schools: H D Staples El (math 44% / reading 38%, grade F, #1,462 of 4,322 statewide, top 34%, 435 students, 65% FRL); R C Loflin Middle (math 41% / reading 45%, grade D-, #540 of 1,662 statewide, top 33%, 730 students, 55% FRL); Joshua H S (math 67% / reading 15%, grade F, #774 of 1,632 statewide, top 49%, 1,242 students, 44% FRL).
- Market conditions: 421 active listings in the ZIP; 1 comparable units currently listed for rent nearby; 2,152 units permitted in Johnson County in 2024 (76 in 5+ unit buildings).
Forward outlook
- Local home prices are declining (-3.0%/yr); year-one equity from $2k of loan paydown is wiped out by about $7k of value loss. Plan a longer hold.
- Johnson County population projected at +24% by 2050 — long-run rental-demand tailwind backs the buy-and-hold thesis.
Negotiation context
- Only 7 days on market — expect competitive offers; lowballing is unlikely to land.
Questions for the listing agent
- Have any recent inspections been done? Can we get a copy of the seller's disclosures and any deferred-maintenance estimates?
- What does the HOA fee cover, when was the last increase, and are there any pending special assessments or reserve-fund shortfalls?
- Is there a deadline driving the sale (1031 exchange, divorce, estate, relocation)? That informs how much negotiation room exists.
- What's the average days-on-market for RENTAL listings here right now (not sales)? A rising rental-DOM trend means longer vacancies and softer asking-rent achievability than the comps imply.
- What's the recent tenant-quality profile in this submarket — average credit score on applications, eviction rate, late-payment / NSF rate, and stable-employment percentage? A property-management company in the area should have these aggregated.
- How much new for-sale + rental construction is in the pipeline within 1–3 miles? Heavy new supply typically softens prices + rents 12–24 months out; constrained supply supports both.
Investment metrics
- 1% rule
- 1.16% ✓
- Cap rate
- 8.71%
- Cash-on-cash
- 8.63%
- DSCR
- 1.38
- GRM
- 7.2
CMA / ARV
- ARV (on-the-fly)
- $248,121
- Comps found
- 8
Show comp detail 8 sales within ~0.75 mi
| Address | Dist | Beds/Ba | Sqft | Sold | Price | $/sf | Match |
|---|---|---|---|---|---|---|---|
| 2152 Jesse James Ln | 0.00mi | 3/2.0 | 1,451 (0%) | 1mo | $228,999 | $158 | 100 |
| 2144 Jesse James Ln | 0.00mi | 3/2.0 | 1,461 (+1%) | 1mo | $219,849 | $150 | 98 |
| 2200 Doc Holiday Rd | 0.00mi | 3/2.0 | 1,302 (-10%) | 2mo | $246,999 | $190 | 82 |
| 2148 Jesse James Ln | 0.00mi | 4/2.0 (+1) | 1,656 (+14%) | 2mo | $240,999 | $146 | 70 |
| 2428 County Road 911 | 0.61mi | 3/2.0 | 1,442 (-1%) | 1mo | $390,000 | $270 | 69 |
| 2133 W Fm 917 | 0.45mi | 3/1.0 | 1,456 (+0%) | 9mo | $245,000 | $168 | 67 |
| 5824 Thousand Oaks Dr | 0.60mi | 4/2.0 (+1) | 1,580 (+9%) | 4mo | $269,900 | $171 | 49 |
| 5815 Thousand Oaks Dr | 0.72mi | 2/2.5 (-1) | 1,316 (-9%) | 13mo | $227,250 | $173 | 33 |
Match score weights: distance 35% · size 25% · config 20% · recency 20%. Top-matched comps best support the ARV.
Projected returns pro-forma
-3.0% appreciation · 3.0% rent growth · sell at horizon
- IRR
- -3.2%
- Equity multiple
- 0.88×
- Total profit
- $-7,679
- Equity at exit
- $34,144
- IRR
- 6.5%
- Equity multiple
- 1.49×
- Total profit
- $31,403
- Equity at exit
- $19,800
Cash invested: $64,120 (down + closing). Projections, not guarantees.
Landlord ↔ Tenant lean methodology
- Overall (STATE)
- 87 Strongly Landlord-Friendly
- State Texas
- 87 Strongly Landlord-Friendly · R+5
- County
- — inherits STATE
- City
- — inherits STATE
ZIP-level market 76058
- Home prices YoY
- -24.5%
- Active inventory
- 421
- Price-to-rent
- 7.2×
Monthly cashflow live
- Estimated rent
- $2,650 medium interval (Pro) →
- Mortgage (P&I)
- −$1,201
- Tax est. 1.5%
- −$286 /mo · $3,435/yr
- Insurance
- −$95
- HOA
- −$50
- Vacancy / Maint / Mgmt
- −$556
- Net cashflow
- $461
Break-even live
Sensitivity live
| Price | -10% $619 | -5% $540 | +0% $461 | +5% $382 | +10% $303 |
|---|---|---|---|---|---|
| Rent | -10% $252 | -5% $356 | +0% $461 | +5% $566 | +10% $670 |
| Rate | -1.0pp $576 | -0.5pp $519 | base $461 | +0.5pp $402 | +1.0pp $341 |
UW: 25.0% down · 7.5% · 30yr · 1.5% tax · 5.0% vac · 8.0% maint · 8.0% mgmt
Financing live
Cash to close
- Down payment
- $57,250
- Closing costs
- $6,870
- Reserves months
- —
- Total cash needed
- —
Loan-product check · same deal, 3 products live
Conventional
25% down · 7.5% · 30yr
- Down + closing
- —
- Monthly P&I
- —
- Monthly cashflow
- —
- DSCR
- —
- Eligible?
- —
Personal DTI + credit; lowest rate.
DSCR
20% down · 8.5% · 30yr
- Down + closing
- —
- Monthly P&I
- —
- Monthly cashflow
- —
- DSCR
- —
- Eligible?
- —
No personal income docs; deal must DSCR.
Hard money
10% down · 12.0% · 12mo
- Down + closing
- —
- Monthly P&I
- —
- Monthly cashflow
- —
- DSCR
- —
- Eligible?
- —
Short-term bridge; refi at stabilization.
Rent comps 1 comps
| Address | Beds | Baths | Sqft | Rent | $/sqft | DOM | Units | Dist |
|---|---|---|---|---|---|---|---|---|
| 1612 Caddo Peak Trl Joshua, TX | 3.0 | 3.0 | 1504 | $2,650 | $1.76 | 12d | 1 | 1.00mi |
HOA detail
- Monthly dues
- $50 · $600/yr
Listing history 3 events
-
2026-02-28status Pending
-
2026-02-25price $228,999
-
2026-02-21$248,999 Active
ⓘ Source: listings_history table (triggers on properties + properties_extension) + one-shot
backfill from property_details.listing_events for pre-trigger history.
Nearby sold comps map
Loading sold comps map…
Walkable amenities ~0.75 mi
Loading nearby amenities…
Taxation est. · year 1
- Rental income
- $31,800
- − Mortgage interest
- −$12,828
- − Property taxes
- −$3,435
- − Insurance
- −$1,145
- − Repairs & maintenance
- −$2,544
- − Management
- −$2,544
- − HOA
- −$600
- − Depreciation
- −$6,662
- Taxable income
- $2,043
- Est. tax owed @ 24.0%
- −$490
- After-tax cash flow
- $5,041/yr
For passive investors: Depreciation is non-cash, so a rental often shows a tax loss while cash-flowing — sheltering income. Rental losses are passive: they offset passive income freely, and up to $25,000/yr can offset ordinary (W-2) income if you actively participate and your MAGI is under $100k (phasing out to $0 by $150k); unused losses carry forward. On sale, claimed depreciation is recaptured at up to 25%, and gains may owe capital-gains tax (a 1031 exchange can defer both). Figures are a year-1 estimate at your 24.0% rate — not tax advice; consult a CPA.
Condition & rehab AI · 3 photos
The home is in fair condition with moderate repairs needed, primarily in landscaping and exterior painting. Enhancing these areas can significantly increase its value for both resale and rental purposes.
Repairs flagged
- Minor Landscaping — The lawn and landscaping appear overgrown and could benefit from trimming and planting.
- Minor Exterior paint — The siding appears to be in good condition, but the paint could benefit from touch-ups or repainting to enhance curb appeal.
Value-add opportunities
- Both Landscaping and exterior painting — Enhancing the landscaping and exterior paint will improve the home's curb appeal and potentially increase both resale and rental value.
- Both Interior updates — Updating the interior can significantly increase the home's value, making it more attractive to potential buyers or renters.
Renovation cost estimate screening
| Repair item | Severity | Est. cost |
|---|---|---|
| Landscaping · The lawn and landscaping appear overgrown and could benefit from trimming and planting. | Minor | $500–3,000 |
| Exterior paint · The siding appears to be in good condition, but the paint could benefit from touch-ups or repainting to enhance curb appeal. | Minor | $500–3,000 |
| Total estimated repair cost · 2 items | $1,000–6,000 |
Value-add ROI direction
- Both Landscaping and exterior painting — Enhancing the landscaping and exterior paint will improve the home's curb appeal and potentially increase both resale and rental value. ↑
- Both Interior updates — Updating the interior can significantly increase the home's value, making it more attractive to potential buyers or renters. ↑
ⓘ Cost ranges are severity-bucket heuristics (US national rule-of-thumb). Get contractor quotes + a written scope before underwriting a rehab budget.
Schools (NCES district)
- District
- Joshua ISD
- NCES district ID
- 4824930
- Math proficiency
- 52% ▼ -7.00%
- Reading proficiency
- 50% ▼ -1.00%
- Median HH income
- $60,696
- Composite
- 44.65/100
- National rank
- #2769
- State rank
- #139 of 826 in TX
Livability — Burleson
- Score
- 79/100
- State rank
- #53
- US rank
- #2133
Category grades
Schools grade is shown separately in the Schools card above.
Census & demographics
- Census place
- Burleson, TX
- City population
- 81,549
- Population (ZIP)
- 21,531
Population outlook (Johnson County) Hauer SSP2
- Today (2025)
- 179,678 people
- By 2030
- 189,208 · +5.3%
- By 2040
- 207,261 · +15.4%
- By 2050
- 223,064 · +24.1%
- By 2075
- 259,979 · +44.7%
- By 2100
- 275,395 · +53.3%
Race, ethnicity, and origin ACS 2023
- Neighborhood character
- Predominantly White (67%)
- Race & ethnicity
- White 67% Hispanic / Latino 28% Two or more races 11% Black 2%
- Hispanic origin (detail)
- Mexican 26%
- Common ancestry
- Italian 2% Slovak 2% Portuguese 1%
- Foreign-born
- 7% · Canada
- Languages at home
- 80% English-only · Spanish 18% German/W. Germanic 1%
Political lean MEDSL · Johnson
- 2024 margin
- Solid R (+51.4) · D 23.9% · R 75.3%
- 2008→2024 swing
- -3.9pp toward R · 2008: -47.5pp · 2024: -51.4pp
- All cycles
- 2024: R+51.4 2020: R+53.0 2016: R+58.3 2012: R+55.6 2008: R+47.5
Not yet ingested
- Civics
- —
Market trends
- HPI YoY
- ▼ -86.22%
- Current HPI
- 265.6513
- Rent YoY
- —
- Metro
- —
- State GDP YoY
- ▲ 3.95%
- F500 in state
- 110
Industry mix (Fortune 500 HQ in TX)
| Industry | F500 HQs | Revenue |
|---|---|---|
| Energy | 16 | $1,198B |
|
||
| Technology | 5 | $198B |
|
||
| Engineering / Construction | 4 | $72B |
|
||
| Energy Services | 3 | $60B |
|
||
| Utilities | 3 | $41B |
|
||
| Healthcare | 2 | $330B |
|
||
Price history
-8.0% since first listed3 events — show timeline
- 2026-02-28 Pending — NTREIS
- 2026-02-25 Price Changed $228,999 NTREIS
- 2026-02-21 Listed $248,999 NTREIS
Cash-flow waterfall
monthlySold comps — $/sqft
last 12 mo · ≤1 miLoading sold comps…