 🏷️ Likely Rental
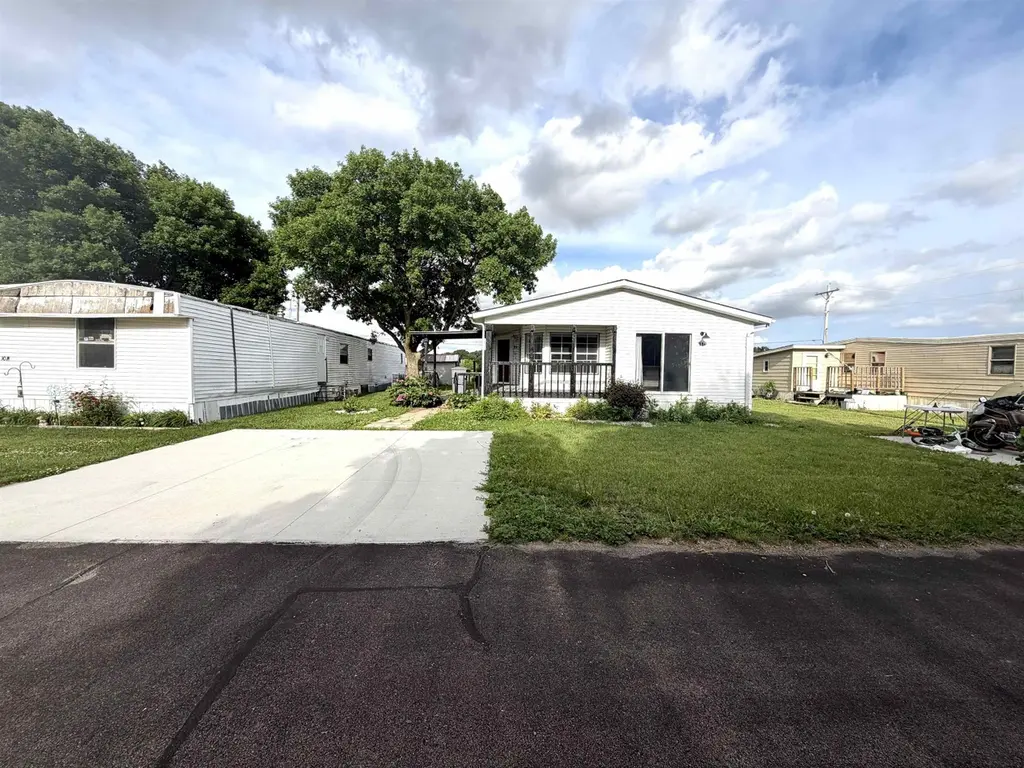
2304 Eastwood A11 St · Woodland Park, NE
Flood risk No data
- FEMA flood zone
- —
- Chance of flooding over 30 yrs
- —
- Est. flood insurance / yr
- —
Fire risk No data
- Est. fire insurance / yr
- —
Heat risk 2/10 · Minimal
- Hot days now (above threshold)
- 7 days/yr
- Hot days in 30 yrs
- 14 days/yr
Wind risk No data
- Chance of severe wind over 30 yrs
- —
Air-quality risk 2/10 · Minimal
- Unhealthy air days now
- 1 days/yr
- Unhealthy air days in 30 yrs
- 1 days/yr
Risk factors via First Street. Map © Google.
Why this score? — see what drove the B- grade
The composite is a weighted blend of 9 inputs, each scored 0–100. Each bar is that input's sub-score; the figure is the points it added to the 100-point composite (weight × sub-score).
- Cash flow +30.0/30.0
- 1% rule +10.0/10.0
- DSCR +10.0/10.0
- ARV discount +7.5/15.0
- Schools +3.8/10.0
- Livability +3.4/5.0
- Rent growth +3.3/5.0
- Condition / age +1.0/5.0
- Appreciation +0.0/10.0
$79,000
🖨 Deal sheet 📄 Offer letter ✓ Due diligence
Listing remarks MLS
Pride of ownership shows! Newer All electric spacious 3 bed, 2 bath with insulated attached 2 car garage. Large kitchen to enjoy with island and woodburning fireplace to help with utilities. Formal dining area, main floor laundry off of kitchen. Also enjoy summer nights on the covered deck! It's Cheaper then rent! Prefer 24 hour notice. Lot rent is $255 per month. Plus water/sewer. See turkey and deer wildlife behind garage. Buyer needs to be court owner approved.
Key facts
- Large windows
- Open floor plan
- Tall ceilings
Tags
Property features AI
Exterior
- Parking: Attached 2-car garage with garage door opener
- Utilities: Public water; Natural gas available
- Home design: Mobile home (residential)
- Construction: Vinyl siding; Asphalt roof
- Exterior features: Deck; Shed(s)
Interior
- Kitchen: Dishwasher; Electric range; Microwave; Refrigerator; Garbage disposal
- Bedrooms: 3 main level bedrooms
- Bathrooms: 2 main level bathrooms
- Heating & cooling: Forced air heating; Central air conditioning
- Interior features: Living room fireplace; Deck
- Laundry & utility: Electric water heater
Neighborhood map
What this means for you Summary
Snapshot
- This is a 3-bed/2.0-bath manufactured listed at $79k. Condition is rated poor.
Deal economics
- At list price, monthly cash flow is $689 ($8k/yr) — positive.
- The deal already cash-flows at list — no discount required.
- Meets the 1% rule at list price ($2k rent vs $79k).
Location & tenants
- Location reads 67/100 on livability (#293 in NE) — a middle-class / working-renter tenant base. Strengths: crime A+, cost of living A+, housing A+; Watch: employment D, health & safety D, schools D-.
- Norfolk Public Schools (town): math 44% / reading 46% proficiency, ranked #84 of 111 in NE (top 76%) — families likely to look elsewhere, expect single-tenant / working-renter base with shorter leases.
- Market conditions: Rents rising (+3.3%/yr); 230 active listings in the ZIP; 8 units permitted in Stanton County in 2024 (0 in 5+ unit buildings).
Forward outlook
- Local home prices are declining (-3.0%/yr); year-one equity from $546 of loan paydown is wiped out by about $2k of value loss. Plan a longer hold.
- Stanton County population projected at -29% by 2050 — secular population decline; favor cash flow + early exit over multi-decade hold.
- At projected returns (-3.0% appreciation + 3.3% rent growth), your $22k cash investment doubles in ~4 years — after that, you're playing with house money.
Negotiation context
- Only 14 days on market — expect competitive offers; lowballing is unlikely to land.
- 3 sale attempts since 8y ago with the ask held roughly flat each time — persistent listings suggest the price (not the market) is what's stuck; bring a comps-based counter.
- Current owner paid $57k; 39% above their basis — modest negotiation headroom, anchor on the comps not their cost.
Questions for the listing agent
- Have any recent inspections been done? Can we get a copy of the seller's disclosures and any deferred-maintenance estimates?
- Is there a deadline driving the sale (1031 exchange, divorce, estate, relocation)? That informs how much negotiation room exists.
- Schools are D-rated, which usually means shorter tenancies and higher turnover. Who's the typical renter profile here, and what's been the actual vacancy rate?
- What's the average days-on-market for RENTAL listings here right now (not sales)? A rising rental-DOM trend means longer vacancies and softer asking-rent achievability than the comps imply.
- What's the recent tenant-quality profile in this submarket — average credit score on applications, eviction rate, late-payment / NSF rate, and stable-employment percentage? A property-management company in the area should have these aggregated.
- How much new for-sale + rental construction is in the pipeline within 1–3 miles? Heavy new supply typically softens prices + rents 12–24 months out; constrained supply supports both.
Investment metrics
- 1% rule
- 1.98% ✓
- Cap rate
- 16.76%
- Cash-on-cash
- 37.37%
- DSCR
- 2.66
- GRM
- 4.2
CMA / ARV
- ARV (on-the-fly)
- $200,200
- Comps found
- 1
Show comp detail 1 sale within ~0.75 mi
| Address | Dist | Beds/Ba | Sqft | Sold | Price | $/sf | Match |
|---|---|---|---|---|---|---|---|
| 312 Forest Dr | 0.38mi | 3/2.0 | 1,568 (-14%) | 22mo | $172,000 | $110 | 41 |
Match score weights: distance 35% · size 25% · config 20% · recency 20%. Top-matched comps best support the ARV.
Projected returns pro-forma
-3.0% appreciation · 3.31% rent growth · sell at horizon
- IRR
- 33.7%
- Equity multiple
- 2.43×
- Total profit
- $31,587
- Equity at exit
- $11,779
- IRR
- 40.8%
- Equity multiple
- 4.89×
- Total profit
- $86,119
- Equity at exit
- $6,830
Cash invested: $22,120 (down + closing). Projections, not guarantees.
Landlord ↔ Tenant lean methodology
- Overall (STATE)
- 83 Strongly Landlord-Friendly
- State Nebraska
- 83 Strongly Landlord-Friendly · R+13
- County
- — inherits STATE
- City
- — inherits STATE
ZIP-level market 68701
- Rents YoY
- 3.3%
- Active inventory
- 230
- Price-to-rent
- 4.2×
Monthly cashflow live
- Estimated rent
- $1,563 medium interval (Pro) →
- Mortgage (P&I)
- −$414
- Tax est. 1.5%
- −$99 /mo · $1,185/yr
- Insurance
- −$33
- HOA
- −$0
- Vacancy / Maint / Mgmt
- −$328
- Net cashflow
- $689
Break-even live
UW: 25.0% down · 7.5% · 30yr · 1.5% tax · 5.0% vac · 8.0% maint · 8.0% mgmt
Financing live
Cash to close
- Down payment
- $19,750
- Closing costs
- $2,370
- Reserves months
- —
- Total cash needed
- —
Loan-product check · same deal, 3 products live
Conventional
25% down · 7.5% · 30yr
- Down + closing
- —
- Monthly P&I
- —
- Monthly cashflow
- —
- DSCR
- —
- Eligible?
- —
Personal DTI + credit; lowest rate.
DSCR
20% down · 8.5% · 30yr
- Down + closing
- —
- Monthly P&I
- —
- Monthly cashflow
- —
- DSCR
- —
- Eligible?
- —
No personal income docs; deal must DSCR.
Hard money
10% down · 12.0% · 12mo
- Down + closing
- —
- Monthly P&I
- —
- Monthly cashflow
- —
- DSCR
- —
- Eligible?
- —
Short-term bridge; refi at stabilization.
Listing history 11 events
-
2026-06-19days on market $79,000 Active 14 DOM
-
2026-06-18days on market $79,000 Active 13 DOM
-
2026-06-17days on market $79,000 Active 12 DOM
-
2026-06-16days on market $79,000 Active 11 DOM
-
2026-06-15days on market $79,000 Active 10 DOM
-
2026-06-14days on market $79,000 Active 8 DOM
-
2026-06-12days on market $79,000 Active 7 DOM
-
2026-06-09days on market $79,000 Active 4 DOM
-
2026-06-08days on market $79,000 Active 3 DOM
-
2026-06-07remarks 699-char remark
-
2026-06-07$79,000 Active 2 DOM
ⓘ Source: listings_history table (triggers on properties + properties_extension) + one-shot
backfill from property_details.listing_events for pre-trigger history.
Climate risk First Street
- Heat 2/10 Low
- Air quality 2/10 Low 1 unhealthy d/yr today · 1 by 30 yrs out
Nearby sold comps map
Loading sold comps map…
Walkable amenities ~0.75 mi
Loading nearby amenities…
Taxation est. · year 1
- Rental income
- $18,757
- − Mortgage interest
- −$4,425
- − Property taxes
- −$1,185
- − Insurance
- −$395
- − Repairs & maintenance
- −$1,501
- − Management
- −$1,501
- − Depreciation
- −$2,298
- Taxable income
- $7,453
- Est. tax owed @ 24.0%
- −$1,789
- After-tax cash flow
- $6,478/yr
For passive investors: Depreciation is non-cash, so a rental often shows a tax loss while cash-flowing — sheltering income. Rental losses are passive: they offset passive income freely, and up to $25,000/yr can offset ordinary (W-2) income if you actively participate and your MAGI is under $100k (phasing out to $0 by $150k); unused losses carry forward. On sale, claimed depreciation is recaptured at up to 25%, and gains may owe capital-gains tax (a 1031 exchange can defer both). Figures are a year-1 estimate at your 24.0% rate — not tax advice; consult a CPA.
Condition & rehab AI · 1 photo
This manufactured home requires extensive repairs and updates to improve its condition and value. Significant investment is needed to bring it up to a livable standard.
Repairs flagged
- Major Appliances — Old and worn
- Major Bathtubs and sinks — Signs of wear
- Major Vinyl siding — Faded and worn
- Major Vinyl plank flooring — Old and worn
- Major Paint — Chipped and faded
- Major Windows — Signs of wear
Value-add opportunities
- Resale New appliances — Modern appliances improve appeal
- Resale Bathtub and sink replacement — New fixtures enhance functionality
- Resale Vinyl siding and flooring replacement — Fresh exterior and interior improve curb appeal
- Resale Paint job — Fresh paint enhances appearance
- Resale Window replacement — New windows improve energy efficiency and appearance
- Both HVAC system upgrade — Modern HVAC improves comfort and energy efficiency
Renovation cost estimate screening
| Repair item | Severity | Est. cost |
|---|---|---|
| Appliances · Old and worn | Major | $15,000–50,000 |
| Bathtubs and sinks · Signs of wear | Major | $15,000–50,000 |
| Vinyl siding · Faded and worn | Major | $15,000–50,000 |
| Vinyl plank flooring · Old and worn | Major | $15,000–50,000 |
| Paint · Chipped and faded | Major | $15,000–50,000 |
| Windows · Signs of wear | Major | $15,000–50,000 |
| Total estimated repair cost · 6 items | $90,000–300,000 |
Value-add ROI direction
- Resale New appliances — Modern appliances improve appeal ↑
- Resale Bathtub and sink replacement — New fixtures enhance functionality ↑
- Resale Vinyl siding and flooring replacement — Fresh exterior and interior improve curb appeal ↑
- Resale Paint job — Fresh paint enhances appearance ↑
- Resale Window replacement — New windows improve energy efficiency and appearance ↑
- Both HVAC system upgrade — Modern HVAC improves comfort and energy efficiency ↑
ⓘ Cost ranges are severity-bucket heuristics (US national rule-of-thumb). Get contractor quotes + a written scope before underwriting a rehab budget.
Schools (NCES district)
- District
- Norfolk Public Schools
- NCES district ID
- 3174430
- Math proficiency
- 44% ▼ -7.00%
- Reading proficiency
- 46% ▼ -7.00%
- Median HH income
- $46,579
- Composite
- 38.31/100
- National rank
- #4227
- State rank
- #84 of 111 in NE
Livability — Woodland Park
- Score
- 67/100
- State rank
- #293
- US rank
- #10967
Category grades
Schools grade is shown separately in the Schools card above.
Census & demographics
- Census place
- Woodland Park, NE
- County
- Madison County · 31,417 people
- Metro
- Norfolk, NE
- Population (ZIP)
- 31,417
- Household income
- $62,633
- Rent vs Own
- Severe rent burden
- 861.0
Population outlook (Stanton County) Hauer SSP2
- Today (2025)
- 5,408 people
- By 2030
- 5,121 · -5.3%
- By 2040
- 4,491 · -17.0%
- By 2050
- 3,855 · -28.7%
- By 2075
- 2,552 · -52.8%
- By 2100
- 1,412 · -73.9%
Race, ethnicity, and origin ACS 2023
- Neighborhood character
- Predominantly White (80%)
- Race & ethnicity
- White 80% Hispanic / Latino 14% Two or more races 9% Native American 1% Black 1%
- Hispanic origin (detail)
- Mexican 11% Cuban 1%
- Common ancestry
- Portuguese 2% Romanian 1% Lithuanian 1%
- Foreign-born
- 6% · Canada
- Languages at home
- 90% English-only · Spanish 9%
Political lean MEDSL · Stanton
- 2024 margin
- Solid R (+66.7) · D 16.1% · R 82.8% · Other 1.2%
- 2008→2024 swing
- -21.9pp toward R · 2008: -44.8pp · 2024: -66.7pp
- All cycles
- 2024: R+66.7 2020: R+64.1 2016: R+63.9 2012: R+51.0 2008: R+44.8
Not yet ingested
- Civics
- —
Market trends
- HPI YoY
- ▼ -172.61%
- Current HPI
- 260.5574
- Rent YoY
- ▲ 3.31%
- Metro
- Norfolk, NE
- State GDP YoY
- ▲ 0.68%
- F500 in state
- 2
Industry mix (Fortune 500 HQ in NE)
| Industry | F500 HQs | Revenue |
|---|---|---|
| Conglomerate | 1 | $371B |
|
||
Price history
+38.6% since first listed5 events — show timeline
- 2026-06-05 Listed $79,000 NNEMLS
- 2025-01-19 Rental Removed $1,000 SHOWMOJO
- 2025-01-17 Listed for Rent $1,000 SHOWMOJO
- 2018-11-30 Sold (MLS) $57,000 NNEMLS
- 2018-06-05 Listed $57,000 NNEMLS
Cash-flow waterfall
monthlySold comps — $/sqft
last 12 mo · ≤1 miLoading sold comps…