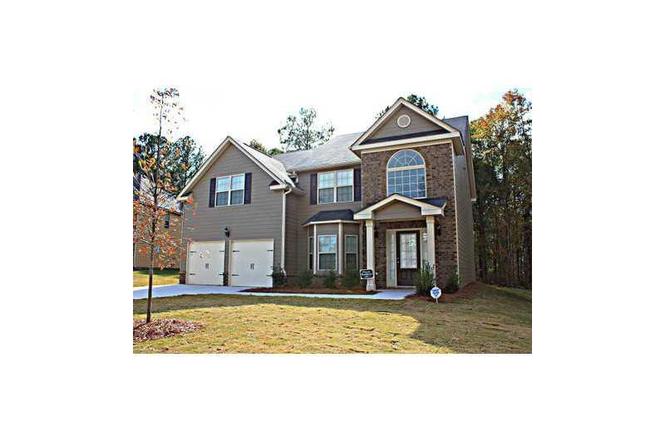
4209 Caveat Ct · South Fulton, GA
Flood risk 1/10 · Minimal
- FEMA flood zone
- X (unshaded)
- Chance of flooding over 30 yrs
- 0.0%
- Est. flood insurance / yr
- $507 – $1,088
Fire risk 3/10 · Minor
- Est. fire insurance / yr
- $963 – $1,789
Heat risk 6/10 · Moderate
- Hot days now (above 104°F)
- 8 days/yr
- Hot days in 30 yrs
- 21 days/yr
Wind risk 6/10 · Moderate
- Chance of severe wind over 30 yrs
- 27.0%
Air-quality risk 3/10 · Minor
- Unhealthy air days now
- 3 days/yr
- Unhealthy air days in 30 yrs
- 4 days/yr
Risk factors via First Street. Map © Google.
Why this score? — see what drove the C grade
The composite is a weighted blend of 9 inputs, each scored 0–100. Each bar is that input's sub-score; the figure is the points it added to the 100-point composite (weight × sub-score).
- Cash flow +19.8/30.0
- ARV discount +15.0/15.0
- DSCR +6.3/10.0
- 1% rule +4.9/10.0
- Schools +4.5/10.0
- Rent growth +3.1/5.0
- Livability +2.5/5.0
- Condition / age +2.5/5.0
- Appreciation +0.0/10.0
$299,000
🖨 Deal sheet 📄 Offer letter ✓ Due diligence
Listing remarks MLS
Spacious 5-bedroom, 3 bath home with endless potential on a corner lot! Located on a desirable corner lot, this home features a bedroom and full bath conveniently located on the main level, perfect for guests, multi-generational living, or a home office. The generous floor plan offers ample living space and great natural light throughout. Outside, enjoy a fenced-in-backyard. THIS PROPERTY NEEDS TLC, making it an excellent opportunity. With the right updates, this home has the potential to shine!
Key facts
- Main level
- Natural light
- Generous floor plan
Tags
Neighborhood map
What this means for you Summary
Snapshot
- This is a 4-bed/3.0-bath single-family listed at $299k.
Deal economics
- At list price, monthly cash flow is $356 ($4k/yr) — positive.
- The deal already cash-flows at list — no discount required.
- To meet the 1% rule (rent ≥ 1% of price), the offer needs to be $295k (1.5% below list).
- Recommended offer: $263k (12.0% below list) — sets the bar for market timing.
- Cap rate 7.7% vs local median 4.6% in South Fulton — top-decile yield for the area; either an underpriced asset or a hidden risk that comps aren't pricing in. Stress-test before assuming the spread holds.
Location & tenants
- Location reads: area grade C — affects rentability + tenant quality, not the cash-flow math above.
- Fulton County (suburban): math 49% / reading 53% proficiency, ranked #12 of 174 in GA (top 7%) — acceptable for families but not a draw, mixed tenant base, ~2y average lease.
- Zoned schools: Cliftondale Elementary School (math 27% / reading 37%, grade F, #582 of 1,228 statewide, top 50%, 667 students, 62% FRL); Renaissance Middle School (math 22% / reading 27%, grade F, #301 of 470 statewide, top 66%, 1,166 students, 71% FRL); Langston Hughes High School (math 8% / reading 17%, grade F, #336 of 424 statewide, top 80%, 1,964 students, 65% FRL) — zoned schools average 66% FRL vs 41% district-wide (25 pts higher); higher-poverty schools than district average — tighter screening recommended.
- Zoned-school proficiency averages 23% at this address vs 51% district-wide (-28 pts) — the specific schools serving this property underperform the Fulton County average; the district grade overstates school quality for this exact location.
- Market conditions: Rents rising (+2.5%/yr); 531 active listings in the ZIP; 11 comparable units currently listed for rent nearby; rentals at typical pace (median 25d on market — plan ~3-4 weeks tenant-placement turnaround); 45% of comp listings sitting > 30 days — soft ceiling on asking rent; solid renter incomes; 11,565 units permitted in Fulton County in 2024 (8,159 in 5+ unit buildings).
- This rent runs 38% of the median local income ($94k/yr) — at the standard rent-burdened threshold; future hikes will face affordability resistance.
Forward outlook
- Local home prices are declining (-3.0%/yr); year-one equity from $2k of loan paydown is wiped out by about $9k of value loss. Plan a longer hold.
- Fulton County population projected at +38% by 2050 — long-run rental-demand tailwind backs the buy-and-hold thesis.
Negotiation context
- It's been on market 133 days — a 12% lower offer ($263k) is reasonable based on typical stale-listing flexibility.
- 4 sale attempts since 12y ago with the ask held roughly flat each time — persistent listings suggest the price (not the market) is what's stuck; bring a comps-based counter.
- Current owner paid $202k; 48% above their basis — modest negotiation headroom, anchor on the comps not their cost.
Risks & watch-outs
- Climate carrying-cost: major wind risk, 27% chance of damaging wind over 30y; extreme-heat days projected 8→21/yr by 2055 (HVAC capex compounding) — expect insurance premiums to compound above CPI over the hold.
Questions for the listing agent
- It's been on market 133 days. Have you received any prior offers? Is the seller open to a 12% concession, seller financing, or rate buy-down credit?
- What does the HOA fee cover, when was the last increase, and are there any pending special assessments or reserve-fund shortfalls?
- Why hasn't it sold? Are there any deal-killer items the seller is aware of (foundation, flood, title, zoning, code violations)?
- Is there a deadline driving the sale (1031 exchange, divorce, estate, relocation)? That informs how much negotiation room exists.
- What's the average days-on-market for RENTAL listings here right now (not sales)? A rising rental-DOM trend means longer vacancies and softer asking-rent achievability than the comps imply.
- What's the recent tenant-quality profile in this submarket — average credit score on applications, eviction rate, late-payment / NSF rate, and stable-employment percentage? A property-management company in the area should have these aggregated.
- How much new for-sale + rental construction is in the pipeline within 1–3 miles? Heavy new supply typically softens prices + rents 12–24 months out; constrained supply supports both.
Investment metrics
- 1% rule
- 0.99% ✗
- Cap rate
- 7.72%
- Cash-on-cash
- 5.11%
- DSCR
- 1.23
- GRM
- 8.5
CMA / ARV
- ARV (on-the-fly)
- $393,984
- Comps found
- 9
Show comp detail 9 sales within ~0.75 mi
| Address | Dist | Beds/Ba | Sqft | Sold | Price | $/sf | Match |
|---|---|---|---|---|---|---|---|
| 7530 Springbox Dr | 0.12mi | 4/2.5 | 2,932 (+7%) | 10mo | $398,095 | $136 | 72 |
| 4234 Sir Dixon Dr | 0.09mi | 5/3.0 (+1) | 2,900 (+6%) | 20mo | $385,000 | $133 | 64 |
| 4409 Challedon Dr | 0.36mi | 4/2.5 | 2,772 (+1%) | 19mo | $400,000 | $144 | 63 |
| 415 Damascus Ct | 0.50mi | 4/2.5 | 2,800 (+2%) | 13mo | $379,000 | $135 | 60 |
| 4249 Caveat Ct | 0.16mi | 5/3.0 (+1) | 3,109 (+14%) | 11mo | $480,000 | $154 | 56 |
| 4307 Alysheba Dr | 0.23mi | 4/3.5 | 3,064 (+12%) | 22mo | $399,500 | $130 | 49 |
| 1020 Athena Bnd | 0.67mi | 4/2.5 | 2,804 (+2%) | 22mo | $409,990 | $146 | 44 |
| 7625 Demeter Dr | 0.75mi | 5/3.5 (+1) | 2,711 (-1%) | 21mo | $411,490 | $152 | 39 |
| 1050 Athena Bnd | 0.63mi | 4/2.5 | 2,340 (-14%) | 21mo | $421,990 | $180 | 27 |
Match score weights: distance 35% · size 25% · config 20% · recency 20%. Top-matched comps best support the ARV.
Projected returns pro-forma
-3.0% appreciation · 2.53% rent growth · sell at horizon
- IRR
- -8.9%
- Equity multiple
- 0.68×
- Total profit
- $-27,148
- Equity at exit
- $44,582
- IRR
- -0.0%
- Equity multiple
- 1.00×
- Total profit
- $-100
- Equity at exit
- $25,852
Cash invested: $83,720 (down + closing). Projections, not guarantees.
Landlord ↔ Tenant lean methodology
- Overall (STATE)
- 90 Strongly Landlord-Friendly
- State Georgia
- 90 Strongly Landlord-Friendly · R+3
- County
- — inherits STATE
- City
- — inherits STATE
ZIP-level market 30213
- Home prices YoY
- -17.7%
- Rents YoY
- 2.5%
- Active inventory
- 531
- Price-to-rent
- 8.5×
Monthly cashflow live
- Estimated rent
- $2,946 high interval (Pro) →
- Mortgage (P&I)
- −$1,568
- Tax from tax record
- −$225 /mo · $2,696/yr
- Insurance
- −$125
- HOA
- −$54
- Vacancy / Maint / Mgmt
- −$619
- Net cashflow
- $356
Break-even live
UW: 25.0% down · 7.5% · 30yr · 1.5% tax · 5.0% vac · 8.0% maint · 8.0% mgmt
Financing live
Cash to close
- Down payment
- $74,750
- Closing costs
- $8,970
- Reserves months
- —
- Total cash needed
- —
Loan-product check · same deal, 3 products live
Conventional
25% down · 7.5% · 30yr
- Down + closing
- —
- Monthly P&I
- —
- Monthly cashflow
- —
- DSCR
- —
- Eligible?
- —
Personal DTI + credit; lowest rate.
DSCR
20% down · 8.5% · 30yr
- Down + closing
- —
- Monthly P&I
- —
- Monthly cashflow
- —
- DSCR
- —
- Eligible?
- —
No personal income docs; deal must DSCR.
Hard money
10% down · 12.0% · 12mo
- Down + closing
- —
- Monthly P&I
- —
- Monthly cashflow
- —
- DSCR
- —
- Eligible?
- —
Short-term bridge; refi at stabilization.
Rent comps 11 comps
| Address | Beds | Baths | Sqft | Rent | $/sqft | DOM | Units | Dist |
|---|---|---|---|---|---|---|---|---|
| 4274 Sir Dixon Dr Fairburn, GA | 4.0 | 2.5 | 2860 | $2,855 | $1.00 | 43d | 1 | 0.03mi |
| 300 Pennant Ln Fairburn, GA | 4.0 | 3.5 | 2948 | $2,900 | $0.98 | 43d | 1 | 0.45mi |
| 7436 Petal Pl Fairburn, GA | 5.0 | 3.0 | 2872 | $2,859 | $1.00 | 5d | 1 | 0.65mi |
| 7571 Deerridge Way Fairburn, GA | 5.0 | 4.0 | 3136 | $3,049 | $0.97 | 43d | 1 | 0.68mi |
| 965 Athena Bnd Fairburn, GA | 4.0 | 2.5 | 3104 | $3,100 | $1.00 | 17d | 1 | 0.81mi |
| 4377 Montberry Ln Fairburn, GA | 5.0 | 3.5 | 2896 | $3,200 | $1.10 | 24d | 1 | 0.94mi |
| 1087 Sly Fox Run Fairburn, GA | 4.0 | 2.5 | 3736 | $2,841 | $0.76 | 24d | 1 | 1.02mi |
| 1124 Sly Fox Run Fairburn, GA | 5.0 | 4.0 | 3064 | $3,750 | $1.22 | 43d | 1 | 1.06mi |
| 6876 Foxfire Pl Atlanta, GA | 5.0 | 3.0 | 2990 | $2,700 | $0.90 | 43d | 1 | 1.24mi |
| 6802 Fireside Ln Atlanta, GA | 4.0 | 2.0 | 2664 | $2,525 | $0.95 | 24d | 1 | 1.38mi |
| 420 Tarpan Ct Fairburn, GA | 5.0 | 3.0 | 2776 | $2,760 | $0.99 | 5d | 1 | 1.43mi |
HOA detail
- Monthly dues
- $54 · $648/yr
Listing history 12 events
-
2026-02-11status Pending
-
2026-02-10status Under Contract 500-char remark
Show marketing remark (500 chars)
Spacious 5-bedroom, 3 bath home with endless potential on a corner lot! Located on a desirable corner lot, this home features a bedroom and full bath conveniently located on the main level, perfect for guests, multi-generational living, or a home office. The generous floor plan offers ample living space and great natural light throughout. Outside, enjoy a fenced-in-backyard. THIS PROPERTY NEEDS TLC, making it an excellent opportunity. With the right updates, this home has the potential to shine!
-
2025-09-30$299,000 Active
Show marketing remark (500 chars)
Spacious 5-bedroom, 3 bath home with endless potential on a corner lot! Located on a desirable corner lot, this home features a bedroom and full bath conveniently located on the main level, perfect for guests, multi-generational living, or a home office. The generous floor plan offers ample living space and great natural light throughout. Outside, enjoy a fenced-in-backyard. THIS PROPERTY NEEDS TLC, making it an excellent opportunity. With the right updates, this home has the potential to shine!
-
2025-09-30$299,000 New 500-char remark
Show marketing remark (500 chars)
Spacious 5-bedroom, 3 bath home with endless potential on a corner lot! Located on a desirable corner lot, this home features a bedroom and full bath conveniently located on the main level, perfect for guests, multi-generational living, or a home office. The generous floor plan offers ample living space and great natural light throughout. Outside, enjoy a fenced-in-backyard. THIS PROPERTY NEEDS TLC, making it an excellent opportunity. With the right updates, this home has the potential to shine!
-
2018-06-06historical
-
2018-04-05$190,000 New
-
2014-08-12price $201,893
-
2014-07-14historical
-
2014-07-11price $204,489
-
2014-07-11soldstatus $201,893 Sold
-
2014-06-20status Pending
-
2014-06-06$204,489 Active
ⓘ Source: listings_history table (triggers on properties + properties_extension) + one-shot
backfill from property_details.listing_events for pre-trigger history.
Tax reassessment forecast GA · Resets to sale price
- Current annual tax
- $2,696 · $225/mo
- Projected year-2 tax
- $2,751 · $229/mo
- Expected delta
- +$54/yr (+$5/mo · 2.0%)
ⓘ Screening estimate from a state-policy table — verify with the county assessor before closing.
Climate risk First Street
- Flood 1/10 Low FEMA zone X (unshaded) · 0% chance over 30 yrs
- Wildfire 3/10 Moderate
- Heat 6/10 Major 8 d/yr ≥104°F today · 21 d/yr by 30 yrs out
- Wind 6/10 Major 27% chance of damaging wind over 30 yrs
- Air quality 3/10 Moderate 3 unhealthy d/yr today · 4 by 30 yrs out
Nearby sold comps map
Loading sold comps map…
Walkable amenities ~0.75 mi
Loading nearby amenities…
Taxation est. · year 1
- Rental income
- $35,358
- − Mortgage interest
- −$16,749
- − Property taxes
- −$2,696
- − Insurance
- −$1,495
- − Repairs & maintenance
- −$2,829
- − Management
- −$2,829
- − HOA
- −$648
- − Depreciation
- −$8,698
- Taxable loss
- −$585
- Est. tax savings @ 24.0%
- +$141
- After-tax cash flow
- $4,418/yr
For passive investors: Depreciation is non-cash, so a rental often shows a tax loss while cash-flowing — sheltering income. Rental losses are passive: they offset passive income freely, and up to $25,000/yr can offset ordinary (W-2) income if you actively participate and your MAGI is under $100k (phasing out to $0 by $150k); unused losses carry forward. On sale, claimed depreciation is recaptured at up to 25%, and gains may owe capital-gains tax (a 1031 exchange can defer both). Figures are a year-1 estimate at your 24.0% rate — not tax advice; consult a CPA.
Schools (NCES district)
- District
- Fulton County
- NCES district ID
- 1302280
- Math proficiency
- 49% ▼ -2.00%
- Reading proficiency
- 53% ▬ 0.00%
- Median HH income
- $68,035
- Composite
- 45.33/100
- National rank
- #2640
- State rank
- #12 of 174 in GA
Livability — South Fulton
No livability data for this city. (Only ~50 U.S. cities are tracked.)
Census & demographics
- Census place
- South Fulton, GA
- County
- Fulton County · 1,094,430 people
- City population
- 127,674
- Metro
- Atlanta-Sandy Springs-Alpharetta, GA
- Population (ZIP)
- 50,621
- Household income
- $94,125
- Rent vs Own
- Severe rent burden
- 1025.0
Population outlook (Fulton County) Hauer SSP2
- Today (2025)
- 1,203,707 people
- By 2030
- 1,299,706 · +8.0%
- By 2040
- 1,488,256 · +23.6%
- By 2050
- 1,664,580 · +38.3%
- By 2075
- 2,036,072 · +69.2%
- By 2100
- 2,222,402 · +84.6%
Race, ethnicity, and origin ACS 2023
- Neighborhood character
- Predominantly Black (86%)
- Race & ethnicity
- Black 86% White 8% Hispanic / Latino 4% Two or more races 3%
- Common ancestry
- Hispanic 1% Arab 1% Lithuanian 0%
- Foreign-born
- 7% · Canada
- Languages at home
- 91% English-only · Spanish 4% French/Haitian/Cajun 2% Arabic 1%
Political lean MEDSL · Fulton
- 2024 margin
- Solid D (+44.9) · D 71.9% · R 27.0% · Other 1.1%
- 2008→2024 swing
- +9.8pp toward D · 2008: 35.0pp · 2024: 44.9pp
- All cycles
- 2024: D+44.9 2020: D+46.4 2016: D+42.1 2012: D+29.6 2008: D+35.0
Not yet ingested
- Civics
- —
Market trends
- HPI YoY
- ▼ -50.66%
- Current HPI
- 235.9372
- Rent YoY
- ▲ 2.53%
- Metro
- Atlanta-Sandy Springs-Alpharetta, GA
- State GDP YoY
- ▲ 2.66%
- F500 in state
- 28
Industry mix (Fortune 500 HQ in GA)
| Industry | F500 HQs | Revenue |
|---|---|---|
| Paper / Packaging | 2 | $29B |
|
||
| Retail | 1 | $160B |
|
||
| Transportation / Logistics | 1 | $91B |
|
||
| Airlines | 1 | $62B |
|
||
| Consumer Goods | 1 | $47B |
|
||
| Utilities | 1 | $25B |
|
||
Price history
+46.2% since first listed12 events — show timeline
- 2026-02-11 Pending — FMLS
- 2026-02-10 Pending — GAMLS
- 2025-09-30 Listed $299,000 GAMLS
- 2025-09-30 Listed $299,000 FMLS
- 2018-06-06 Listing Removed — GAMLS
- 2018-04-05 Listed $190,000 GAMLS
- 2014-08-12 Price Changed $201,893 FMLS
- 2014-07-14 Listing Removed — FMLS
- 2014-07-11 Sold (MLS) $201,893 FMLS
- 2014-07-11 Price Changed $204,489 FMLS
- 2014-06-20 Pending — FMLS
- 2014-06-06 Listed $204,489 FMLS
Property tax history
+10.3%/yrLatest (2025): $2,696 · +3.6% YoY. Source: county tax records.
Cash-flow waterfall
monthlySold comps — $/sqft
last 12 mo · ≤1 miLoading sold comps…