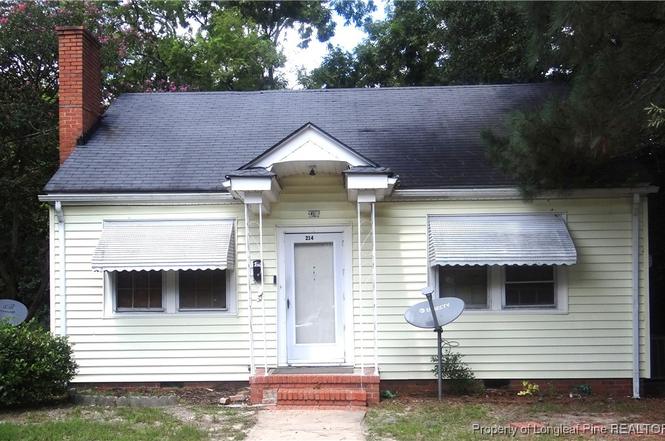
214 S Windsor Dr · Fayetteville, NC
Flood risk 1/10 · Minimal
- FEMA flood zone
- X (unshaded)
- Chance of flooding over 30 yrs
- 0.0%
- Est. flood insurance / yr
- $507 – $1,088
Fire risk 3/10 · Minor
- Est. fire insurance / yr
- $906 – $1,684
Heat risk 7/10 · Major
- Hot days now (above 106°F)
- 7 days/yr
- Hot days in 30 yrs
- 16 days/yr
Wind risk 6/10 · Moderate
- Chance of severe wind over 30 yrs
- 76.0%
Air-quality risk 2/10 · Minimal
- Unhealthy air days now
- 0 days/yr
- Unhealthy air days in 30 yrs
- 1 days/yr
Risk factors via First Street. Map © Google.
Why this score? — see what drove the B- grade
The composite is a weighted blend of 9 inputs, each scored 0–100. Each bar is that input's sub-score; the figure is the points it added to the 100-point composite (weight × sub-score).
- Cash flow +25.5/30.0
- ARV discount +15.0/15.0
- DSCR +8.4/10.0
- 1% rule +7.0/10.0
- Livability +3.8/5.0
- Rent growth +3.4/5.0
- Schools +3.1/10.0
- Condition / age +2.5/5.0
- Appreciation +0.0/10.0
$110,000
🖨 Deal sheet 📄 Offer letter ✓ Due diligence
Listing remarks
Windsor Terrace. Investment in the heart of the city. Perfect rental potential for any family. Needs lots of TLC and bonus room is not included in heated square footage. Large wrap around deck, covered porch, nice backyard, concrete driveway and vinyl siding exterior to be power washed.
Key facts
- Covered porch
- Wrap around deck
- Nice backyard
Tags
Property features AI
Exterior
- Parking: No garage
- Security: Security system
- Utilities: Public water; Public sewer
- Home design: Single-family residence; Residential property
- Construction: Vinyl siding; Crawl space foundation
- Exterior features: Deck; Porch; Storm doors; Level lot; Curbs
Interior
- Flooring: Carpet; Hardwood; Vinyl
- Bathrooms: 2 full bathrooms
- Heating & cooling: Central air conditioning (electric); Natural gas forced-air heating
- Interior features: Eat-in kitchen; Masonry fireplace
- Laundry & utility: Washer hookup on the main level
Neighborhood map
What this means for you Summary
Snapshot
- This is a 3-bed/2.0-bath single-family listed at $110k.
Deal economics
- At list price, monthly cash flow is $256 ($3k/yr) — positive.
- The deal already cash-flows at list — no discount required.
- Meets the 1% rule at list price ($1k rent vs $110k).
- Recommended offer: $97k (12.0% below list) — sets the bar for market timing.
- Cap rate 9.1% vs local median 4.9% in Fayetteville — top-decile yield for the area; either an underpriced asset or a hidden risk that comps aren't pricing in. Stress-test before assuming the spread holds.
Location & tenants
- Location reads 75/100 on livability (#45 in NC, #4,031 nationally) — a middle-class / working-renter tenant base. Strengths: commute A+, cost of living A+, housing A+; Watch: crime F, employment D-.
- Cumberland County Schools (urban): math 32% / reading 41% proficiency, ranked #126 of 178 in NC (top 71%) — families likely to look elsewhere, expect single-tenant / working-renter base with shorter leases.
- Zoned schools: R Max Abbott Middle (math 31% / reading 45%, grade F, #251 of 475 statewide, top 54%, 759 students, 99% FRL); Terry Sanford High (math 49% / reading 52%, grade D+, #306 of 535 statewide, top 57%, 1,224 students, 59% FRL) — zoned schools average 79% FRL vs 55% district-wide (24 pts higher); higher-poverty schools than district average — tighter screening recommended.
- Market conditions: Rents rising (+3.5%/yr); 132 active listings in the ZIP; 28 comparable units currently listed for rent nearby; rentals at typical pace (median 24d on market — plan ~3-4 weeks tenant-placement turnaround); lower-income renter base — watch delinquency; 1,125 units permitted in Cumberland County in 2024 (104 in 5+ unit buildings).
- This rent runs 40% of the median local income ($39k/yr) — at the standard rent-burdened threshold; future hikes will face affordability resistance.
Forward outlook
- Local home prices are declining (-3.0%/yr); year-one equity from $761 of loan paydown is wiped out by about $3k of value loss. Plan a longer hold.
- At projected returns (-3.0% appreciation + 3.5% rent growth), your $31k cash investment doubles in ~10 years — after that, you're playing with house money.
Negotiation context
- It's been on market 297 days — a 12% lower offer ($97k) is reasonable based on typical stale-listing flexibility.
Risks & watch-outs
- Watch-outs: built in 1942 — expect roof / HVAC / electrical / plumbing capex.
- Climate carrying-cost: major wind risk, 76% chance of damaging wind over 30y; extreme-heat days projected 7→16/yr by 2055 (HVAC capex compounding) — expect insurance premiums to compound above CPI over the hold.
Questions for the listing agent
- It's been on market 297 days. Have you received any prior offers? Is the seller open to a 12% concession, seller financing, or rate buy-down credit?
- Built in 1942 — when were the roof, HVAC, electrical panel, plumbing, and water heater last replaced?
- Why hasn't it sold? Are there any deal-killer items the seller is aware of (foundation, flood, title, zoning, code violations)?
- Is there a deadline driving the sale (1031 exchange, divorce, estate, relocation)? That informs how much negotiation room exists.
- Crime grade is F in this area — have there been break-ins, vandalism, or insurance claims at this property in the last 3 years? What carrier currently insures it and at what premium?
- What's the average days-on-market for RENTAL listings here right now (not sales)? A rising rental-DOM trend means longer vacancies and softer asking-rent achievability than the comps imply.
- What's the recent tenant-quality profile in this submarket — average credit score on applications, eviction rate, late-payment / NSF rate, and stable-employment percentage? A property-management company in the area should have these aggregated.
- How much new for-sale + rental construction is in the pipeline within 1–3 miles? Heavy new supply typically softens prices + rents 12–24 months out; constrained supply supports both.
Investment metrics
- 1% rule
- 1.20% ✓
- Cap rate
- 9.09%
- Cash-on-cash
- 9.99%
- DSCR
- 1.44
- GRM
- 7.0
CMA / ARV
- ARV (on-the-fly)
- $180,792
- Comps found
- 12
Show comp detail 12 sales within ~0.75 mi
| Address | Dist | Beds/Ba | Sqft | Sold | Price | $/sf | Match |
|---|---|---|---|---|---|---|---|
| 206 Oakland Dr | 0.15mi | 3/2.0 | 1,460 (+0%) | 7mo | $185,000 | $127 | 87 |
| 1022 Gentry St | 0.17mi | 4/2.0 (+1) | 1,503 (+3%) | 3mo | $225,000 | $150 | 80 |
| 207 Oakland Dr | 0.12mi | 4/2.0 (+1) | 1,467 (+1%) | 21mo | $195,000 | $133 | 71 |
| 211 Hawthorne Rd | 0.25mi | 3/2.0 | 1,274 (-13%) | 3mo | $159,000 | $125 | 65 |
| 108 Buckingham Ave | 0.39mi | 2/2.0 (-1) | 1,408 (-3%) | 11mo | $175,000 | $124 | 62 |
| 1337 Taylor Dr | 0.55mi | 3/2.0 | 1,356 (-7%) | 6mo | $222,999 | $164 | 58 |
| 117 Langdon St | 0.52mi | 3/2.0 | 1,560 (+7%) | 9mo | $154,500 | $99 | 57 |
| 1530 Edgecombe Ave | 0.69mi | 3/2.0 | 1,501 (+3%) | 16mo | $165,000 | $110 | 50 |
| 314 Brookwood Ave | 0.69mi | 3/2.0 | 1,600 (+10%) | 4mo | $196,000 | $123 | 48 |
| 302 Neville St | 0.57mi | 3/2.0 | 1,338 (-8%) | 14mo | $165,000 | $123 | 48 |
| 110 Quincy St | 0.49mi | 3/1.0 | 1,250 (-14%) | 4mo | $80,000 | $64 | 46 |
| 158 Kensington Cir | 0.52mi | 3/1.5 | 1,248 (-14%) | 18mo | $131,000 | $105 | 34 |
Match score weights: distance 35% · size 25% · config 20% · recency 20%. Top-matched comps best support the ARV.
Projected returns pro-forma
-3.0% appreciation · 3.49% rent growth · sell at horizon
- IRR
- -0.7%
- Equity multiple
- 0.97×
- Total profit
- $-814
- Equity at exit
- $16,401
- IRR
- 9.5%
- Equity multiple
- 1.75×
- Total profit
- $23,154
- Equity at exit
- $9,511
Cash invested: $30,800 (down + closing). Projections, not guarantees.
Landlord ↔ Tenant lean methodology
- Overall (STATE)
- 85 Strongly Landlord-Friendly
- State North Carolina
- 85 Strongly Landlord-Friendly · R+3
- County
- — inherits STATE
- City
- — inherits STATE
ZIP-level market 28301
- Home prices YoY
- -12.5%
- Rents YoY
- 3.5%
- Active inventory
- 132
- Price-to-rent
- 7.0×
Monthly cashflow live
- Estimated rent
- $1,317 high interval (Pro) →
- Mortgage (P&I)
- −$577
- Tax from tax record
- −$161 /mo · $1,935/yr
- Insurance
- −$46
- HOA
- −$0
- Vacancy / Maint / Mgmt
- −$277
- Net cashflow
- $256
Break-even live
UW: 25.0% down · 7.5% · 30yr · 1.5% tax · 5.0% vac · 8.0% maint · 8.0% mgmt
Financing live
Cash to close
- Down payment
- $27,500
- Closing costs
- $3,300
- Reserves months
- —
- Total cash needed
- —
Loan-product check · same deal, 3 products live
Conventional
25% down · 7.5% · 30yr
- Down + closing
- —
- Monthly P&I
- —
- Monthly cashflow
- —
- DSCR
- —
- Eligible?
- —
Personal DTI + credit; lowest rate.
DSCR
20% down · 8.5% · 30yr
- Down + closing
- —
- Monthly P&I
- —
- Monthly cashflow
- —
- DSCR
- —
- Eligible?
- —
No personal income docs; deal must DSCR.
Hard money
10% down · 12.0% · 12mo
- Down + closing
- —
- Monthly P&I
- —
- Monthly cashflow
- —
- DSCR
- —
- Eligible?
- —
Short-term bridge; refi at stabilization.
Rent comps 28 comps
| Address | Beds | Baths | Sqft | Rent | $/sqft | DOM | Units | Dist |
|---|---|---|---|---|---|---|---|---|
| 307 Hawthorne Rd Fayetteville, NC | 3.0 | 1.0 | 886 | $1,125 | $1.27 | 14d | 1 | 0.23mi |
| 113 Mullins Ave Fayetteville, NC | 2.0 | 1.0 | 1000 | $1,025 | $1.02 | 23d | 1 | 0.37mi |
| 112 Quincy St Fayetteville, NC | 3.0 | 1.0 | 1080 | $1,320 | $1.22 | 14d | 1 | 0.46mi |
| 1608 Fayette Ave Fayetteville, NC | 2.0 | 1.0 | 900 | $875 | $0.97 | 23d | 1 | 0.57mi |
| 1608 Fayette Ave Fayetteville, NC | 2.0 | 1.0 | 900 | $875 | $0.97 | 14d | 1 | 0.57mi |
| 302 Brookwood Ave Fayetteville, NC | 2.0 | 1.0 | 979 | $1,250 | $1.28 | 14d | 1 | 0.63mi |
| 1606 Gibson St Fayetteville, NC | 3.0 | 1.5 | 1014 | $1,000 | $0.99 | 23d | 1 | 0.72mi |
| 1847 Blake St Fayetteville, NC | 3.0 | 2.0 | 900 | $990 | $1.10 | 23d | 1 | 0.75mi |
| 1847 Blake St Fayetteville, NC | 3.0 | 2.0 | 900 | $990 | $1.10 | 14d | 1 | 0.75mi |
| 398 Bainbridge Ct Fayetteville, NC | 3.0 | 2.0 | 900 | $990 | $1.10 | 23d | 1 | 0.90mi |
| 398 Bainbridge Ct Fayetteville, NC | 3.0 | 2.0 | 900 | $990 | $1.10 | 14d | 1 | 0.90mi |
| 1704 Newark Ave Fayetteville, NC | 2.0 | 1.0 | 1100 | $850 | $0.77 | 23d | 1 | 0.94mi |
| 1628 Murchison Rd Fayetteville, NC | 3.0 | 1.0 | 1700 | $1,295 | $0.76 | 23d | 1 | 0.96mi |
| 2061 Osceola Dr Fayetteville, NC | 3.0 | 1.0 | 928 | $1,300 | $1.40 | 23d | 1 | 0.96mi |
| 501 Lambert St Fayetteville, NC | 2.0 | 2.0 | 1200 | $1,230 | $1.02 | 14d | 3 | 1.02mi |
| 1228 Woodland Dr Unit 1 Fayetteville, NC | 2.0 | 2.0 | 1465 | $1,595 | $1.09 | 14d | 1 | 1.04mi |
| 620 Forest Rd Fayetteville, NC | 2.0 | 1.0 | 1000 | $975 | $0.97 | 23d | 2 | 1.07mi |
| 1021 W Rowan St Unit H Fayetteville, NC | 2.0 | 1.5 | 930 | $850 | $0.91 | 23d | 1 | 1.13mi |
| 708 Marketview Ct Fayetteville, NC | 3.0 | 2.0 | 1584 | $1,700 | $1.07 | 23d | 1 | 1.19mi |
| 450 Hay St Fayetteville, NC | 1.0–2.0 | 1.0–2.0 | 799 | $1,745 | $2.18 | 14d | 3 | 1.27mi |
| 1100 Clarendon St #402 Fayetteville, NC | 2.0 | 2.0 | 1073 | $1,400 | $1.30 | 21d | 1 | 1.30mi |
| 536 Pearl St Fayetteville, NC | 2.0 | 1.0 | 1101 | $1,349 | $1.23 | 14d | 1 | 1.35mi |
| 530 Pearl St Unit 1367379P Fayetteville, NC | 3.0 | 2.0 | 1194 | $3,577 | $3.00 | 14d | 1 | 1.36mi |
| 123 Anderson St Fayetteville, NC | 2.0 | 2.0 | 1500 | $1,800 | $1.20 | 23d | 1 | 1.36mi |
| 214 Hay St Unit B Fayetteville, NC | 2.0 | 2.0 | 1700 | $1,685 | $0.99 | 23d | 1 | 1.37mi |
| 809 Cape Fear Ave Fayetteville, NC | 2.0 | 1.0 | 1225 | $1,450 | $1.18 | 21d | 1 | 1.37mi |
| 123 Pennmark Pl Fayetteville, NC | 2.0 | 2.5 | 1380 | $1,600 | $1.16 | 14d | 1 | 1.39mi |
| 159 Maxwell St Unit 200 Fayetteville, NC | 2.0 | 2.0 | 1000 | $1,450 | $1.45 | 23d | 1 | 1.49mi |
Listing history 17 events
-
2026-06-18days on market $110,000 Active 297 DOM
-
2026-06-17days on market $110,000 Active 296 DOM
-
2026-06-16days on market $110,000 Active 295 DOM
-
2026-06-15days on market $110,000 Active 294 DOM
-
2026-06-14days on market $110,000 Active 292 DOM
-
2026-06-13days on market $110,000 Active 291 DOM
-
2026-06-10days on market $110,000 Active 289 DOM
-
2026-06-09days on market $110,000 Active 288 DOM
-
2026-06-08days on market $110,000 Active 287 DOM
-
2026-06-07days on market $110,000 Active 286 DOM
-
2026-06-03days on market $110,000 Active 282 DOM
-
2026-06-02days on market $110,000 Active 281 DOM
-
2026-06-01days on market $110,000 Active 280 DOM
-
2026-05-31days on market $110,000 Active 279 DOM
-
2026-05-30days on market $110,000 Active 278 DOM
-
2026-02-28price $110,000
-
2025-08-25$125,000 Active
ⓘ Source: listings_history table (triggers on properties + properties_extension) + one-shot
backfill from property_details.listing_events for pre-trigger history.
Tax reassessment forecast NC · Resets to sale price
- Current annual tax
- $1,935 · $161/mo
- Projected year-2 tax
- $1,935 · $161/mo
- Expected delta
- $0/yr ($0/mo · 0.0%)
ⓘ Screening estimate from a state-policy table — verify with the county assessor before closing.
Climate risk First Street
- Flood 1/10 Low FEMA zone X (unshaded) · 0% chance over 30 yrs
- Wildfire 3/10 Moderate
- Heat 7/10 Severe 7 d/yr ≥106°F today · 16 d/yr by 30 yrs out
- Wind 6/10 Major 76% chance of damaging wind over 30 yrs
- Air quality 2/10 Low 0 unhealthy d/yr today · 1 by 30 yrs out
Nearby sold comps map
Loading sold comps map…
Walkable amenities ~0.75 mi
Loading nearby amenities…
Taxation est. · year 1
- Rental income
- $15,802
- − Mortgage interest
- −$6,162
- − Property taxes
- −$1,935
- − Insurance
- −$550
- − Repairs & maintenance
- −$1,264
- − Management
- −$1,264
- − Depreciation
- −$3,200
- Taxable income
- $1,426
- Est. tax owed @ 24.0%
- −$342
- After-tax cash flow
- $2,733/yr
For passive investors: Depreciation is non-cash, so a rental often shows a tax loss while cash-flowing — sheltering income. Rental losses are passive: they offset passive income freely, and up to $25,000/yr can offset ordinary (W-2) income if you actively participate and your MAGI is under $100k (phasing out to $0 by $150k); unused losses carry forward. On sale, claimed depreciation is recaptured at up to 25%, and gains may owe capital-gains tax (a 1031 exchange can defer both). Figures are a year-1 estimate at your 24.0% rate — not tax advice; consult a CPA.
Schools (NCES district)
- District
- Cumberland County Schools
- NCES district ID
- 3700011
- Math proficiency
- 32% ▼ -2.00%
- Reading proficiency
- 41% ▼ -1.00%
- Median HH income
- $44,168
- Composite
- 31.0/100
- National rank
- #6096
- State rank
- #126 of 178 in NC
Livability — Fayetteville
- Score
- 75/100
- State rank
- #45
- US rank
- #4031
Category grades
Schools grade is shown separately in the Schools card above.
Census & demographics
- Census place
- Fayetteville, NC
- County
- Cumberland County · 265,314 people
- City population
- 226,118
- Metro
- Fayetteville, NC
- Population (ZIP)
- 16,798
- Household income
- $39,198
- Rent vs Own
- Severe rent burden
- 1389.0
Population outlook (Cumberland County) Hauer SSP2
- Today (2025)
- 330,855 people
- By 2030
- 333,523 · +0.8%
- By 2040
- 335,583 · +1.4%
- By 2050
- 335,325 · +1.4%
- By 2075
- 342,853 · +3.6%
- By 2100
- 340,698 · +3.0%
Race, ethnicity, and origin ACS 2023
- Neighborhood character
- Predominantly Black (68%)
- Race & ethnicity
- Black 68% White 19% Two or more races 6% Hispanic / Latino 5%
- Common ancestry
- Serbian 1% Slovak 1% Romanian 1%
- Foreign-born
- 3% · Canada
- Languages at home
- 95% English-only · Spanish 3% French/Haitian/Cajun 1%
Political lean MEDSL · Cumberland
- 2024 margin
- D (+13.4) · D 56.1% · R 42.7% · Other 1.2%
- 2008→2024 swing
- -4.3pp toward R · 2008: 17.7pp · 2024: 13.4pp
- All cycles
- 2024: D+13.4 2020: D+16.6 2016: D+16.0 2012: D+19.7 2008: D+17.7
Not yet ingested
- Civics
- —
Market trends
- HPI YoY
- ▼ -37.92%
- Current HPI
- 265.98
- Rent YoY
- ▲ 3.49%
- Metro
- Fayetteville, NC
- State GDP YoY
- ▲ 3.28%
- F500 in state
- 26
Industry mix (Fortune 500 HQ in NC)
| Industry | F500 HQs | Revenue |
|---|---|---|
| Financial Services | 2 | $213B |
|
||
| Retail | 2 | $95B |
|
||
| Industrial Conglomerate | 1 | $38B |
|
||
| Metals / Steel | 1 | $35B |
|
||
| Utilities | 1 | $30B |
|
||
| Industrial Machinery | 1 | $19B |
|
||
Price history
-12.0% since first listed2 events — show timeline
- 2026-02-28 Price Changed $110,000 LPRMLS
- 2025-08-25 Listed $125,000 LPRMLS
Property tax history
+7.3%/yrLatest (2025): $1,935 · +65.0% YoY. Source: county tax records.
Cash-flow waterfall
monthlySold comps — $/sqft
last 12 mo · ≤1 miLoading sold comps…