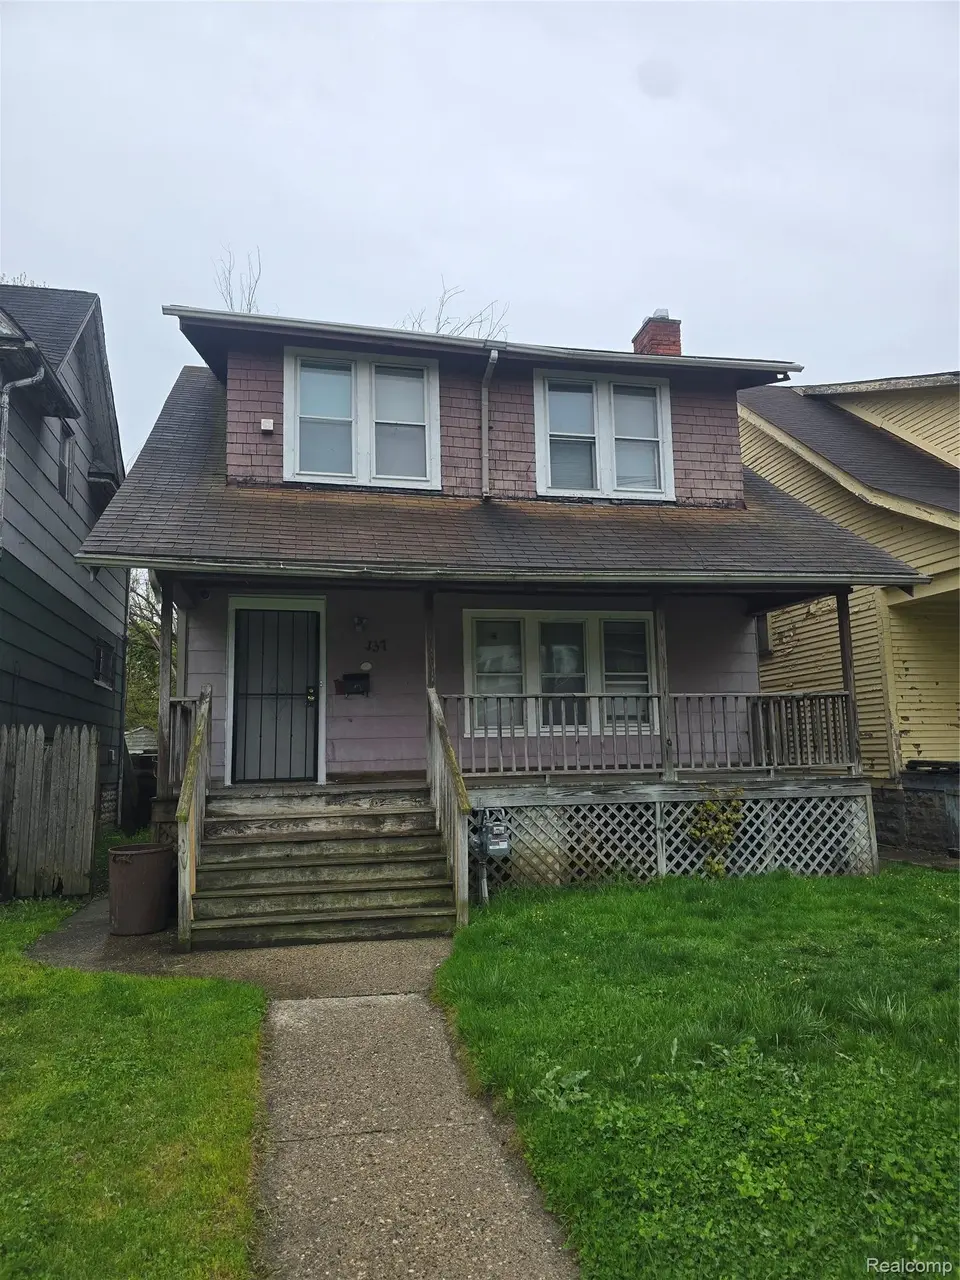
137 Geneva St · Highland Park, MI
Flood risk 1/10 · Minimal
- FEMA flood zone
- X (unshaded)
- Chance of flooding over 30 yrs
- 0.0%
- Est. flood insurance / yr
- $473 – $860
Fire risk 1/10 · Minimal
- Est. fire insurance / yr
- $784 – $1,456
Heat risk 3/10 · Minor
- Hot days now (above 97°F)
- 7 days/yr
- Hot days in 30 yrs
- 14 days/yr
Wind risk 2/10 · Minimal
- Chance of severe wind over 30 yrs
- —
Air-quality risk 4/10 · Minor
- Unhealthy air days now
- 4 days/yr
- Unhealthy air days in 30 yrs
- 6 days/yr
Risk factors via First Street. Map © Google.
Why this score? — see what drove the B grade
The composite is a weighted blend of 9 inputs, each scored 0–100. Each bar is that input's sub-score; the figure is the points it added to the 100-point composite (weight × sub-score).
- Cash flow +30.0/30.0
- 1% rule +10.0/10.0
- DSCR +10.0/10.0
- ARV discount +7.5/15.0
- Schools +5.0/10.0
- Livability +3.7/5.0
- Rent growth +2.5/5.0
- Condition / age +2.5/5.0
- Appreciation +0.0/10.0
$83,900
🖨 Deal sheet 📄 Offer letter ✓ Due diligence
Listing remarks MLS
SPACIOUS BUNGALOW HOME LOCATED SOUTH OF W. MCNICHOLS AND WEST OF WOODWARD. THIS HOME FEATURES A COVERED FRONT PORCH, LARGE LIVING ROOM WITH FIREPLACE, FORMAL DINING ROOM, HARDWOOD FLOORS, HUGE KITCHEN, THREE GOOD SIZED BEDROOM, AND AN UNFINISHED BASEMENT. PROPERTY RECENTLY WENT VACANT! UPDATED PICTURES COMING! PROPERTY IS SOLD AS-IS. ALL DIMENSIONS ARE ESTIMATED AND SHOULD BE VERIFIED. ALL SHOWINGS REQUIRE A LICENSED AGENT TO BE PRESENT. BUYER TO PAY DETROIT INVESTMENT CO A 295 PROCESSING FEE AT CLOSING.
Key facts
- Covered front porch
- Formal dining room
- Unfinished basement
Tags
Neighborhood map
What this means for you Summary
Snapshot
- This is a 3-bed/1.0-bath single-family listed at $84k.
Deal economics
- At list price, monthly cash flow is $603 ($7k/yr) — positive.
- The deal already cash-flows at list — no discount required.
- Meets the 1% rule at list price ($1k rent vs $84k).
- Recommended offer: $74k (12.0% below list) — sets the bar for market timing.
Location & tenants
- Location reads 73/100 on livability (#214 in MI) — a middle-class / working-renter tenant base. Strengths: commute A+, cost of living A+, housing A+; Watch: schools F, crime F, employment F.
- Market conditions: 216 active listings in the ZIP; 26 comparable units currently listed for rent nearby; rentals lingering (median 44d on market — plan ~5-8 weeks vacancy on turnover, expect pricing pressure); 50% of comp listings sitting > 30 days — soft ceiling on asking rent; lower-income renter base — watch delinquency; 2,639 units permitted in Wayne County in 2024 (1,216 in 5+ unit buildings).
- This rent runs 44% of the median local income ($38k/yr) — at the standard rent-burdened threshold; future hikes will face affordability resistance.
Forward outlook
- Local home prices are declining (-3.0%/yr); year-one equity from $580 of loan paydown is wiped out by about $3k of value loss. Plan a longer hold.
- Wayne County population projected at -17% by 2050 — secular population decline; favor cash flow + early exit over multi-decade hold.
- At projected returns (-3.0% appreciation + 3.0% rent growth), your $23k cash investment doubles in ~4 years — after that, you're playing with house money.
Negotiation context
- It's been on market 165 days — a 12% lower offer ($74k) is reasonable based on typical stale-listing flexibility.
- 3 sale attempts since 29y ago; this cycle's ask has dropped $6k (7%) from the opening price — seller is motivated, your offer sets the floor, not the list.
Risks & watch-outs
- Watch-outs: built in 1915 — expect roof / HVAC / electrical / plumbing capex.
Questions for the listing agent
- It's been on market 165 days. Have you received any prior offers? Is the seller open to a 12% concession, seller financing, or rate buy-down credit?
- Built in 1915 — when were the roof, HVAC, electrical panel, plumbing, and water heater last replaced?
- Why hasn't it sold? Are there any deal-killer items the seller is aware of (foundation, flood, title, zoning, code violations)?
- Is there a deadline driving the sale (1031 exchange, divorce, estate, relocation)? That informs how much negotiation room exists.
- Schools are F-rated, which usually means shorter tenancies and higher turnover. Who's the typical renter profile here, and what's been the actual vacancy rate?
- Crime grade is F in this area — have there been break-ins, vandalism, or insurance claims at this property in the last 3 years? What carrier currently insures it and at what premium?
- What's the average days-on-market for RENTAL listings here right now (not sales)? A rising rental-DOM trend means longer vacancies and softer asking-rent achievability than the comps imply.
- What's the recent tenant-quality profile in this submarket — average credit score on applications, eviction rate, late-payment / NSF rate, and stable-employment percentage? A property-management company in the area should have these aggregated.
- How much new for-sale + rental construction is in the pipeline within 1–3 miles? Heavy new supply typically softens prices + rents 12–24 months out; constrained supply supports both.
Investment metrics
- 1% rule
- 1.66% ✓
- Cap rate
- 14.92%
- Cash-on-cash
- 30.80%
- DSCR
- 2.37
- GRM
- 5.0
CMA / ARV
- ARV (median comp)
- $44,969
- List price
- $83,900
- Delta
- 86.57%
- Verdict
- OVERPRICED
- Comps
- 20 within 1.0 mi
Show comp detail 12 sales within ~0.75 mi
| Address | Dist | Beds/Ba | Sqft | Sold | Price | $/sf | Match |
|---|---|---|---|---|---|---|---|
| 241 Moss St | 0.33mi | 3/1.0 | 1,300 (+2%) | 3mo | $172,500 | $133 | 79 |
| 50 Eason St | 0.23mi | 3/1.5 | 1,162 (-9%) | 1mo | $47,500 | $41 | 71 |
| 220 Moss St | 0.28mi | 3/1.5 | 1,379 (+8%) | 12mo | $186,000 | $135 | 62 |
| 326 Eason St | 0.38mi | 3/1.0 | 1,256 (-1%) | 23mo | $37,000 | $29 | 61 |
| 101 Stevens St | 0.49mi | 3/1.5 | 1,200 (-6%) | 6mo | $75,000 | $63 | 60 |
| 16570 Inverness St | 0.67mi | 4/2.0 (+1) | 1,300 (+2%) | 3mo | $120,000 | $92 | 54 |
| 361 Pilgrim St | 0.55mi | 2/1.0 (-1) | 1,368 (+7%) | 10mo | $8,000 | $6 | 49 |
| 16177 Inverness St | 0.74mi | 3/1.0 | 1,404 (+10%) | 4mo | $70,000 | $50 | 45 |
| 116 Church St | 0.54mi | 3/1.5 | 1,400 (+10%) | 15mo | $106,500 | $76 | 44 |
| 17314 Brush St | 0.70mi | 3/1.0 | 1,144 (-10%) | 16mo | $26,300 | $23 | 37 |
| 140 Ferris St | 0.64mi | 3/1.0 | 1,100 (-14%) | 12mo | $21,000 | $19 | 37 |
| 194 Candler St | 0.70mi | 3/1.5 | 1,152 (-10%) | 17mo | $27,500 | $24 | 35 |
Match score weights: distance 35% · size 25% · config 20% · recency 20%. Top-matched comps best support the ARV.
Projected returns pro-forma
-3.0% appreciation · 3.0% rent growth · sell at horizon
- IRR
- 25.5%
- Equity multiple
- 2.05×
- Total profit
- $24,779
- Equity at exit
- $12,510
- IRR
- 33.2%
- Equity multiple
- 4.02×
- Total profit
- $70,913
- Equity at exit
- $7,254
Cash invested: $23,492 (down + closing). Projections, not guarantees.
Landlord ↔ Tenant lean methodology
- Overall (STATE)
- 62 Landlord-Friendly
- State Michigan
- 62 Landlord-Friendly · EVEN
- County
- — inherits STATE
- City
- — inherits STATE
ZIP-level market 48203
- Home prices YoY
- -23.3%
- Active inventory
- 216
- Price-to-rent
- 5.0×
Monthly cashflow live
- Estimated rent
- $1,396 high interval (Pro) →
- Mortgage (P&I)
- −$440
- Tax from tax record
- −$25 /mo · $297/yr
- Insurance
- −$35
- HOA
- −$0
- Vacancy / Maint / Mgmt
- −$293
- Net cashflow
- $603
Break-even live
UW: 25.0% down · 7.5% · 30yr · 1.5% tax · 5.0% vac · 8.0% maint · 8.0% mgmt
Financing live
Cash to close
- Down payment
- $20,975
- Closing costs
- $2,517
- Reserves months
- —
- Total cash needed
- —
Loan-product check · same deal, 3 products live
Conventional
25% down · 7.5% · 30yr
- Down + closing
- —
- Monthly P&I
- —
- Monthly cashflow
- —
- DSCR
- —
- Eligible?
- —
Personal DTI + credit; lowest rate.
DSCR
20% down · 8.5% · 30yr
- Down + closing
- —
- Monthly P&I
- —
- Monthly cashflow
- —
- DSCR
- —
- Eligible?
- —
No personal income docs; deal must DSCR.
Hard money
10% down · 12.0% · 12mo
- Down + closing
- —
- Monthly P&I
- —
- Monthly cashflow
- —
- DSCR
- —
- Eligible?
- —
Short-term bridge; refi at stabilization.
Rent comps 26 comps
| Address | Beds | Baths | Sqft | Rent | $/sqft | DOM | Units | Dist |
|---|---|---|---|---|---|---|---|---|
| 17550 2nd Ave Detroit, MI | 2.0 | 1.0 | 1350 | $1,150 | $0.85 | 18d | 1 | 0.27mi |
| 326 Eason St Highland Park, MI | 3.0 | 1.0 | 1256 | $1,300 | $1.04 | 17d | 1 | 0.38mi |
| 885 Covington Dr Unit 201 Highland Park, MI | 2.0 | 2.0 | 1350 | $1,695 | $1.26 | 44d | 1 | 0.43mi |
| 101 Stevens St Highland Park, MI | 3.0 | 1.5 | 1152 | $1,600 | $1.39 | 17d | 1 | 0.49mi |
| 17666 Manderson Rd Unit 17666 Detroit, MI | 2.0 | 1.0 | 1200 | $1,595 | $1.33 | 44d | 1 | 0.55mi |
| 17670 Manderson Rd Unit 17670 Detroit, MI | 2.0 | 1.0 | 1199 | $1,595 | $1.33 | 44d | 1 | 0.55mi |
| 1029 Covington Dr Unit 1029 Detroit, MI | 2.0 | 1.0 | 1200 | $1,495 | $1.25 | 44d | 1 | 0.55mi |
| 1031 Covington Dr Unit 1061 Detroit, MI | 2.0 | 1.0 | 1200 | $1,595 | $1.33 | 44d | 1 | 0.56mi |
| 17765 Manderson Rd Unit 14 Highland Park, MI | 2.0 | 1.0 | 1000 | $1,175 | $1.18 | 44d | 1 | 0.63mi |
| 17765 Manderson Rd Unit 8 Highland Park, MI | 2.0 | 1.0 | 1000 | $1,215 | $1.22 | 2d | 1 | 0.63mi |
| 16927 Inverness St Detroit, MI | 2.0 | 1.0 | 897 | $1,650 | $1.84 | 17d | 1 | 0.69mi |
| 2521 W McNichols Rd Unit B2 Detroit, MI | 2.0 | 1.0 | 1300 | $1,250 | $0.96 | 44d | 1 | 0.84mi |
| 574 W Golden Gate Highland Park, MI | 3.0 | 1.0 | 1315 | $1,300 | $0.99 | 44d | 1 | 0.91mi |
| 406 W Goldengate St Detroit, MI | 2.0 | 1.0 | 1050 | $1,100 | $1.05 | 44d | 1 | 0.91mi |
| 404 W Golden Gate Highland Park, MI | 2.0 | 1.0 | 1050 | $1,100 | $1.05 | 44d | 1 | 0.92mi |
| 16174 Princeton St Detroit, MI | 2.0 | 1.0 | 985 | $1,100 | $1.12 | 19d | 1 | 1.01mi |
| 16174 Princeton St Unit 2 Detroit, MI | 2.0 | 1.0 | 985 | $1,100 | $1.12 | 44d | 1 | 1.01mi |
| 27 Pasadena St Highland Park, MI | 2.0 | 1.0 | 900 | $825 | $0.92 | 44d | 1 | 1.02mi |
| 15906 Alden St Detroit, MI | 3.0 | 1.0 | 1030 | $1,150 | $1.12 | 17d | 1 | 1.14mi |
| 16834 Fairfield St Detroit, MI | 2.0 | 1.0 | 1516 | $1,363 | $0.90 | 24d | 1 | 1.28mi |
| 1926 Clements St Unit 1926 Detroit, MI | 3.0 | 1.0 | 1150 | $1,250 | $1.09 | 20d | 1 | 1.33mi |
| 1926 Clements St Detroit, MI | 3.0 | 1.0 | 1150 | $1,150 | $1.00 | 5d | 1 | 1.33mi |
| 168 Beresford St Highland Park, MI | 4.0 | 1.0 | 1541 | $1,475 | $0.96 | 17d | 1 | 1.33mi |
| 15345 Parkside St Detroit, MI | 3.0 | 1.0 | 1152 | $1,300 | $1.13 | 44d | 1 | 1.40mi |
| 64 Glendale St Highland Park, MI | 4.0 | 1.0 | 1464 | $1,500 | $1.02 | 10d | 1 | 1.40mi |
| 18503 Riopelle St Highland Park, MI | 3.0 | 1.0 | 1254 | $1,250 | $1.00 | 5d | 1 | 1.47mi |
Listing history 10 events
-
2026-04-02price $83,900 509-char remark
Show marketing remark (509 chars)
SPACIOUS BUNGALOW HOME LOCATED SOUTH OF W. MCNICHOLS AND WEST OF WOODWARD. THIS HOME FEATURES A COVERED FRONT PORCH, LARGE LIVING ROOM WITH FIREPLACE, FORMAL DINING ROOM, HARDWOOD FLOORS, HUGE KITCHEN, THREE GOOD SIZED BEDROOM, AND AN UNFINISHED BASEMENT. PROPERTY RECENTLY WENT VACANT! UPDATED PICTURES COMING! PROPERTY IS SOLD AS-IS. ALL DIMENSIONS ARE ESTIMATED AND SHOULD BE VERIFIED. ALL SHOWINGS REQUIRE A LICENSED AGENT TO BE PRESENT. BUYER TO PAY DETROIT INVESTMENT CO A 295 PROCESSING FEE AT CLOSING.
-
2026-01-30price $88,900 509-char remark
Show marketing remark (509 chars)
SPACIOUS BUNGALOW HOME LOCATED SOUTH OF W. MCNICHOLS AND WEST OF WOODWARD. THIS HOME FEATURES A COVERED FRONT PORCH, LARGE LIVING ROOM WITH FIREPLACE, FORMAL DINING ROOM, HARDWOOD FLOORS, HUGE KITCHEN, THREE GOOD SIZED BEDROOM, AND AN UNFINISHED BASEMENT. PROPERTY RECENTLY WENT VACANT! UPDATED PICTURES COMING! PROPERTY IS SOLD AS-IS. ALL DIMENSIONS ARE ESTIMATED AND SHOULD BE VERIFIED. ALL SHOWINGS REQUIRE A LICENSED AGENT TO BE PRESENT. BUYER TO PAY DETROIT INVESTMENT CO A 295 PROCESSING FEE AT CLOSING.
-
2026-01-29price $88,900 509-char remark
Show marketing remark (509 chars)
SPACIOUS BUNGALOW HOME LOCATED SOUTH OF W. MCNICHOLS AND WEST OF WOODWARD. THIS HOME FEATURES A COVERED FRONT PORCH, LARGE LIVING ROOM WITH FIREPLACE, FORMAL DINING ROOM, HARDWOOD FLOORS, HUGE KITCHEN, THREE GOOD SIZED BEDROOM, AND AN UNFINISHED BASEMENT. PROPERTY RECENTLY WENT VACANT! UPDATED PICTURES COMING! PROPERTY IS SOLD AS-IS. ALL DIMENSIONS ARE ESTIMATED AND SHOULD BE VERIFIED. ALL SHOWINGS REQUIRE A LICENSED AGENT TO BE PRESENT. BUYER TO PAY DETROIT INVESTMENT CO A 295 PROCESSING FEE AT CLOSING.
-
2025-12-15$89,900 Active 509-char remark
Show marketing remark (509 chars)
SPACIOUS BUNGALOW HOME LOCATED SOUTH OF W. MCNICHOLS AND WEST OF WOODWARD. THIS HOME FEATURES A COVERED FRONT PORCH, LARGE LIVING ROOM WITH FIREPLACE, FORMAL DINING ROOM, HARDWOOD FLOORS, HUGE KITCHEN, THREE GOOD SIZED BEDROOM, AND AN UNFINISHED BASEMENT. PROPERTY RECENTLY WENT VACANT! UPDATED PICTURES COMING! PROPERTY IS SOLD AS-IS. ALL DIMENSIONS ARE ESTIMATED AND SHOULD BE VERIFIED. ALL SHOWINGS REQUIRE A LICENSED AGENT TO BE PRESENT. BUYER TO PAY DETROIT INVESTMENT CO A 295 PROCESSING FEE AT CLOSING.
-
2019-01-24soldstatus $80,000
-
1999-04-15soldstatus $10,000
-
1997-09-03historical
-
1997-06-03$12,000
ⓘ Source: listings_history table (triggers on properties + properties_extension) + one-shot
backfill from property_details.listing_events for pre-trigger history.
Tax reassessment forecast MI · Partial reset (capped growth)
- Current annual tax
- $297 · $25/mo
- Projected year-2 tax
- $794 · $66/mo
- Expected delta
- +$498/yr (+$41/mo · 167.8%)
ⓘ Screening estimate from a state-policy table — verify with the county assessor before closing.
Climate risk First Street
- Flood 1/10 Low FEMA zone X (unshaded) · 0% chance over 30 yrs
- Wildfire 1/10 Low
- Heat 3/10 Moderate 7 d/yr ≥97°F today · 14 d/yr by 30 yrs out
- Wind 2/10 Low
- Air quality 4/10 Moderate 4 unhealthy d/yr today · 6 by 30 yrs out
Nearby sold comps map
Loading sold comps map…
Walkable amenities ~0.75 mi
Loading nearby amenities…
Taxation est. · year 1
- Rental income
- $16,749
- − Mortgage interest
- −$4,700
- − Property taxes
- −$297
- − Insurance
- −$420
- − Repairs & maintenance
- −$1,340
- − Management
- −$1,340
- − Depreciation
- −$2,441
- Taxable income
- $6,212
- Est. tax owed @ 24.0%
- −$1,491
- After-tax cash flow
- $5,745/yr
For passive investors: Depreciation is non-cash, so a rental often shows a tax loss while cash-flowing — sheltering income. Rental losses are passive: they offset passive income freely, and up to $25,000/yr can offset ordinary (W-2) income if you actively participate and your MAGI is under $100k (phasing out to $0 by $150k); unused losses carry forward. On sale, claimed depreciation is recaptured at up to 25%, and gains may owe capital-gains tax (a 1031 exchange can defer both). Figures are a year-1 estimate at your 24.0% rate — not tax advice; consult a CPA.
Schools (NCES district)
No district data.
Livability — Highland Park
- Score
- 73/100
- State rank
- #214
- US rank
- #5271
Category grades
Schools grade is shown separately in the Schools card above.
Census & demographics
- Census place
- Highland Park, MI
- County
- Wayne County · 1,562,939 people
- Metro
- Detroit-Warren-Dearborn, MI
- Population (ZIP)
- 20,049
- Household income
- $38,404
- Rent vs Own
- Severe rent burden
- 1192.0
Population outlook (Wayne County) Hauer SSP2
- Today (2025)
- 1,675,273 people
- By 2030
- 1,620,300 · -3.3%
- By 2040
- 1,502,341 · -10.3%
- By 2050
- 1,384,039 · -17.4%
- By 2075
- 1,124,592 · -32.9%
- By 2100
- 881,193 · -47.4%
Race, ethnicity, and origin ACS 2023
- Neighborhood character
- Predominantly Black (85%)
- Race & ethnicity
- Black 85% White 8% Two or more races 5% Hispanic / Latino 2%
- Common ancestry
- Lithuanian 1%
- Foreign-born
- 2% · Canada
- Languages at home
- 95% English-only · Spanish 3% French/Haitian/Cajun 1%
Political lean MEDSL · Wayne
- 2024 margin
- Strong D (+29.0) · D 62.7% · R 33.7% · Other 3.6%
- 2008→2024 swing
- -20.5pp toward R · 2008: 49.5pp · 2024: 29.0pp
- All cycles
- 2024: D+29.0 2020: D+38.1 2016: D+37.3 2012: D+46.9 2008: D+49.5
Not yet ingested
- Civics
- —
Market trends
- HPI YoY
- ▼ -90.13%
- Current HPI
- 297.0176
- Rent YoY
- —
- Metro
- Detroit-Warren-Dearborn, MI
- State GDP YoY
- ▲ 1.37%
- F500 in state
- 28
Industry mix (Fortune 500 HQ in MI)
| Industry | F500 HQs | Revenue |
|---|---|---|
| Automotive Parts | 3 | $48B |
|
||
| Automotive | 2 | $372B |
|
||
| Chemicals | 1 | $45B |
|
||
| Automotive Retail | 1 | $29B |
|
||
| Healthcare / Medical Devices | 1 | $23B |
|
||
| Automotive Technology | 1 | $20B |
|
||
Price history
+599.2% since first listed10 events — show timeline
- 2026-04-02 Price Changed $83,900 MiRealSource-MiMLS
- 2026-04-02 Price Changed $83,900 REALCOMP
- 2026-01-30 Price Changed $88,900 MiRealSource-MiMLS
- 2026-01-29 Price Changed $88,900 REALCOMP
- 2025-12-15 Listed $89,900 REALCOMP
- 2025-12-15 Listed $89,900 MiRealSource-MiMLS
- 2019-01-24 Sold (Public Records) $80,000 Public Records
- 1999-04-15 Sold (Public Records) $10,000 Public Records
- 1997-09-03 Listing Removed — REALCOMP
- 1997-06-03 Listed $12,000 REALCOMP
Property tax history
-13.5%/yrLatest (2025): $297 · -18.5% YoY. Source: county tax records.
Cash-flow waterfall
monthlySold comps — $/sqft
last 12 mo · ≤1 miLoading sold comps…