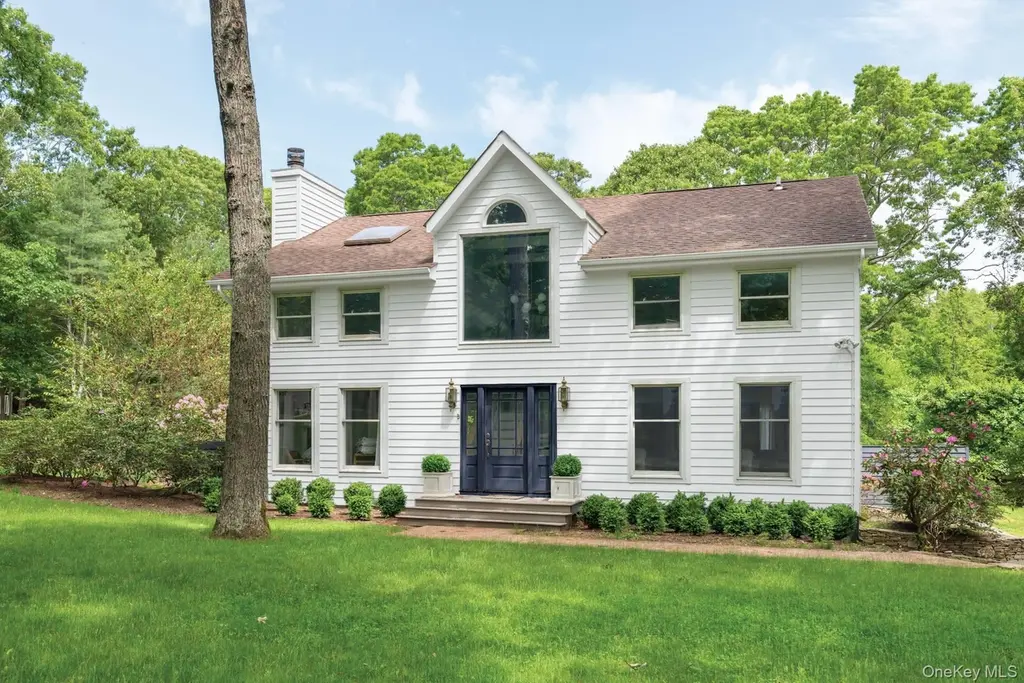
45 Harbor Watch Ct · Noyack, NY
Flood risk 1/10 · Minimal
- FEMA flood zone
- X (unshaded)
- Chance of flooding over 30 yrs
- 0.0%
- Est. flood insurance / yr
- $473 – $860
Fire risk 1/10 · Minimal
- Est. fire insurance / yr
- $691 – $1,283
Heat risk 4/10 · Minor
- Hot days now (above 90°F)
- 7 days/yr
- Hot days in 30 yrs
- 19 days/yr
Wind risk 8/10 · Major
- Chance of severe wind over 30 yrs
- 80.0%
Air-quality risk 3/10 · Minor
- Unhealthy air days now
- 2 days/yr
- Unhealthy air days in 30 yrs
- 3 days/yr
Risk factors via First Street. Map © Google.
Why this score? — see what drove the B grade
The composite is a weighted blend of 9 inputs, each scored 0–100. Each bar is that input's sub-score; the figure is the points it added to the 100-point composite (weight × sub-score).
- Cash flow +29.1/30.0
- DSCR +10.0/10.0
- Appreciation +9.6/10.0
- 1% rule +6.9/10.0
- Schools +5.6/10.0
- Rent growth +5.0/5.0
- Livability +2.9/5.0
- ARV discount +2.6/15.0
- Condition / age +2.5/5.0
$2,295,000
🖨 Deal sheet (PDF) 📄 Offer letter ✓ Due diligence
Listing remarks MLS
Just Outside of Sag Harbor Village on a Quiet Street This four-bedroom, 2.5-bathroom traditional is situated on a quiet street just outside of Sag Harbor Village. The home features a triple-height, cathedral-ceiling living room/dining room area with an abundance of natural light. Also featured are a first floor primary bedroom, a heated pool with extensive decking, a hot tub, and an attached single-car garage. All of this is situated on a beautiful one acre parcel.
Key facts
- Extensive decking
- Hot tub
- One acre parcel
Tags
Neighborhood map
What this means for you Summary
Snapshot
- This is a 4-bed/2.0-bath single-family listed at $2.29M.
Deal economics
- At list price, monthly cash flow is $8k ($95k/yr) — positive.
- The deal already cash-flows at list — no discount required.
- Meets the 1% rule at list price ($27k rent vs $2.29M).
- Recommended offer: $2.02M (12.0% below list) — sets the bar for market timing.
- Cap rate 10.4% vs local median 7.1% in Noyack — top-decile yield for the area; either an underpriced asset or a hidden risk that comps aren't pricing in. Stress-test before assuming the spread holds.
Location & tenants
- Location reads 57/100 on livability (#1,084 in NY) — a working-class tenant base; expect higher turnover. Strengths: crime A+, employment A+; Watch: schools C-, housing D+, amenities F.
- Sag Harbor Union Free School District (suburban): math 54% / reading 70% proficiency, ranked #175 of 590 in NY (top 30%) — acceptable for families but not a draw, mixed tenant base, ~2y average lease; only 8% free/reduced lunch — higher-income household profile.
- Market conditions: Rents rising fast (+10.8%/yr); 65 active listings in the ZIP; 5 comparable units currently listed for rent nearby; rentals at typical pace (median 23d on market — plan ~3-4 weeks tenant-placement turnaround); high-income renter base; 1,366 units permitted in Suffolk County in 2024 (216 in 5+ unit buildings).
- At $27,217/mo this rent would consume 256% of the median local household income ($128k/yr) (locally 95% of renters already pay >50% of income on rent) — very limited rent-growth headroom before tenants either downsize or default.
Forward outlook
- In year one you build about $227k of equity ($16k loan paydown + $211k appreciation (9.2% local appreciation)).
- Suffolk County population projected to shrink 5% by 2050 — rents likely to lag national; underwrite the cash flow, not the appreciation.
- At projected returns (9.2% appreciation + 8.0% rent growth), your $643k cash investment doubles in ~2 years — after that, you're playing with house money.
- By year 2, paydown + projected appreciation supports a ~$364k cash-out refi (75% LTV) — recoverable capital for the next deal without selling this one.
Negotiation context
- It's been on market 172 days — a 12% lower offer ($2.02M) is reasonable based on typical stale-listing flexibility.
- Current owner paid $1.07M; list at $2.29M implies a 114% gain — meaningful room to come down on a strong offer.
Risks & watch-outs
- Climate carrying-cost: severe wind risk, 80% chance of damaging wind over 30y — expect insurance premiums to compound above CPI over the hold.
Questions for the listing agent
- It's been on market 172 days. Have you received any prior offers? Is the seller open to a 12% concession, seller financing, or rate buy-down credit?
- Why hasn't it sold? Are there any deal-killer items the seller is aware of (foundation, flood, title, zoning, code violations)?
- Is there a deadline driving the sale (1031 exchange, divorce, estate, relocation)? That informs how much negotiation room exists.
- What's the average days-on-market for RENTAL listings here right now (not sales)? A rising rental-DOM trend means longer vacancies and softer asking-rent achievability than the comps imply.
- What's the recent tenant-quality profile in this submarket — average credit score on applications, eviction rate, late-payment / NSF rate, and stable-employment percentage? A property-management company in the area should have these aggregated.
- How much new for-sale + rental construction is in the pipeline within 1–3 miles? Heavy new supply typically softens prices + rents 12–24 months out; constrained supply supports both.
Investment metrics
- 1% rule
- 1.19% ✓
- Cap rate
- 10.43%
- Cash-on-cash
- 14.78%
- DSCR
- 1.66
- GRM
- 7.0
CMA / ARV
- ARV (median comp)
- $2,067,687
- List price
- $2,295,000
- Delta
- 10.99%
- Verdict
- OVERPRICED
- Comps
- 10 within 1.0 mi
Show comp detail 6 sales within ~0.75 mi
| Address | Dist | Beds/Ba | Sqft | Sold | Price | $/sf | Match |
|---|---|---|---|---|---|---|---|
| 45 Harbor Watch Ct | 0.00mi | 4/2.5 | 2,100 (+7%) | 0mo | $2,100,000 | $1,000 | 87 |
| 961 Brick Kiln Rd | 0.38mi | 4/2.0 | 1,783 (-9%) | 1mo | $1,680,000 | $942 | 66 |
| 69 Bay View Dr W | 0.51mi | 3/3.5 (-1) | 2,000 (+2%) | 9mo | $2,350,000 | $1,175 | 55 |
| 24 Bayview Rd | 0.41mi | 3/2.0 (-1) | 1,800 (-8%) | 14mo | $1,320,000 | $733 | 50 |
| 4538 Noyac Rd | 0.63mi | 3/2.5 (-1) | 1,870 (-5%) | 20mo | $1,650,000 | $882 | 39 |
| 221 Redwood Rd | 0.72mi | 3/2.0 (-1) | 2,010 (+2%) | 23mo | $1,451,000 | $722 | 38 |
Match score weights: distance 35% · size 25% · config 20% · recency 20%. Top-matched comps best support the ARV.
Projected returns pro-forma
9.19% appreciation · 8.0% rent growth · sell at horizon
- IRR
- 36.0%
- Equity multiple
- 3.76×
- Total profit
- $1,770,368
- Equity at exit
- $1,932,803
- IRR
- 33.2%
- Equity multiple
- 9.00×
- Total profit
- $5,143,734
- Equity at exit
- $4,032,669
Cash invested: $642,600 (down + closing). Projections, not guarantees.
Landlord ↔ Tenant lean methodology
- Overall (STATE)
- 15 Strongly Tenant-Friendly
- State New York
- 15 Strongly Tenant-Friendly · D+10
- County
- — inherits STATE
- City
- — inherits STATE
ZIP-level market 11963
- Home prices YoY
- 1.9%
- Rents YoY
- 10.8%
- Active inventory
- 65
- Price-to-rent
- 7.0×
Monthly cashflow live
- Estimated rent
- $27,217 medium interval (Pro) →
- Mortgage (P&I)
- −$12,035
- Tax from tax record
- −$593 /mo · $7,112/yr
- Insurance
- −$956
- HOA
- −$0
- Vacancy / Maint / Mgmt
- −$5,715
- Net cashflow
- $7,917
Break-even live
Sensitivity live
| Price | -10% $9,216 | -5% $8,567 | +0% $7,917 | +5% $7,267 | +10% $6,618 |
|---|---|---|---|---|---|
| Rent | -10% $5,767 | -5% $6,842 | +0% $7,917 | +5% $8,992 | +10% $10,067 |
| Rate | -1.0pp $9,073 | -0.5pp $8,501 | base $7,917 | +0.5pp $7,322 | +1.0pp $6,717 |
UW: 25.0% down · 7.5% · 30yr · 1.5% tax · 5.0% vac · 8.0% maint · 8.0% mgmt
Financing live
Cash to close
- Down payment
- $573,750
- Closing costs
- $68,850
- Reserves months
- —
- Total cash needed
- —
Loan-product check · same deal, 3 products live
Conventional
25% down · 7.5% · 30yr
- Down + closing
- —
- Monthly P&I
- —
- Monthly cashflow
- —
- DSCR
- —
- Eligible?
- —
Personal DTI + credit; lowest rate.
DSCR
20% down · 8.5% · 30yr
- Down + closing
- —
- Monthly P&I
- —
- Monthly cashflow
- —
- DSCR
- —
- Eligible?
- —
No personal income docs; deal must DSCR.
Hard money
10% down · 12.0% · 12mo
- Down + closing
- —
- Monthly P&I
- —
- Monthly cashflow
- —
- DSCR
- —
- Eligible?
- —
Short-term bridge; refi at stabilization.
Rent comps 5 comps
| Address | Beds | Baths | Sqft | Rent | $/sqft | DOM | Units | Dist |
|---|---|---|---|---|---|---|---|---|
| 4056 Noyack Rd Sag Harbor, NY | 4.0 | 3.0 | 2323 | $35,000 | $15.07 | 22d | 1 | 0.28mi |
| 70 Ridge Rd W Sag Harbor, NY | 3.0 | 3.0 | 2405 | $65,000 | $27.03 | 25d | 1 | 0.59mi |
| 1008 Middle Line Hwy Sag Harbor, NY | 3.0 | 3.0 | 1904 | $30,000 | $15.76 | 0d | 1 | 0.86mi |
| 47 Cliff Dr Sag Harbor, NY | 3.0 | 2.0 | 1360 | $8,000 | $5.88 | 19d | 1 | 1.13mi |
| 68 W Water St Sag Harbor, NY | 3.0 | 2.0 | 1740 | $40,000 | $22.99 | 44d | 1 | 1.16mi |
Listing history 8 events
-
2026-05-15status Pending 469-char remark
Show marketing remark (469 chars)
Just Outside of Sag Harbor Village on a Quiet Street This four-bedroom, 2.5-bathroom traditional is situated on a quiet street just outside of Sag Harbor Village. The home features a triple-height, cathedral-ceiling living room/dining room area with an abundance of natural light. Also featured are a first floor primary bedroom, a heated pool with extensive decking, a hot tub, and an attached single-car garage. All of this is situated on a beautiful one acre parcel.
-
2026-04-17price $2,295,000 469-char remark
Show marketing remark (469 chars)
Just Outside of Sag Harbor Village on a Quiet Street This four-bedroom, 2.5-bathroom traditional is situated on a quiet street just outside of Sag Harbor Village. The home features a triple-height, cathedral-ceiling living room/dining room area with an abundance of natural light. Also featured are a first floor primary bedroom, a heated pool with extensive decking, a hot tub, and an attached single-car garage. All of this is situated on a beautiful one acre parcel.
-
2025-11-24$2,495,000 Active 469-char remark
Show marketing remark (469 chars)
Just Outside of Sag Harbor Village on a Quiet Street This four-bedroom, 2.5-bathroom traditional is situated on a quiet street just outside of Sag Harbor Village. The home features a triple-height, cathedral-ceiling living room/dining room area with an abundance of natural light. Also featured are a first floor primary bedroom, a heated pool with extensive decking, a hot tub, and an attached single-car garage. All of this is situated on a beautiful one acre parcel.
-
2016-11-22soldstatus $1,070,000
-
2013-01-14soldstatus $880,000
-
1988-03-30soldstatus $85,500
-
1987-08-26soldstatus $78,000
-
1985-11-06soldstatus $53,500
ⓘ Source: listings_history table (triggers on properties + properties_extension) + one-shot
backfill from property_details.listing_events for pre-trigger history.
Tax reassessment forecast NY · Partial reset (capped growth)
- Current annual tax
- $7,112 · $593/mo
- Projected year-2 tax
- $22,949 · $1,912/mo
- Expected delta
- +$15,837/yr (+$1,320/mo · 222.7%)
ⓘ Screening estimate from a state-policy table — verify with the county assessor before closing.
Climate risk First Street
- Flood 1/10 Low FEMA zone X (unshaded) · 0% chance over 30 yrs
- Wildfire 1/10 Low
- Heat 4/10 Moderate 7 d/yr ≥90°F today · 19 d/yr by 30 yrs out
- Wind 8/10 Severe 80% chance of damaging wind over 30 yrs
- Air quality 3/10 Moderate 2 unhealthy d/yr today · 3 by 30 yrs out
Nearby sold comps map
Loading sold comps map…
Walkable amenities ~0.75 mi
Loading nearby amenities…
Taxation est. · year 1
- Rental income
- $326,599
- − Mortgage interest
- −$128,556
- − Property taxes
- −$7,112
- − Insurance
- −$11,475
- − Repairs & maintenance
- −$26,128
- − Management
- −$26,128
- − Depreciation
- −$66,764
- Taxable income
- $60,437
- Est. tax owed @ 24.0%
- −$14,505
- After-tax cash flow
- $80,499/yr
For passive investors: Depreciation is non-cash, so a rental often shows a tax loss while cash-flowing — sheltering income. Rental losses are passive: they offset passive income freely, and up to $25,000/yr can offset ordinary (W-2) income if you actively participate and your MAGI is under $100k (phasing out to $0 by $150k); unused losses carry forward. On sale, claimed depreciation is recaptured at up to 25%, and gains may owe capital-gains tax (a 1031 exchange can defer both). Figures are a year-1 estimate at your 24.0% rate — not tax advice; consult a CPA.
Schools (NCES district)
- District
- Sag Harbor Union Free School District
- NCES district ID
- 3625380
- Math proficiency
- 54% ▼ -13.00%
- Reading proficiency
- 70% ▲ 7.00%
- Median HH income
- $81,547
- Composite
- 55.69/100
- National rank
- #1222
- State rank
- #175 of 590 in NY
Livability — Noyack
- Score
- 57/100
- State rank
- #1084
- US rank
- #21915
Category grades
Schools grade is shown separately in the Schools card above.
Census & demographics
- Census place
- Noyack, NY
- County
- Suffolk County · 679,920 people
- City population
- 8,114
- Metro
- New York-Newark-Jersey City, NY-NJ-PA
- Population (ZIP)
- 8,390
- Household income
- $127,746
- Rent vs Own
- Severe rent burden
- 95.0
Population outlook (Suffolk County) Hauer SSP2
- Today (2025)
- 1,505,262 people
- By 2030
- 1,498,318 · -0.5%
- By 2040
- 1,471,101 · -2.3%
- By 2050
- 1,424,848 · -5.3%
- By 2075
- 1,337,157 · -11.2%
- By 2100
- 1,217,720 · -19.1%
Race, ethnicity, and origin ACS 2023
- Neighborhood character
- Predominantly White (78%)
- Race & ethnicity
- White 78% Hispanic / Latino 13% Two or more races 11% Asian 4% Black 2%
- Hispanic origin (detail)
- Mexican 8%
- Common ancestry
- Scotch-Irish 4% Romanian 3% Italian 2%
- Foreign-born
- 13% · Canada, China, Jamaica
- Languages at home
- 81% English-only · Spanish 9% Other Indo-European 5% French/Haitian/Cajun 2%
Political lean MEDSL · Suffolk
- 2024 margin
- Lean R (+10.0) · D 45.0% · R 55.0%
- 2008→2024 swing
- -16.0pp toward R · 2008: 6.0pp · 2024: -10.0pp
- All cycles
- 2024: R+10.0 2020: R+0.0 2016: R+8.2 2012: D+2.9 2008: D+6.0
Not yet ingested
- Civics
- —
Market trends
- HPI YoY
- ▲ 9.19%
- Current HPI
- 499.3304
- Rent YoY
- ▲ 10.76%
- Metro
- New York-Newark-Jersey City, NY-NJ-PA
- State GDP YoY
- ▲ 2.60%
- F500 in state
- 92
Industry mix (Fortune 500 HQ in NY)
| Industry | F500 HQs | Revenue |
|---|---|---|
| Financial Services | 10 | $950B |
|
||
| Consumer Goods | 9 | $162B |
|
||
| Insurance | 4 | $225B |
|
||
| Telecommunications | 2 | $144B |
|
||
| Pharmaceuticals | 2 | $112B |
|
||
| Media / Entertainment | 2 | $69B |
|
||
Price history
+4189.7% since first listed8 events — show timeline
- 2026-05-15 Pending — OneKey® MLS as Distributed by MLS Grid
- 2026-04-17 Price Changed $2,295,000 OneKey® MLS as Distributed by MLS Grid
- 2025-11-24 Listed $2,495,000 OneKey® MLS as Distributed by MLS Grid
- 2016-11-22 Sold (Public Records) $1,070,000 Public Records
- 2013-01-14 Sold (Public Records) $880,000 Public Records
- 1988-03-30 Sold (Public Records) $85,500 Public Records
- 1987-08-26 Sold (Public Records) $78,000 Public Records
- 1985-11-06 Sold (Public Records) $53,500 Public Records
Property tax history
+1.8%/yrLatest (2022): $7,112 · +0.0% YoY. Source: county tax records.
Cash-flow waterfall
monthlySold comps — $/sqft
last 12 mo · ≤1 miLoading sold comps…