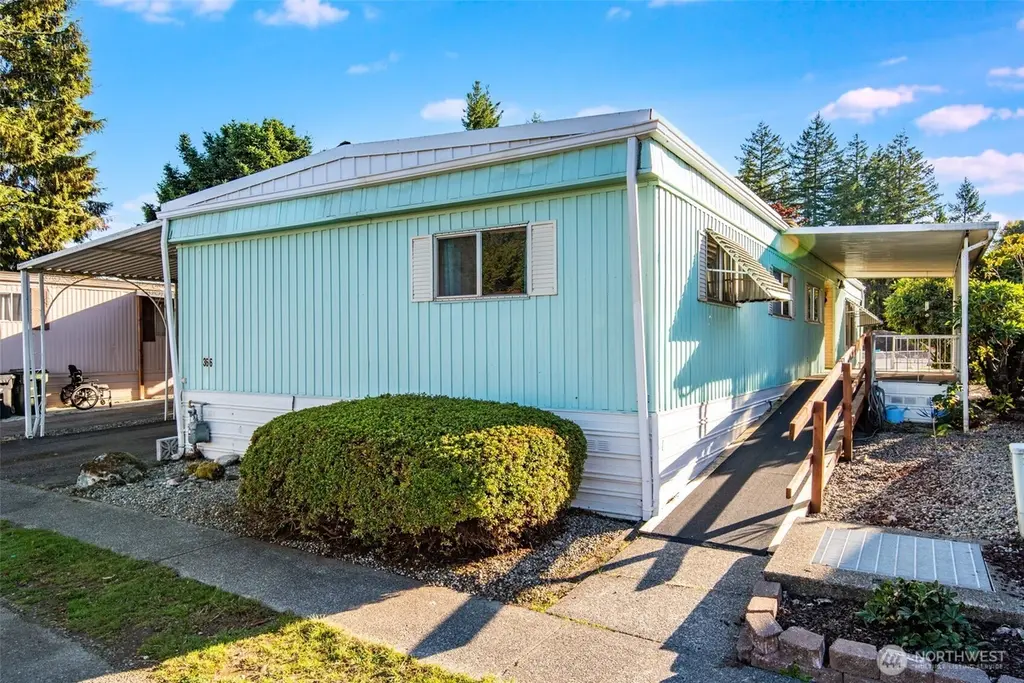
1111 Archwood Dr SW #366 · Olympia, WA
Flood risk No data
- FEMA flood zone
- —
- Chance of flooding over 30 yrs
- —
- Est. flood insurance / yr
- —
Fire risk No data
- Est. fire insurance / yr
- —
Heat risk No data
- Hot days now (above threshold)
- —
- Hot days in 30 yrs
- —
Wind risk No data
- Chance of severe wind over 30 yrs
- —
Air-quality risk No data
- Unhealthy air days now
- —
- Unhealthy air days in 30 yrs
- —
Risk factors via First Street. Map © Google.
Why this score? — see what drove the C grade
The composite is a weighted blend of 9 inputs, each scored 0–100. Each bar is that input's sub-score; the figure is the points it added to the 100-point composite (weight × sub-score).
- Cash flow +15.0/30.0
- Appreciation +10.0/10.0
- ARV discount +7.5/15.0
- Schools +6.2/10.0
- 1% rule +5.0/10.0
- DSCR +5.0/10.0
- Livability +4.2/5.0
- Rent growth +3.3/5.0
- Condition / age +2.5/5.0
$24,000
🖨 Deal sheet (PDF) 📄 Offer letter ✓ Due diligence
Listing remarks
Discover relaxed, easy living in this inviting 3-bedroom home located in a friendly 55+ community! Inside, you’ll find a spacious living room, formal dining & adorable kitchen w/ all appliances incl. Primary Ste offers a walk-in closet, dual vanity & walk-in shower while 2 add'l bedrms & guest bathrm w/ shower-tub combo provide comfort and flexibility for guests. A separate den/office adds even more versatility! Step outside to enjoy low-maintenance living with a semi-enclosed cov patio, walk-up ramp, and easy-care yard. Covered parking for 3 vehicles & shed. Steps away from Clubhouse w/ pickleball court, billiards, jacuzzi, sauna, activities & more; plu
Key facts
- Easy-care yard
- Semi-enclosed patio
- Walk-in closet
Tags
Neighborhood map
What this means for you Summary
Snapshot
- This is a 3-bed/2.0-bath manufactured listed at $24k.
Deal economics
- At list price, monthly cash flow is $2k ($19k/yr) — positive.
- The deal already cash-flows at list — no discount required.
- Meets the 1% rule at list price ($2k rent vs $24k).
- Recommended offer: $21k (12.0% below list) — sets the bar for market timing.
- Cap rate 83.5% vs local median 2.4% in Olympia — top-decile yield for the area; either an underpriced asset or a hidden risk that comps aren't pricing in. Stress-test before assuming the spread holds.
Location & tenants
- Location reads 83/100 on livability (#58 in WA, #1,036 nationally) — a professional / high-income tenant draw. Strengths: amenities A+, commute A+, health & safety A+; Watch: crime F, cost of living D-.
- Olympia School District (urban): math 66% / reading 75% proficiency, ranked #17 of 291 in WA (top 6%) — strong family-tenant draw, lease renewals of 3-5y typical.
- Market conditions: Rents rising (+3.2%/yr); 304 active listings in the ZIP; 23 comparable units currently listed for rent nearby; rentals at typical pace (median 15d on market — plan ~3-4 weeks tenant-placement turnaround); solid renter incomes; 1,222 units permitted in Thurston County in 2024 (508 in 5+ unit buildings).
Forward outlook
- In year one you build about $3k of equity ($166 loan paydown + $2k appreciation (10.0% local appreciation)).
- Thurston County population projected at +27% by 2050 — long-run rental-demand tailwind backs the buy-and-hold thesis.
- At projected returns (10.0% appreciation + 3.2% rent growth), your $7k cash investment doubles in ~1 year — after that, you're playing with house money.
- By year 10, paydown + projected appreciation supports a ~$31k cash-out refi (75% LTV) — recoverable capital for the next deal without selling this one.
Negotiation context
- It's been on market 246 days — a 12% lower offer ($21k) is reasonable based on typical stale-listing flexibility.
- 2 sale attempts since 21y ago; this cycle's ask has dropped $26k (52%) from the opening price — seller is motivated, your offer sets the floor, not the list.
- Current owner paid $18k; 37% above their basis — modest negotiation headroom, anchor on the comps not their cost.
Questions for the listing agent
- It's been on market 246 days. Have you received any prior offers? Is the seller open to a 12% concession, seller financing, or rate buy-down credit?
- Built in 1972 — when were the roof, HVAC, electrical panel, plumbing, and water heater last replaced?
- Why hasn't it sold? Are there any deal-killer items the seller is aware of (foundation, flood, title, zoning, code violations)?
- Is there a deadline driving the sale (1031 exchange, divorce, estate, relocation)? That informs how much negotiation room exists.
- Schools are A-rated — typically a magnet for longer-tenancy family renters. What's the average tenant stay here, and is there a school-zone premium baked into asking?
- Crime grade is F in this area — have there been break-ins, vandalism, or insurance claims at this property in the last 3 years? What carrier currently insures it and at what premium?
- What's the average days-on-market for RENTAL listings here right now (not sales)? A rising rental-DOM trend means longer vacancies and softer asking-rent achievability than the comps imply.
- What's the recent tenant-quality profile in this submarket — average credit score on applications, eviction rate, late-payment / NSF rate, and stable-employment percentage? A property-management company in the area should have these aggregated.
- How much new for-sale + rental construction is in the pipeline within 1–3 miles? Heavy new supply typically softens prices + rents 12–24 months out; constrained supply supports both.
Investment metrics
- 1% rule
- 9.05% ✓
- Cap rate
- 83.51%
- Cash-on-cash
- 275.79%
- DSCR
- 13.27
- GRM
- 0.9
CMA / ARV
- ARV (median comp)
- $79,479
- List price
- $24,000
- Delta
- -69.80%
- Verdict
- UNDERPRICED
- Comps
- 11 within 1.0 mi
Show comp detail 12 sales within ~0.75 mi
| Address | Dist | Beds/Ba | Sqft | Sold | Price | $/sf | Match |
|---|---|---|---|---|---|---|---|
| 1111 Archwood Dr SW #285 | 0.17mi | 2/2.0 (-1) | 1,431 (-1%) | 1mo | $105,000 | $73 | 85 |
| 1111 Archwood Dr SW #327 | 0.14mi | 3/2.0 | 1,404 (-2%) | 8mo | $215,000 | $153 | 83 |
| 1111 Archwood Dr SW #418 | 0.09mi | 3/2.0 | 1,344 (-7%) | 2mo | $22,000 | $16 | 83 |
| 1111 Archwood Dr SW #204 | 0.18mi | 2/2.0 (-1) | 1,440 (0%) | 7mo | $95,000 | $66 | 81 |
| 1111 Archwood Dr SW #200 | 0.16mi | 2/2.0 (-1) | 1,344 (-7%) | 1mo | $60,000 | $45 | 76 |
| 1111 Archwood Dr SW #306 | 0.16mi | 3/2.0 | 1,568 (+9%) | 4mo | $75,000 | $48 | 74 |
| 1111 Archwood Dr SW #429 | 0.19mi | 3/2.0 | 1,528 (+6%) | 10mo | $75,000 | $49 | 72 |
| 1111 Archwood Dr SW #242 | 0.19mi | 3/2.0 | 1,372 (-5%) | 16mo | $145,950 | $106 | 70 |
| 1111 Archwood Dr SW #263 | 0.15mi | 2/2.0 (-1) | 1,320 (-8%) | 7mo | $85,000 | $64 | 68 |
| 1111 Archwood Dr SW #202 | 0.17mi | 3/2.0 | 1,568 (+9%) | 14mo | $110,000 | $70 | 65 |
| 1111 Archwood Dr SW #213 | 0.25mi | 3/2.0 | 1,568 (+9%) | 14mo | $150,000 | $96 | 62 |
| 1111 Archwood Dr SW #447 | 0.17mi | 3/2.0 | 1,248 (-13%) | 11mo | $79,500 | $64 | 61 |
Match score weights: distance 35% · size 25% · config 20% · recency 20%. Top-matched comps best support the ARV.
Projected returns pro-forma
10.0% appreciation · 3.16% rent growth · sell at horizon
- IRR
- —
- Equity multiple
- 17.64×
- Total profit
- $111,822
- Equity at exit
- $21,621
- IRR
- —
- Equity multiple
- 38.61×
- Total profit
- $252,734
- Equity at exit
- $46,627
Cash invested: $6,720 (down + closing). Projections, not guarantees.
Landlord ↔ Tenant lean methodology
- Overall (STATE)
- 28 Tenant-Leaning
- State Washington
- 28 Tenant-Leaning · D+8
- County
- — inherits STATE
- City
- — inherits STATE
ZIP-level market 98502
- Home prices YoY
- 1.8%
- Rents YoY
- 3.2%
- Active inventory
- 304
- Price-to-rent
- 0.9×
Monthly cashflow live
- Estimated rent
- $2,173 high interval (Pro) →
- Mortgage (P&I)
- −$126
- Tax from tax record
- −$36 /mo · $435/yr
- Insurance
- −$10
- HOA
- −$0
- Vacancy / Maint / Mgmt
- −$456
- Net cashflow
- $1,544
Break-even live
Sensitivity live
| Price | -10% $1,558 | -5% $1,551 | +0% $1,544 | +5% $1,538 | +10% $1,531 |
|---|---|---|---|---|---|
| Rent | -10% $1,373 | -5% $1,459 | +0% $1,544 | +5% $1,630 | +10% $1,716 |
| Rate | -1.0pp $1,556 | -0.5pp $1,551 | base $1,544 | +0.5pp $1,538 | +1.0pp $1,532 |
UW: 25.0% down · 7.5% · 30yr · 1.5% tax · 5.0% vac · 8.0% maint · 8.0% mgmt
Financing live
Cash to close
- Down payment
- $6,000
- Closing costs
- $720
- Reserves months
- —
- Total cash needed
- —
Loan-product check · same deal, 3 products live
Conventional
25% down · 7.5% · 30yr
- Down + closing
- —
- Monthly P&I
- —
- Monthly cashflow
- —
- DSCR
- —
- Eligible?
- —
Personal DTI + credit; lowest rate.
DSCR
20% down · 8.5% · 30yr
- Down + closing
- —
- Monthly P&I
- —
- Monthly cashflow
- —
- DSCR
- —
- Eligible?
- —
No personal income docs; deal must DSCR.
Hard money
10% down · 12.0% · 12mo
- Down + closing
- —
- Monthly P&I
- —
- Monthly cashflow
- —
- DSCR
- —
- Eligible?
- —
Short-term bridge; refi at stabilization.
Rent comps 23 comps
| Address | Beds | Baths | Sqft | Rent | $/sqft | DOM | Units | Dist |
|---|---|---|---|---|---|---|---|---|
| 3311 6th Ave SW Olympia, WA | 1.0–3.0 | 1.0–2.0 | 888 | $2,470 | $2.78 | 14d | 16 | 0.30mi |
| 800 Yauger Way SW Olympia, WA | 1.0–2.0 | 1.0–2.0 | 1034 | $2,131 | $2.06 | 14d | 13 | 0.39mi |
| 1309 Fern St SW Olympia, WA | 1.0–3.0 | 1.0–2.0 | 802 | $2,206 | $2.75 | 14d | 2 | 0.54mi |
| 1900 Black Lake Blvd SW Olympia, WA | 1.0–3.0 | 1.0–2.0 | 925 | $2,137 | $2.31 | 14d | 13 | 0.55mi |
| 1220 Fern St SW Olympia, WA | 2.0 | 2.0 | 900 | $1,850 | $2.06 | 44d | 2 | 0.65mi |
| 1000 Fern St SW Olympia, WA | 1.0–2.0 | 1.0–2.0 | 892 | $2,281 | $2.56 | 14d | 8 | 0.71mi |
| 2010 8th Ct SW Olympia, WA | 2.0 | 2.0 | 1072 | $2,295 | $2.14 | 22d | 1 | 0.77mi |
| 2800 Limited Ln NW Olympia, WA | 1.0–2.0 | 1.0–2.0 | 775 | $1,503 | $1.94 | 14d | 4 | 0.83mi |
| 600 Black Lake Blvd SW Olympia, WA | 1.0–2.0 | 1.0 | 851 | $1,600 | $1.88 | 14d | 23 | 0.86mi |
| 300 Kenyon St NW Olympia, WA | 1.0–2.0 | 1.0–2.0 | 878 | $1,995 | $2.27 | 14d | 6 | 0.89mi |
| 4611 Greenwood Dr SW Olympia, WA | 3.0 | 3.0 | 1448 | $2,495 | $1.72 | 44d | 1 | 1.00mi |
| 121 Decatur St NW Olympia, WA | 2.0 | 1.0 | 1000 | $1,695 | $1.70 | 22d | 1 | 1.06mi |
| 125 Decatur St NW Olympia, WA | 2.0 | 1.0 | 980 | $1,900 | $1.94 | 22d | 1 | 1.07mi |
| 2137 Conger Ave NW Unit A Olympia, WA | 3.0 | 2.0 | 1248 | $1,995 | $1.60 | 44d | 1 | 1.19mi |
| 2137 Conger Ave NW Unit C Olympia, WA | 3.0 | 2.0 | 1248 | $1,895 | $1.52 | 44d | 1 | 1.19mi |
| 1221 Evergreen Park Dr SW Olympia, WA | 2.0 | 1.0 | 880 | $1,749 | $1.99 | 14d | 2 | 1.20mi |
| 1415 Evergreen Park Dr SW Olympia, WA | 2.0 | 2.0 | 1050 | $1,735 | $1.65 | 14d | 1 | 1.24mi |
| 1626 Madison Ave NW Olympia, WA | 2.0 | 2.0 | 1064 | $2,100 | $1.97 | 14d | 1 | 1.30mi |
| 2820 Tuscany Ln SW Unit 714 Tumwater, WA | 2.0 | 2.0 | 1030 | $1,725 | $1.67 | 22d | 1 | 1.38mi |
| 2820 Tuscany Ln SW Tumwater, WA | 1.0–2.0 | 1.0–2.0 | 915 | $1,775 | $1.94 | 14d | 8 | 1.38mi |
| 2820 Tuscany Ln SW Unit 411 Tumwater, WA | 2.0 | 1.0 | 915 | $1,635 | $1.79 | 44d | 1 | 1.38mi |
| 5004 4th Way SW Olympia, WA | 2.0–3.0 | 2.0–2.5 | 1271 | $2,645 | $2.08 | 14d | 5 | 1.38mi |
| 1221 Mottman Rd SW Olympia, WA | 1.0–3.0 | 1.0–2.0 | 1011 | $2,195 | $2.17 | 22d | 4 | 1.41mi |
Listing history 21 events
-
2026-06-18days on market $24,000 Active 246 DOM
-
2026-06-17days on market $24,000 Active 245 DOM
-
2026-06-16days on market $24,000 Active 244 DOM
-
2026-06-15days on market $24,000 Active 243 DOM
-
2026-06-14days on market $24,000 Active 241 DOM
-
2026-06-13days on market $24,000 Active 240 DOM
-
2026-06-10days on market $24,000 Active 238 DOM
-
2026-06-09days on market $24,000 Active 237 DOM
-
2026-06-08days on market $24,000 Active 236 DOM
-
2026-06-07days on market $24,000 Active 235 DOM
-
2026-06-05days on market $24,000 Active 232 DOM
-
2026-06-02days on market $24,000 Active 230 DOM
-
2026-06-01days on market $24,000 Active 229 DOM
-
2026-05-31days on market $24,000 Active 228 DOM
-
2026-05-30days on market $24,000 Active 227 DOM
-
2026-04-24price $24,000
-
2026-02-23price $27,800
-
2025-12-03price $39,900
-
2025-10-15$49,900 Active
-
2005-09-30soldstatus $17,500
-
2005-05-31$17,500
ⓘ Source: listings_history table (triggers on properties + properties_extension) + one-shot
backfill from property_details.listing_events for pre-trigger history.
Tax reassessment forecast WA · Resets to sale price
- Current annual tax
- $435 · $36/mo
- Projected year-2 tax
- $435 · $36/mo
- Expected delta
- $0/yr ($0/mo · -0.0%)
ⓘ Screening estimate from a state-policy table — verify with the county assessor before closing.
Nearby sold comps map
Loading sold comps map…
Walkable amenities ~0.75 mi
Loading nearby amenities…
Taxation est. · year 1
- Rental income
- $26,074
- − Mortgage interest
- −$1,344
- − Property taxes
- −$435
- − Insurance
- −$120
- − Repairs & maintenance
- −$2,086
- − Management
- −$2,086
- − Depreciation
- −$698
- Taxable income
- $19,304
- Est. tax owed @ 24.0%
- −$4,633
- After-tax cash flow
- $13,900/yr
For passive investors: Depreciation is non-cash, so a rental often shows a tax loss while cash-flowing — sheltering income. Rental losses are passive: they offset passive income freely, and up to $25,000/yr can offset ordinary (W-2) income if you actively participate and your MAGI is under $100k (phasing out to $0 by $150k); unused losses carry forward. On sale, claimed depreciation is recaptured at up to 25%, and gains may owe capital-gains tax (a 1031 exchange can defer both). Figures are a year-1 estimate at your 24.0% rate — not tax advice; consult a CPA.
Schools (NCES district)
- District
- Olympia School District
- NCES district ID
- 5306180
- Math proficiency
- 66% ▼ -2.00%
- Reading proficiency
- 75% ▼ -2.00%
- Median HH income
- $63,852
- Composite
- 62.27/100
- National rank
- #1438
- State rank
- #17 of 291 in WA
Livability — Olympia
- Score
- 83/100
- State rank
- #58
- US rank
- #1036
Category grades
Schools grade is shown separately in the Schools card above.
Census & demographics
- Census place
- Olympia, WA
- County
- Thurston County · 269,345 people
- City population
- 98,428
- Metro
- Olympia-Lacey-Tumwater, WA
- Population (ZIP)
- 35,398
- Household income
- $92,207
- Rent vs Own
- Severe rent burden
- 1811.0
Population outlook (Thurston County) Hauer SSP2
- Today (2025)
- 308,239 people
- By 2030
- 326,483 · +5.9%
- By 2040
- 359,890 · +16.8%
- By 2050
- 391,800 · +27.1%
- By 2075
- 468,024 · +51.8%
- By 2100
- 519,890 · +68.7%
Race, ethnicity, and origin ACS 2023
- Neighborhood character
- Predominantly White (71%)
- Race & ethnicity
- White 71% Two or more races 13% Hispanic / Latino 11% Asian 6% Black 3% Native American 1%
- Hispanic origin (detail)
- Mexican 3% Puerto Rican 4%
- Common ancestry
- Italian 5% Portuguese 4% Iranian 3%
- Foreign-born
- 8% · Vietnam, Canada, China
- Languages at home
- 90% English-only · Spanish 3% Vietnamese 2% Other Asian/Pacific 1%
Political lean MEDSL · Thurston
- 2024 margin
- Strong D (+20.4) · D 58.5% · R 38.1% · Other 3.5%
- 2008→2024 swing
- -1.3pp toward R · 2008: 21.7pp · 2024: 20.4pp
- All cycles
- 2024: D+20.4 2020: D+18.6 2016: D+15.4 2012: D+19.0 2008: D+21.7
Not yet ingested
- Civics
- —
Market trends
- HPI YoY
- ▲ 18.49%
- Current HPI
- 1056.49
- Rent YoY
- ▲ 3.16%
- Metro
- Olympia-Lacey-Tumwater, WA
- State GDP YoY
- ▲ 4.65%
- F500 in state
- 22
Industry mix (Fortune 500 HQ in WA)
| Industry | F500 HQs | Revenue |
|---|---|---|
| Retail | 2 | $269B |
|
||
| Technology / Retail | 1 | $638B |
|
||
| Technology | 1 | $245B |
|
||
| Telecommunications | 1 | $38B |
|
||
| Food / Beverage | 1 | $36B |
|
||
| Automotive / Trucks | 1 | $34B |
|
||
Price history
+37.1% since first listed6 events — show timeline
- 2026-04-24 Price Changed $24,000 NWMLS as Distributed by MLS Grid
- 2026-02-23 Price Changed $27,800 NWMLS as Distributed by MLS Grid
- 2025-12-03 Price Changed $39,900 NWMLS as Distributed by MLS Grid
- 2025-10-15 Listed $49,900 NWMLS as Distributed by MLS Grid
- 2005-09-30 Sold (MLS) $17,500 NWMLS as Distributed by MLS Grid
- 2005-05-31 Listed $17,500 NWMLS as Distributed by MLS Grid
Property tax history
+5.2%/yrLatest (2026): $435 · +9.8% YoY. Source: county tax records.
Cash-flow waterfall
monthlySold comps — $/sqft
last 12 mo · ≤1 miLoading sold comps…