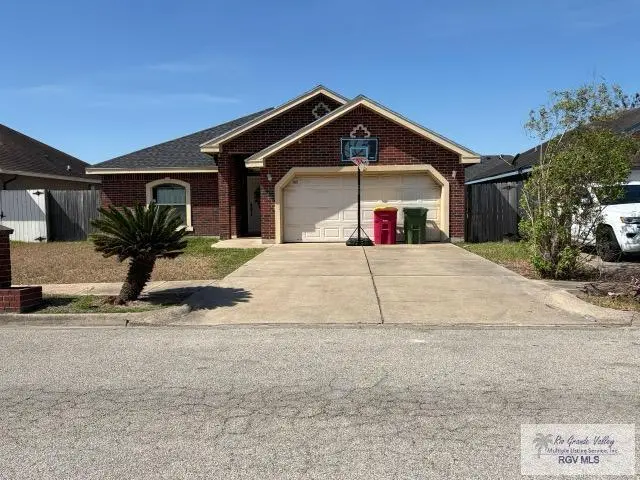
6705 Georgia Pne · Brownsville, TX
Flood risk 1/10 · Minimal
- FEMA flood zone
- X (unshaded)
- Chance of flooding over 30 yrs
- 0.0%
- Est. flood insurance / yr
- $507 – $1,088
Fire risk 5/10 · Moderate
- Est. fire insurance / yr
- $1,222 – $2,270
Heat risk 9/10 · Severe
- Hot days now (above 111°F)
- 7 days/yr
- Hot days in 30 yrs
- 25 days/yr
Wind risk 9/10 · Severe
- Chance of severe wind over 30 yrs
- 99.0%
Air-quality risk 2/10 · Minimal
- Unhealthy air days now
- 1 days/yr
- Unhealthy air days in 30 yrs
- 1 days/yr
Risk factors via First Street. Map © Google.
Why this score? — see what drove the D grade
The composite is a weighted blend of 9 inputs, each scored 0–100. Each bar is that input's sub-score; the figure is the points it added to the 100-point composite (weight × sub-score).
- Cash flow +11.9/30.0
- ARV discount +9.0/15.0
- Livability +4.0/5.0
- 1% rule +3.5/10.0
- DSCR +3.5/10.0
- Schools +3.3/10.0
- Rent growth +3.2/5.0
- Condition / age +2.5/5.0
- Appreciation +0.0/10.0
$235,000
🖨 Deal sheet (PDF) 📄 Offer letter ✓ Due diligence
Listing remarks
NEW ROOF Beautiful single-story brick home located at 6705 Georgia Pine in Brownsville, TX 78526. This well-maintained residence features 3 bedrooms, 2 bathrooms, and a 2-car garage, offering a functional open layout perfect for comfortable living. Spacious driveway, fenced backyard, and great curb appeal. Conveniently located near schools, shopping, and major roadways. Priced at $235,000 — an excellent opportunity for homeowners or investors alike. Schedule your private showing today!
Key facts
- Great curb appeal
- Spacious driveway
- Fenced backyard
Tags
Property features AI
Finance
- Other: Subdivision: VILLA LOS PINOS
- HOA & community: Homeowners association with annual fee
Exterior
- Parking: Attached 2-car garage
- Utilities: Public water; Public sewer; Cable available
- Home design: Single-family residence; One story; Residential property
- Construction: Brick veneer construction; Slab foundation; Built with composition roof
- Exterior features: Composition roof
Interior
- Flooring: Tile
- Bathrooms: 2 full bathrooms
- Heating & cooling: Central heating (electric); Central air; Ceiling fans
- Interior features: Bay windows; Tile flooring; Electric water heater
Neighborhood map
What this means for you Summary
Snapshot
- This is a 3-bed/2.0-bath single-family listed at $235k.
Deal economics
- At list price, monthly cash flow is $-60 ($-721/yr) — negative.
- To cash-flow at today's rent, offer at most $224k (4.5% below list).
- To meet the 1% rule (rent ≥ 1% of price), the offer needs to be $200k (14.8% below list).
- Recommended offer: $200k (14.8% below list) — sets the bar for 1% rule.
- Cap rate 6.0% vs local median 5.0% in Brownsville — meaningfully above typical; check what's discounted (condition, days-on-market, listing class) to confirm the premium yield is real.
Location & tenants
- Location reads 79/100 on livability (#62 in TX, #2,311 nationally) — a middle-class / working-renter tenant base. Strengths: commute A+, cost of living A+, housing A+; Watch: amenities D, crime D-, employment F.
- Los Fresnos CISD (suburban): math 34% / reading 44% proficiency, ranked #444 of 826 in TX (top 54%) — families likely to look elsewhere, expect single-tenant / working-renter base with shorter leases.
- Zoned schools: Los Fresnos El (math 37% / reading 47%, grade F, #1,335 of 4,322 statewide, top 33%, 561 students, 76% FRL); Resaca Middle (math 29% / reading 44%, grade F, #786 of 1,662 statewide, top 48%, 857 students, 77% FRL); Los Fresnos H S (math 41% / reading 55%, grade D, #571 of 1,632 statewide, top 36%, 3,272 students, 82% FRL) — zoned schools average 78% FRL vs 43% district-wide (35 pts higher); higher-poverty schools than district average — tighter screening recommended.
- Market conditions: Rents rising (+2.8%/yr); 416 active listings in the ZIP; 13 comparable units currently listed for rent nearby; rentals at typical pace (median 23d on market — plan ~3-4 weeks tenant-placement turnaround); 2,326 units permitted in Cameron County in 2024 (503 in 5+ unit buildings).
- This rent runs 34% of the median local income ($71k/yr) — at the standard rent-burdened threshold; future hikes will face affordability resistance.
Forward outlook
- Local home prices are declining (-3.0%/yr); year-one equity from $2k of loan paydown is wiped out by about $7k of value loss. Plan a longer hold.
- Cameron County population projected at +3% by 2050 — modest demand growth; plan on rents tracking national, not racing it.
Negotiation context
- It's been on market 19 days — a 2% lower offer ($231k) is reasonable based on typical stale-listing flexibility.
Risks & watch-outs
- Climate carrying-cost: severe wind risk, 99% chance of damaging wind over 30y; moderate wildfire risk; extreme-heat days projected 7→25/yr by 2055 (HVAC capex compounding) — expect insurance premiums to compound above CPI over the hold.
Questions for the listing agent
- What do current leases actually rent for vs. the listed asking? Can we see a recent rent roll and the last 12 months of T-12 income?
- Is there a deadline driving the sale (1031 exchange, divorce, estate, relocation)? That informs how much negotiation room exists.
- Crime grade is D in this area — have there been break-ins, vandalism, or insurance claims at this property in the last 3 years? What carrier currently insures it and at what premium?
- The area grade is low — what's the realistic commute time and amenity access for the typical tenant pool here? Any planned neighborhood developments (good or bad) we should know about?
- What's the average days-on-market for RENTAL listings here right now (not sales)? A rising rental-DOM trend means longer vacancies and softer asking-rent achievability than the comps imply.
- What's the recent tenant-quality profile in this submarket — average credit score on applications, eviction rate, late-payment / NSF rate, and stable-employment percentage? A property-management company in the area should have these aggregated.
- How much new for-sale + rental construction is in the pipeline within 1–3 miles? Heavy new supply typically softens prices + rents 12–24 months out; constrained supply supports both.
Investment metrics
- 1% rule
- 0.85% ✗
- Cap rate
- 5.99%
- Cash-on-cash
- -1.10%
- DSCR
- 0.95
- GRM
- 9.8
CMA / ARV
- ARV (median comp)
- $243,212
- List price
- $235,000
- Delta
- -3.38%
- Verdict
- FAIR
- Comps
- 9 within 1.0 mi
Show comp detail 1 sale within ~0.75 mi
| Address | Dist | Beds/Ba | Sqft | Sold | Price | $/sf | Match |
|---|---|---|---|---|---|---|---|
| 6633 Carolina Pne | 0.18mi | 3/2.0 | 1,200 (-11%) | 8mo | $197,000 | $164 | 67 |
Match score weights: distance 35% · size 25% · config 20% · recency 20%. Top-matched comps best support the ARV.
Projected returns pro-forma
-3.0% appreciation · 2.77% rent growth · sell at horizon
- IRR
- -18.3%
- Equity multiple
- 0.36×
- Total profit
- $-42,326
- Equity at exit
- $35,039
- IRR
- -11.1%
- Equity multiple
- 0.34×
- Total profit
- $-43,503
- Equity at exit
- $20,319
Cash invested: $65,800 (down + closing). Projections, not guarantees.
Landlord ↔ Tenant lean methodology
- Overall (STATE)
- 87 Strongly Landlord-Friendly
- State Texas
- 87 Strongly Landlord-Friendly · R+5
- County
- — inherits STATE
- City
- — inherits STATE
ZIP-level market 78526
- Home prices YoY
- -12.1%
- Rents YoY
- 2.8%
- Active inventory
- 416
- Price-to-rent
- 9.8×
Monthly cashflow live
- Estimated rent
- $2,003 high interval (Pro) →
- Mortgage (P&I)
- −$1,232
- Tax from tax record
- −$312 /mo · $3,747/yr
- Insurance
- −$98
- HOA
- −$0
- Vacancy / Maint / Mgmt
- −$421
- Net cashflow
- $-60
Break-even live
Sensitivity live
| Price | -10% $73 | -5% $6 | +0% $-60 | +5% $-127 | +10% $-193 |
|---|---|---|---|---|---|
| Rent | -10% $-218 | -5% $-139 | +0% $-60 | +5% $19 | +10% $98 |
| Rate | -1.0pp $58 | -0.5pp $0 | base $-60 | +0.5pp $-121 | +1.0pp $-183 |
UW: 25.0% down · 7.5% · 30yr · 1.5% tax · 5.0% vac · 8.0% maint · 8.0% mgmt
Financing live
Cash to close
- Down payment
- $58,750
- Closing costs
- $7,050
- Reserves months
- —
- Total cash needed
- —
Loan-product check · same deal, 3 products live
Conventional
25% down · 7.5% · 30yr
- Down + closing
- —
- Monthly P&I
- —
- Monthly cashflow
- —
- DSCR
- —
- Eligible?
- —
Personal DTI + credit; lowest rate.
DSCR
20% down · 8.5% · 30yr
- Down + closing
- —
- Monthly P&I
- —
- Monthly cashflow
- —
- DSCR
- —
- Eligible?
- —
No personal income docs; deal must DSCR.
Hard money
10% down · 12.0% · 12mo
- Down + closing
- —
- Monthly P&I
- —
- Monthly cashflow
- —
- DSCR
- —
- Eligible?
- —
Short-term bridge; refi at stabilization.
Rent comps 13 comps
| Address | Beds | Baths | Sqft | Rent | $/sqft | DOM | Units | Dist |
|---|---|---|---|---|---|---|---|---|
| 6992 Austrian Pne Brownsville, TX | 3.0 | 2.0 | 1201 | $1,900 | $1.58 | 23d | 1 | 0.12mi |
| 6973 Austrian Pne Brownsville, TX | 4.0 | 2.0 | 1406 | $1,800 | $1.28 | 45d | 1 | 0.14mi |
| 6654 Pino Azul Brownsville, TX | 3.0 | 2.0 | 1433 | $1,900 | $1.33 | 45d | 1 | 0.20mi |
| 7029 Austrian Pne Brownsville, TX | 3.0 | 2.0 | 1676 | $2,000 | $1.19 | 23d | 1 | 0.21mi |
| 7137 Calles Ave Olmito, TX | 2.0 | 1.5 | 1025 | $1,400 | $1.37 | 15d | 1 | 0.33mi |
| 6919 Blue Spruce St Brownsville, TX | 3.0 | 2.0 | 1451 | $1,750 | $1.21 | 45d | 1 | 0.44mi |
| 1930 Castillo St Olmito, TX | 3.0 | 2.0 | 1628 | $2,400 | $1.47 | 23d | 1 | 0.83mi |
| 1930 Castellano Cir Brownsville, TX | 3.0 | 2.0 | 1572 | $2,400 | $1.53 | 45d | 1 | 0.83mi |
| 2153 Grove Ln Brownsville, TX | 3.0 | 2.0 | 1846 | $1,950 | $1.06 | 23d | 1 | 1.07mi |
| 2373 Grove Ln Brownsville, TX | 3.0 | 2.0 | 1473 | $2,500 | $1.70 | 23d | 1 | 1.07mi |
| 2161 Grove Ln Brownsville, TX | 3.0 | 2.0 | 1150 | $2,050 | $1.78 | 45d | 1 | 1.09mi |
| 6283 Pecos River St Brownsville, TX | 2.0 | 1.0 | 1000 | $1,200 | $1.20 | 15d | 1 | 1.14mi |
| 6053 Blanco River St Brownsville, TX | 2.0 | 2.0 | 1088 | $1,550 | $1.42 | 15d | 1 | 1.22mi |
Listing history 4 events
-
2026-05-01$235,000 Active 496-char remark
-
2026-03-27price $245,000
-
2010-06-28soldstatus
-
2007-07-23soldstatus
ⓘ Source: listings_history table (triggers on properties + properties_extension) + one-shot
backfill from property_details.listing_events for pre-trigger history.
Tax reassessment forecast TX · Resets to sale price
- Current annual tax
- $3,747 · $312/mo
- Projected year-2 tax
- $4,300 · $358/mo
- Expected delta
- +$553/yr (+$46/mo · 14.8%)
ⓘ Screening estimate from a state-policy table — verify with the county assessor before closing.
Climate risk First Street
- Flood 1/10 Low FEMA zone X (unshaded) · 0% chance over 30 yrs
- Wildfire 5/10 Major
- Heat 9/10 Extreme 7 d/yr ≥111°F today · 25 d/yr by 30 yrs out
- Wind 9/10 Extreme 99% chance of damaging wind over 30 yrs
- Air quality 2/10 Low 1 unhealthy d/yr today · 1 by 30 yrs out
Nearby sold comps map
Loading sold comps map…
Walkable amenities ~0.75 mi
Loading nearby amenities…
Taxation est. · year 1
- Rental income
- $24,038
- − Mortgage interest
- −$13,164
- − Property taxes
- −$3,747
- − Insurance
- −$1,175
- − Repairs & maintenance
- −$1,923
- − Management
- −$1,923
- − Depreciation
- −$6,836
- Taxable loss
- −$4,730
- Est. tax savings @ 24.0%
- +$1,135
- After-tax cash flow
- $415/yr
For passive investors: Depreciation is non-cash, so a rental often shows a tax loss while cash-flowing — sheltering income. Rental losses are passive: they offset passive income freely, and up to $25,000/yr can offset ordinary (W-2) income if you actively participate and your MAGI is under $100k (phasing out to $0 by $150k); unused losses carry forward. On sale, claimed depreciation is recaptured at up to 25%, and gains may owe capital-gains tax (a 1031 exchange can defer both). Figures are a year-1 estimate at your 24.0% rate — not tax advice; consult a CPA.
Schools (NCES district)
- District
- Los Fresnos CISD
- NCES district ID
- 4828290
- Math proficiency
- 34% ▼ -30.00%
- Reading proficiency
- 44% ▼ -10.00%
- Median HH income
- $42,586
- Composite
- 32.92/100
- National rank
- #5601
- State rank
- #444 of 826 in TX
Livability — Brownsville
- Score
- 79/100
- State rank
- #62
- US rank
- #2311
Category grades
Schools grade is shown separately in the Schools card above.
Census & demographics
- Census place
- Brownsville, TX
- County
- Cameron County · 310,734 people
- City population
- 212,132
- Metro
- Brownsville-Harlingen, TX
- Population (ZIP)
- 60,012
- Household income
- $70,565
- Rent vs Own
- Severe rent burden
- 1063.0
Population outlook (Cameron County) Hauer SSP2
- Today (2025)
- 441,603 people
- By 2030
- 448,113 · +1.5%
- By 2040
- 456,385 · +3.3%
- By 2050
- 456,294 · +3.3%
- By 2075
- 423,851 · -4.0%
- By 2100
- 342,787 · -22.4%
Race, ethnicity, and origin ACS 2023
- Neighborhood character
- Predominantly Hispanic (93%)
- Race & ethnicity
- Hispanic / Latino 93% Two or more races 45% White 4% Asian 2%
- Hispanic origin (detail)
- Mexican 87%
- Foreign-born
- 25% · Canada, Vietnam
- Languages at home
- 19% English-only · Spanish 79% Tagalog/Filipino 1%
Political lean MEDSL · Cameron
- 2024 margin
- Lean R (+5.8) · D 46.7% · R 52.5%
- 2008→2024 swing
- -34.6pp toward R · 2008: 28.8pp · 2024: -5.8pp
- All cycles
- 2024: R+5.8 2020: D+13.2 2016: D+32.5 2012: D+32.4 2008: D+28.8
Not yet ingested
- Civics
- —
Market trends
- HPI YoY
- ▼ -30.28%
- Current HPI
- 220.5233
- Rent YoY
- ▲ 2.77%
- Metro
- Brownsville-Harlingen, TX
- State GDP YoY
- ▲ 3.95%
- F500 in state
- 110
Industry mix (Fortune 500 HQ in TX)
| Industry | F500 HQs | Revenue |
|---|---|---|
| Energy | 16 | $1,198B |
|
||
| Technology | 5 | $198B |
|
||
| Engineering / Construction | 4 | $72B |
|
||
| Energy Services | 3 | $60B |
|
||
| Utilities | 3 | $41B |
|
||
| Healthcare | 2 | $330B |
|
||
Price history
-4.1% since first listed7 events — show timeline
- 2026-06-03 Sold (MLS) — RGVMLS
- 2026-06-02 Sold (Public Records) — Public Records
- 2026-05-20 Pending — RGVMLS
- 2026-05-01 Listed $235,000 RGVMLS
- 2026-03-27 Price Changed $245,000 RGVMLS
- 2010-06-28 Sold (Public Records) — Public Records
- 2007-07-23 Sold (Public Records) — Public Records
Property tax history
+3.9%/yrLatest (2025): $3,747 · +9.7% YoY. Source: county tax records.
Cash-flow waterfall
monthlySold comps — $/sqft
last 12 mo · ≤1 miLoading sold comps…