 🏷️ Likely Rental
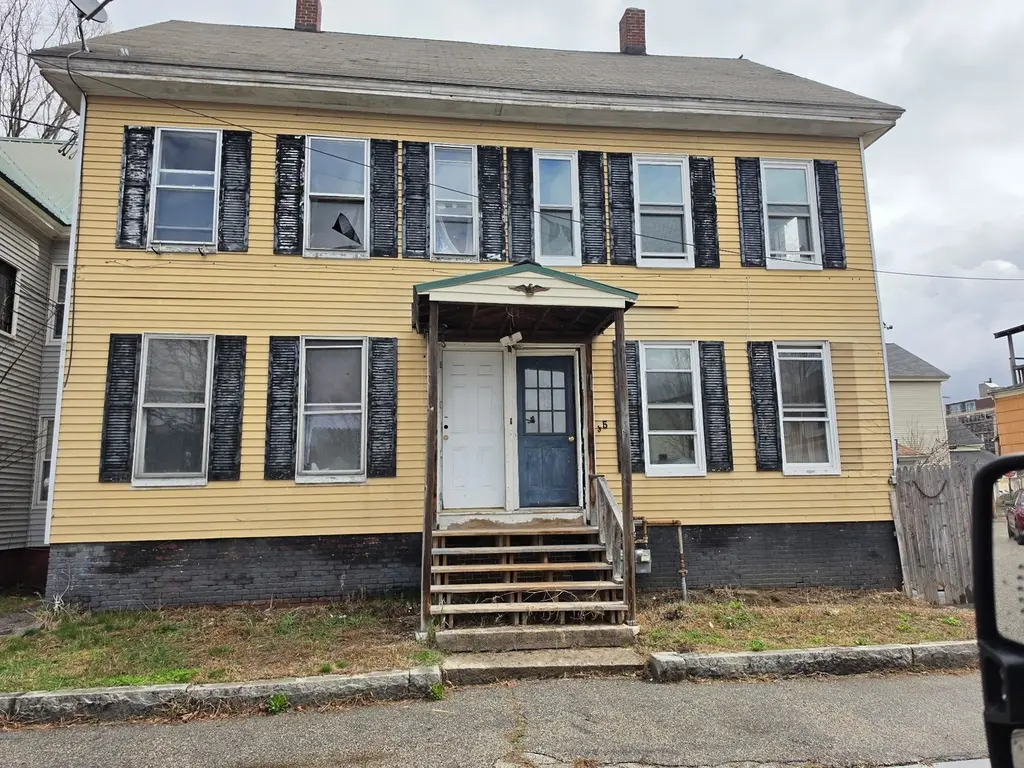
33-35 Chesley St · Concord, NH
Flood risk 1/10 · Minimal
- FEMA flood zone
- X (unshaded)
- Chance of flooding over 30 yrs
- 0.0%
- Est. flood insurance / yr
- $473 – $860
Fire risk 1/10 · Minimal
- Est. fire insurance / yr
- $507 – $941
Heat risk 3/10 · Minor
- Hot days now (above 94°F)
- 7 days/yr
- Hot days in 30 yrs
- 16 days/yr
Wind risk 4/10 · Minor
- Chance of severe wind over 30 yrs
- 15.0%
Air-quality risk 2/10 · Minimal
- Unhealthy air days now
- 1 days/yr
- Unhealthy air days in 30 yrs
- 1 days/yr
Risk factors via First Street. Map © Google.
Why this score? — see what drove the B- grade
The composite is a weighted blend of 9 inputs, each scored 0–100. Each bar is that input's sub-score; the figure is the points it added to the 100-point composite (weight × sub-score).
- Cash flow +30.0/30.0
- 1% rule +10.0/10.0
- DSCR +10.0/10.0
- ARV discount +7.5/15.0
- Livability +4.5/5.0
- Rent growth +3.4/5.0
- Schools +3.2/10.0
- Condition / age +1.0/5.0
- Appreciation +0.0/10.0
$225,000
🖨 Deal sheet 📄 Offer letter ✓ Due diligence
Multi-family units
County records classify this as Multi-Family (2-4 Unit). Listing-text estimate: 2 units. confirmed
Listing remarks
5 bedroom, 2 family in need of full gut renovation. The house needs about $150,000 in renovation so the project is not for the faint of heart. Though currently not very pretty, the bones are good and there are lots and lots of sweat equity to be had. Rents in this area are between $2500/$2800 per month per side. I have estimates for all work required, the project is just too far for me to properly manage. If the property does not sell in the first 60 days, I will remove it from the market, complete all the renovations and put it back on the market at $599,900
Key facts
- 3,920 sq ft lot
- Built 1900
- Listed 2 days
Neighborhood map
What this means for you Summary
Snapshot
- This is a 2 × 2-bed/?-bath units multifamily listed at $225k. Condition is rated poor.
Deal economics
- At list price, monthly cash flow is $2k ($18k/yr) — positive. Per door: $771/mo.
- The deal already cash-flows at list — no discount required.
- Meets the 1% rule at list price ($4k rent vs $225k).
- Cap rate 14.5% vs local median 2.0% in Concord — top-decile yield for the area; either an underpriced asset or a hidden risk that comps aren't pricing in. Stress-test before assuming the spread holds.
Location & tenants
- Location reads 91/100 on livability (#2 in NH, #60 nationally) — a professional / high-income tenant draw. Strengths: amenities A+, commute A+, housing A+.
- Concord School District (town): math 27% / reading 47% proficiency, ranked #71 of 98 in NH (top 72%) — families likely to look elsewhere, expect single-tenant / working-renter base with shorter leases.
- Market conditions: Rents rising (+3.7%/yr); 89 active listings in the ZIP; solid renter incomes; 380 units permitted in Merrimack County in 2024 (28 in 5+ unit buildings).
- At $4,290/mo this rent would consume 59% of the median local household income ($87k/yr) (locally 1312% of renters already pay >50% of income on rent) — very limited rent-growth headroom before tenants either downsize or default.
Forward outlook
- Local home prices are declining (-3.0%/yr); year-one equity from $2k of loan paydown is wiped out by about $7k of value loss. Plan a longer hold.
- Merrimack County population projected to shrink 5% by 2050 — rents likely to lag national; underwrite the cash flow, not the appreciation.
- At projected returns (-3.0% appreciation + 3.7% rent growth), your $63k cash investment doubles in ~4 years — after that, you're playing with house money.
Negotiation context
- Only 2 days on market — expect competitive offers; lowballing is unlikely to land.
Risks & watch-outs
- Watch-outs: property tax is 3.1% of price; built in 1900 — expect roof / HVAC / electrical / plumbing capex.
Questions for the listing agent
- Can we see the unit-by-unit rent roll, current vacancy, and any below-market leases? What's the average tenancy length?
- What capital expenditures (roof, boiler, parking lot, exteriors) have been made in the last 5 years, and what's planned in the next 2?
- Have any recent inspections been done? Can we get a copy of the seller's disclosures and any deferred-maintenance estimates?
- Built in 1900 — when were the roof, HVAC, electrical panel, plumbing, and water heater last replaced?
- Property tax is high relative to price — has the assessment been appealed recently, and will the sale trigger a re-assessment?
- Is there a deadline driving the sale (1031 exchange, divorce, estate, relocation)? That informs how much negotiation room exists.
- What's the average days-on-market for RENTAL listings here right now (not sales)? A rising rental-DOM trend means longer vacancies and softer asking-rent achievability than the comps imply.
- What's the recent tenant-quality profile in this submarket — average credit score on applications, eviction rate, late-payment / NSF rate, and stable-employment percentage? A property-management company in the area should have these aggregated.
- How much new apartment / multifamily construction is in the pipeline within 1–3 miles? Heavy new supply (>2% of stock underway) typically softens rents 12–24 months out; light construction supports rent growth.
Investment metrics
- 1% rule
- 1.91% ✓
- Cap rate
- 14.52%
- Cash-on-cash
- 29.37%
- DSCR
- 2.31
- GRM
- 4.4
CMA / ARV
- ARV (on-the-fly)
- $501,280
- Comps found
- 10
Show comp detail 10 sales within ~0.75 mi
| Address | Dist | Beds/Ba | Sqft | Sold | Price | $/sf | Match |
|---|---|---|---|---|---|---|---|
| 17-19 Thompson St | 0.09mi | 4/2.0 (-1) | 2,622 (+9%) | 1mo | $522,000 | $199 | 75 |
| 27 Laurel St | 0.31mi | 4/2.0 (-1) | 2,217 (-8%) | 17mo | $474,900 | $214 | 53 |
| 75 S State St | 0.31mi | 4/2.0 (-1) | 2,754 (+14%) | 7mo | $430,000 | $156 | 51 |
| 11 Washington St | 0.66mi | 4/3.0 (-1) | 2,454 (+2%) | 7mo | $511,000 | $208 | 51 |
| 13 Clinton St | 0.59mi | 4/2.0 (-1) | 2,132 (-12%) | 0mo | $570,000 | $267 | 48 |
| 13-15 Lyndon St | 0.65mi | 4/2.0 (-1) | 2,397 (-0%) | 19mo | $400,000 | $167 | 48 |
| 5 Essex St | 0.46mi | 4/2.0 (-1) | 2,542 (+6%) | 22mo | $492,500 | $194 | 46 |
| 16-18 Laurel St | 0.27mi | 6/2.0 (+1) | 2,133 (-12%) | 22mo | $505,000 | $237 | 46 |
| 50 N Spring St | 0.32mi | 5/4.0 | 2,761 (+15%) | 18mo | $550,000 | $199 | 38 |
| 25 Pine St | 0.48mi | 4/2.0 (-1) | 2,052 (-15%) | 24mo | $480,000 | $234 | 28 |
Match score weights: distance 35% · size 25% · config 20% · recency 20%. Top-matched comps best support the ARV.
Projected returns pro-forma
-3.0% appreciation · 3.71% rent growth · sell at horizon
- IRR
- 24.8%
- Equity multiple
- 2.03×
- Total profit
- $65,061
- Equity at exit
- $33,548
- IRR
- 33.1%
- Equity multiple
- 4.13×
- Total profit
- $196,931
- Equity at exit
- $19,454
Cash invested: $63,000 (down + closing). Projections, not guarantees.
Landlord ↔ Tenant lean methodology
- Overall (STATE)
- 56 Moderately Landlord-Leaning
- State New Hampshire
- 56 Moderately Landlord-Leaning · D+1
- County
- — inherits STATE
- City
- — inherits STATE
ZIP-level market 03301
- Home prices YoY
- -30.6%
- Rents YoY
- 3.7%
- Active inventory
- 89
- Price-to-rent
- 8.7×
Monthly cashflow live
- Estimated rent
- $4,290 high interval (Pro) →
- Mortgage (P&I)
- −$1,180
- Tax from tax record
- −$574 /mo · $6,885/yr
- Insurance
- −$94
- HOA
- −$0
- Vacancy / Maint / Mgmt
- −$901
- Net cashflow
- $1,542
Break-even live
2-unit breakdown (identical units grouped — click to expand)
| Units | Beds | Baths | Est. rent |
|---|---|---|---|
| 2× units | 2 | — | $4,290 |
| #1 | 2 | — | $2,145 |
| #2 | 2 | — | $2,145 |
| Total (2 units) | $4,290 | ||
UW: 25.0% down · 7.5% · 30yr · 1.5% tax · 5.0% vac · 8.0% maint · 8.0% mgmt
Financing live
Cash to close
- Down payment
- $56,250
- Closing costs
- $6,750
- Reserves months
- —
- Total cash needed
- —
Loan-product check · same deal, 3 products live
Conventional
25% down · 7.5% · 30yr
- Down + closing
- —
- Monthly P&I
- —
- Monthly cashflow
- —
- DSCR
- —
- Eligible?
- —
Personal DTI + credit; lowest rate.
DSCR
20% down · 8.5% · 30yr
- Down + closing
- —
- Monthly P&I
- —
- Monthly cashflow
- —
- DSCR
- —
- Eligible?
- —
No personal income docs; deal must DSCR.
Hard money
10% down · 12.0% · 12mo
- Down + closing
- —
- Monthly P&I
- —
- Monthly cashflow
- —
- DSCR
- —
- Eligible?
- —
Short-term bridge; refi at stabilization.
Listing history 2 events
-
2026-04-24status Pending
-
2026-04-22$225,000 Active
ⓘ Source: listings_history table (triggers on properties + properties_extension) + one-shot
backfill from property_details.listing_events for pre-trigger history.
Tax reassessment forecast NH · Partial reset (capped growth)
- Current annual tax
- $6,885 · $574/mo
- Projected year-2 tax
- $6,885 · $574/mo
- Expected delta
- $0/yr ($0/mo · 0.0%)
ⓘ Screening estimate from a state-policy table — verify with the county assessor before closing.
Climate risk First Street
- Flood 1/10 Low FEMA zone X (unshaded) · 0% chance over 30 yrs
- Wildfire 1/10 Low
- Heat 3/10 Moderate 7 d/yr ≥94°F today · 16 d/yr by 30 yrs out
- Wind 4/10 Moderate 15% chance of damaging wind over 30 yrs
- Air quality 2/10 Low 1 unhealthy d/yr today · 1 by 30 yrs out
Nearby sold comps map
Loading sold comps map…
Walkable amenities ~0.75 mi
Loading nearby amenities…
Taxation est. · year 1
- Rental income
- $51,480
- − Mortgage interest
- −$12,603
- − Property taxes
- −$6,885
- − Insurance
- −$1,125
- − Repairs & maintenance
- −$4,118
- − Management
- −$4,118
- − Depreciation
- −$6,545
- Taxable income
- $16,084
- Est. tax owed @ 24.0%
- −$3,860
- After-tax cash flow
- $14,640/yr
For passive investors: Depreciation is non-cash, so a rental often shows a tax loss while cash-flowing — sheltering income. Rental losses are passive: they offset passive income freely, and up to $25,000/yr can offset ordinary (W-2) income if you actively participate and your MAGI is under $100k (phasing out to $0 by $150k); unused losses carry forward. On sale, claimed depreciation is recaptured at up to 25%, and gains may owe capital-gains tax (a 1031 exchange can defer both). Figures are a year-1 estimate at your 24.0% rate — not tax advice; consult a CPA.
Condition & rehab AI · 5 photos
This multi-family property requires a full gut renovation with extensive repairs and updates to the exterior and interior. The project is estimated to cost approximately $150,000 and will significantly increase its resale and rental value.
Repairs flagged
- Major exterior siding — Severe damage and peeling
- Major interior walls — Exposed walls and missing trim
- Major kitchen cabinets — Damaged and missing countertops
- Major bathroom walls — Exposed walls and missing trim
- Major flooring — Damaged hardwood flooring
Value-add opportunities
- Both exterior siding repair — Improves curb appeal and structural integrity
- Both interior wall repair — Enhances interior appearance and structural stability
- Both kitchen cabinet replacement — Modernizes kitchen and increases functionality
- Both bathroom renovation — Enhances bathroom functionality and appearance
- Both flooring replacement — Improves comfort and aesthetics
Renovation cost estimate screening
| Repair item | Severity | Est. cost |
|---|---|---|
| exterior siding · Severe damage and peeling | Major | $15,000–50,000 |
| interior walls · Exposed walls and missing trim | Major | $15,000–50,000 |
| kitchen cabinets · Damaged and missing countertops | Major | $15,000–50,000 |
| bathroom walls · Exposed walls and missing trim | Major | $15,000–50,000 |
| flooring · Damaged hardwood flooring | Major | $15,000–50,000 |
| Total estimated repair cost · 5 items | $75,000–250,000 |
Value-add ROI direction
- Both exterior siding repair — Improves curb appeal and structural integrity ↑
- Both interior wall repair — Enhances interior appearance and structural stability ↑
- Both kitchen cabinet replacement — Modernizes kitchen and increases functionality ↑
- Both bathroom renovation — Enhances bathroom functionality and appearance ↑
- Both flooring replacement — Improves comfort and aesthetics ↑
ⓘ Cost ranges are severity-bucket heuristics (US national rule-of-thumb). Get contractor quotes + a written scope before underwriting a rehab budget.
Schools (NCES district)
- District
- Concord School District
- NCES district ID
- 3302460
- Math proficiency
- 27% ▼ -21.00%
- Reading proficiency
- 47% ▼ -12.00%
- Median HH income
- $55,419
- Composite
- 32.45/100
- National rank
- #5719
- State rank
- #71 of 98 in NH
Livability — Concord
- Score
- 91/100
- State rank
- #2
- US rank
- #60
Category grades
Schools grade is shown separately in the Schools card above.
Census & demographics
- Census place
- Concord, NH
- County
- Merrimack County · 65,598 people
- City population
- 33,995
- Metro
- Concord, NH
- Population (ZIP)
- 33,995
- Household income
- $86,840
- Rent vs Own
- Severe rent burden
- 1312.0
Population outlook (Merrimack County) Hauer SSP2
- Today (2025)
- 151,287 people
- By 2030
- 151,867 · +0.4%
- By 2040
- 149,927 · -0.9%
- By 2050
- 144,081 · -4.8%
- By 2075
- 132,018 · -12.7%
- By 2100
- 111,733 · -26.1%
Race, ethnicity, and origin ACS 2023
- Neighborhood character
- Predominantly White (85%)
- Race & ethnicity
- White 85% Two or more races 5% Black 4% Hispanic / Latino 4% Asian 4%
- Common ancestry
- Lithuanian 12% Romanian 3% Slovak 3%
- Foreign-born
- 9% · Canada, India
- Languages at home
- 90% English-only · Spanish 2% Other Indo-European 2% French/Haitian/Cajun 1%
Political lean MEDSL · Merrimack
- 2024 margin
- Lean D (+5.2) · D 52.1% · R 46.9% · Other 1.0%
- 2008→2024 swing
- -8.7pp toward R · 2008: 13.9pp · 2024: 5.2pp
- All cycles
- 2024: D+5.2 2020: D+9.8 2016: D+3.1 2012: D+12.7 2008: D+13.9
Not yet ingested
- Civics
- —
Market trends
- HPI YoY
- ▼ -161.92%
- Current HPI
- 367.965
- Rent YoY
- ▲ 3.71%
- Metro
- Concord, NH
- State GDP YoY
- —
- F500 in state
- 0
Price history
2 events — show timeline
- 2026-04-24 Pending — PrimeMLS
- 2026-04-22 Listed $225,000 PrimeMLS
Cash-flow waterfall
monthlySold comps — $/sqft
last 12 mo · ≤1 miLoading sold comps…