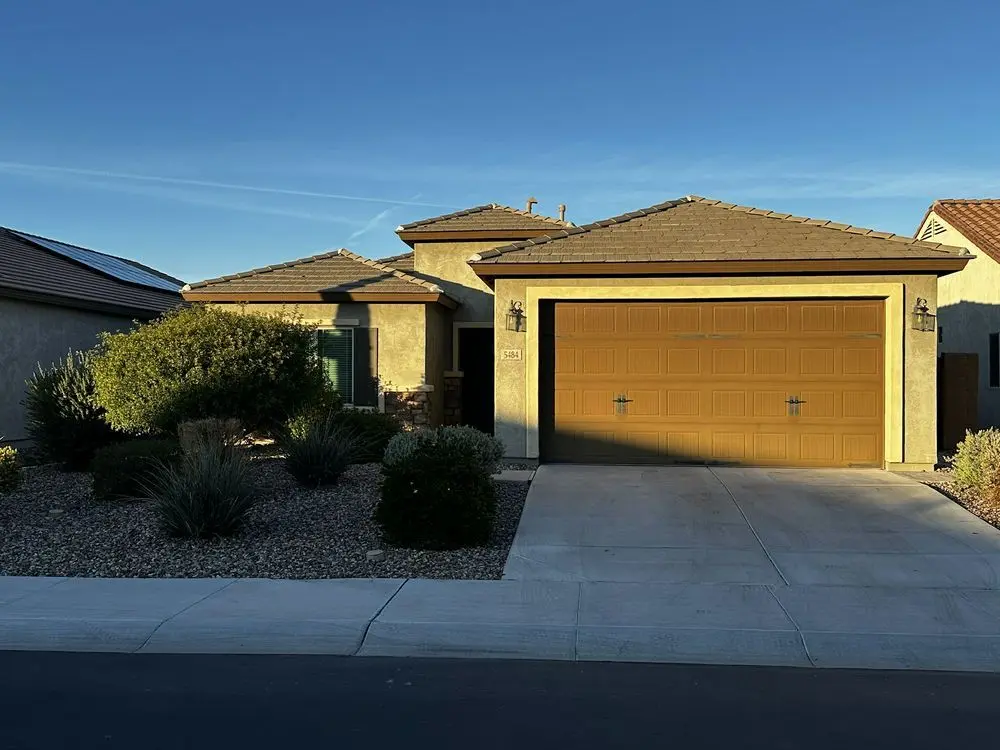
5484 W Heritage Way · Florence, AZ
Flood risk 1/10 · Minimal
- FEMA flood zone
- X (unshaded)
- Chance of flooding over 30 yrs
- 0.0%
- Est. flood insurance / yr
- $507 – $1,088
Fire risk 6/10 · Moderate
- Est. fire insurance / yr
- $610 – $1,132
Heat risk 9/10 · Severe
- Hot days now (above 112°F)
- 6 days/yr
- Hot days in 30 yrs
- 16 days/yr
Wind risk 1/10 · Minimal
- Chance of severe wind over 30 yrs
- —
Air-quality risk 1/10 · Minimal
- Unhealthy air days now
- 0 days/yr
- Unhealthy air days in 30 yrs
- 0 days/yr
Risk factors via First Street. Map © Google.
Why this score? — see what drove the D grade
The composite is a weighted blend of 9 inputs, each scored 0–100. Each bar is that input's sub-score; the figure is the points it added to the 100-point composite (weight × sub-score).
- ARV discount +13.1/15.0
- Cash flow +12.0/30.0
- DSCR +3.5/10.0
- Livability +3.0/5.0
- Rent growth +2.8/5.0
- 1% rule +2.7/10.0
- Condition / age +2.5/5.0
- Schools +1.8/10.0
- Appreciation +0.0/10.0
$329,900
🖨 Deal sheet (PDF) 📄 Offer letter ✓ Due diligence
Listing remarks MLS
Anthem Merrill Ranch community. Has a assumable 5.5% $318,5000 Mortgage. Monthly payment $2,107 (PIT & I). Come's with most all furniture.
Key facts
- 5,947 sq ft lot
- Built 2019
- Listed 196 days
Neighborhood map
What this means for you Summary
Snapshot
- This is a 3-bed/2.0-bath single-family listed at $330k.
Deal economics
- At list price, monthly cash flow is $-79 ($-952/yr) — negative.
- To cash-flow at today's rent, offer at most $316k (4.3% below list).
- To meet the 1% rule (rent ≥ 1% of price), the offer needs to be $255k (22.6% below list).
- Recommended offer: $255k (22.6% below list) — sets the bar for 1% rule.
- Cap rate 6.0% vs local median 4.1% in Florence — top-decile yield for the area; either an underpriced asset or a hidden risk that comps aren't pricing in. Stress-test before assuming the spread holds.
Location & tenants
- Location reads 60/100 on livability (#187 in AZ) — a middle-class / working-renter tenant base. Strengths: crime A+, cost of living A+, housing A+; Watch: amenities F, commute F, health & safety F.
- Florence Unified School District (4437) (rural): math 16% / reading 24% proficiency, ranked #178 of 249 in AZ (top 72%) — low school quality limits family demand, transient renter base, plan for 1-2y turnover.
- Zoned schools: Florence High School (math 8% / reading 12%, grade F, #343 of 381 statewide, top 93%, 796 students, 44% FRL) — zoned schools at 44% FRL track the district average.
- Market conditions: Rents rising (+1.3%/yr); 737 active listings in the ZIP; 13 comparable units currently listed for rent nearby; rentals lingering (median 46d on market — plan ~5-8 weeks vacancy on turnover, expect pricing pressure); 77% of comp listings sitting > 30 days — soft ceiling on asking rent; solid renter incomes; 9,504 units permitted in Pinal County in 2024 (776 in 5+ unit buildings).
- This rent runs 39% of the median local income ($79k/yr) — at the standard rent-burdened threshold; future hikes will face affordability resistance.
Forward outlook
- Local home prices are declining (-3.0%/yr); year-one equity from $2k of loan paydown is wiped out by about $10k of value loss. Plan a longer hold.
Negotiation context
- It's been on market 196 days — a 12% lower offer ($290k) is reasonable based on typical stale-listing flexibility.
- 4 sale attempts with the ask held roughly flat each time — persistent listings suggest the price (not the market) is what's stuck; bring a comps-based counter.
Risks & watch-outs
- Climate carrying-cost: major wildfire risk; extreme-heat days projected 6→16/yr by 2055 (HVAC capex compounding) — expect insurance premiums to compound above CPI over the hold.
Questions for the listing agent
- What do current leases actually rent for vs. the listed asking? Can we see a recent rent roll and the last 12 months of T-12 income?
- It's been on market 196 days. Have you received any prior offers? Is the seller open to a 23% concession, seller financing, or rate buy-down credit?
- Why hasn't it sold? Are there any deal-killer items the seller is aware of (foundation, flood, title, zoning, code violations)?
- Is there a deadline driving the sale (1031 exchange, divorce, estate, relocation)? That informs how much negotiation room exists.
- Schools are F-rated, which usually means shorter tenancies and higher turnover. Who's the typical renter profile here, and what's been the actual vacancy rate?
- The area grade is low — what's the realistic commute time and amenity access for the typical tenant pool here? Any planned neighborhood developments (good or bad) we should know about?
- What's the average days-on-market for RENTAL listings here right now (not sales)? A rising rental-DOM trend means longer vacancies and softer asking-rent achievability than the comps imply.
- What's the recent tenant-quality profile in this submarket — average credit score on applications, eviction rate, late-payment / NSF rate, and stable-employment percentage? A property-management company in the area should have these aggregated.
- How much new for-sale + rental construction is in the pipeline within 1–3 miles? Heavy new supply typically softens prices + rents 12–24 months out; constrained supply supports both.
Investment metrics
- 1% rule
- 0.77% ✗
- Cap rate
- 6.00%
- Cash-on-cash
- -1.03%
- DSCR
- 0.95
- GRM
- 10.8
CMA / ARV
- ARV (median comp)
- $376,482
- List price
- $329,900
- Delta
- -12.37%
- Verdict
- UNDERPRICED
- Comps
- 20 within 1.0 mi
Show comp detail 12 sales within ~0.75 mi
| Address | Dist | Beds/Ba | Sqft | Sold | Price | $/sf | Match |
|---|---|---|---|---|---|---|---|
| 3703 N Astoria Dr | 0.17mi | 3/2.0 | 1,781 (+0%) | 2mo | $350,000 | $197 | 91 |
| 5637 W Heritage Way | 0.10mi | 3/2.0 | 1,757 (-1%) | 3mo | $330,000 | $188 | 90 |
| 3909 N Presidio Dr | 0.29mi | 3/2.0 | 1,756 (-1%) | 1mo | $315,000 | $179 | 84 |
| 3258 N San Marin Dr | 0.29mi | 3/2.0 | 1,801 (+1%) | 3mo | $350,000 | $194 | 82 |
| 5821 W Cinder Brook Way | 0.35mi | 2/2.0 (-1) | 1,864 (+5%) | 1mo | $375,000 | $201 | 70 |
| 3687 N Princeton Ct | 0.60mi | 2/2.0 (-1) | 1,817 (+2%) | 4mo | $360,000 | $198 | 60 |
| 5942 W Bushwood Way | 0.65mi | 2/2.0 (-1) | 1,832 (+3%) | 1mo | $457,000 | $249 | 59 |
| 6113 W Sandpiper Way | 0.67mi | 3/2.0 | 1,886 (+6%) | 1mo | $370,000 | $196 | 58 |
| 3544 N Emerald Creek Dr | 0.44mi | 4/2.0 (+1) | 1,965 (+10%) | 1mo | $365,000 | $186 | 56 |
| 6611 W Trenton Ct | 0.72mi | 3/2.0 | 1,627 (-9%) | 2mo | $340,000 | $209 | 50 |
| 6016 W Bushwood Way | 0.69mi | 2/2.0 (-1) | 1,671 (-6%) | 4mo | $485,000 | $290 | 50 |
| 2680 N Coronado Dr | 0.74mi | 3/2.0 | 1,998 (+12%) | 4mo | $344,990 | $173 | 42 |
Match score weights: distance 35% · size 25% · config 20% · recency 20%. Top-matched comps best support the ARV.
Projected returns pro-forma
-3.0% appreciation · 1.27% rent growth · sell at horizon
- IRR
- -19.8%
- Equity multiple
- 0.32×
- Total profit
- $-62,958
- Equity at exit
- $49,189
- IRR
- -16.6%
- Equity multiple
- 0.15×
- Total profit
- $-78,957
- Equity at exit
- $28,524
Cash invested: $92,372 (down + closing). Projections, not guarantees.
Landlord ↔ Tenant lean methodology
- Overall (STATE)
- 87 Strongly Landlord-Friendly
- State Arizona
- 87 Strongly Landlord-Friendly · R+3
- County
- — inherits STATE
- City
- — inherits STATE
ZIP-level market 85132
- Home prices YoY
- -5.2%
- Rents YoY
- 1.3%
- Active inventory
- 737
- Price-to-rent
- 10.8×
Monthly cashflow live
- Estimated rent
- $2,555 high interval (Pro) →
- Mortgage (P&I)
- −$1,730
- Tax from tax record
- −$230 /mo · $2,762/yr
- Insurance
- −$137
- HOA
- −$0
- Vacancy / Maint / Mgmt
- −$537
- Net cashflow
- $-79
Break-even live
Sensitivity live
| Price | -10% $107 | -5% $14 | +0% $-79 | +5% $-173 | +10% $-266 |
|---|---|---|---|---|---|
| Rent | -10% $-281 | -5% $-180 | +0% $-79 | +5% $22 | +10% $122 |
| Rate | -1.0pp $87 | -0.5pp $5 | base $-79 | +0.5pp $-165 | +1.0pp $-252 |
UW: 25.0% down · 7.5% · 30yr · 1.5% tax · 5.0% vac · 8.0% maint · 8.0% mgmt
Financing live
Cash to close
- Down payment
- $82,475
- Closing costs
- $9,897
- Reserves months
- —
- Total cash needed
- —
Loan-product check · same deal, 3 products live
Conventional
25% down · 7.5% · 30yr
- Down + closing
- —
- Monthly P&I
- —
- Monthly cashflow
- —
- DSCR
- —
- Eligible?
- —
Personal DTI + credit; lowest rate.
DSCR
20% down · 8.5% · 30yr
- Down + closing
- —
- Monthly P&I
- —
- Monthly cashflow
- —
- DSCR
- —
- Eligible?
- —
No personal income docs; deal must DSCR.
Hard money
10% down · 12.0% · 12mo
- Down + closing
- —
- Monthly P&I
- —
- Monthly cashflow
- —
- DSCR
- —
- Eligible?
- —
Short-term bridge; refi at stabilization.
Rent comps 13 comps
| Address | Beds | Baths | Sqft | Rent | $/sqft | DOM | Units | Dist |
|---|---|---|---|---|---|---|---|---|
| 5728 W Autumn Vista Way Florence, AZ | 3.0 | 2.0 | 2133 | $2,400 | $1.13 | 45d | 1 | 0.31mi |
| 3658 N Princeton Ct Florence, AZ | 2.0 | 2.0 | 1817 | $3,500 | $1.93 | 45d | 1 | 0.65mi |
| 2926 N Coronado Dr Florence, AZ | 3.0 | 2.0 | 1756 | $2,200 | $1.25 | 45d | 1 | 0.69mi |
| 6498 W Victory Way Florence, AZ | 3.0 | 2.0 | 2144 | $2,095 | $0.98 | 7d | 1 | 0.69mi |
| 6431 W Sandpiper Way Florence, AZ | 2.0 | 2.0 | 1817 | $3,500 | $1.93 | 45d | 1 | 0.83mi |
| 6363 W Springfield Way Florence, AZ | 3.0 | 2.0 | 1997 | $2,350 | $1.18 | 45d | 1 | 0.90mi |
| 3947 N Hidden Canyon Dr Florence, AZ | 2.0 | 2.0 | 1381 | $3,000 | $2.17 | 45d | 1 | 0.93mi |
| 6566 W Mockingbird Ct Florence, AZ | 2.0 | 2.0 | 1381 | $3,000 | $2.17 | 45d | 1 | 0.95mi |
| 6645 W Pleasant Oak Ct Florence, AZ | 4.0 | 2.0 | 2133 | $2,000 | $0.94 | 7d | 1 | 0.97mi |
| 2528 N Petersburg Dr Florence, AZ | 3.0 | 2.0 | 2002 | $2,195 | $1.10 | 45d | 1 | 1.23mi |
| 4518 N Petersburg Dr Florence, AZ | 2.0 | 2.0 | 1644 | $2,500 | $1.52 | 26d | 1 | 1.23mi |
| 7347 W Millerton Way Florence, AZ | 3.0 | 2.0 | 1449 | $1,695 | $1.17 | 45d | 1 | 1.44mi |
| 4394 N Hummingbird Dr Florence, AZ | 2.0 | 2.0 | 1586 | $3,500 | $2.21 | 45d | 1 | 1.44mi |
Listing history 33 events
-
2026-06-21days on market $329,900 Active 196 DOM
-
2026-06-18days on market $329,900 Active 193 DOM
-
2026-06-17days on market $329,900 Active 192 DOM
-
2026-06-16days on market $329,900 Active 191 DOM
-
2026-06-15days on market $329,900 Active 190 DOM
-
2026-06-13days on market $329,900 Active 188 DOM
-
2026-06-13days on market $329,900 Active 187 DOM
-
2026-06-09days on market $329,900 Active 184 DOM
-
2026-06-08days on market $329,900 Active 183 DOM
-
2026-06-07days on market $329,900 Active 182 DOM
-
2026-06-04days on market $329,900 Active 179 DOM
-
2026-06-03days on market $329,900 Active 178 DOM
-
2026-06-02days on market $329,900 Active 177 DOM
-
2026-06-01days on market $329,900 Active 176 DOM
-
2026-05-31days on market $329,900 Active 175 DOM
-
2026-04-08historical
-
2026-03-13status Active
-
2026-03-04historical Contract Contingent on Buyer Sale
-
2026-02-17price $329,900
-
2026-01-23price $339,500
-
2026-01-09$339,900 Active
-
2025-12-17price $329,900 142-char remark
Show marketing remark (142 chars)
Anthem Merrill Ranch community. Has a assumable 5.5% $318,5000 Mortgage. Monthly payment $2,107 (PIT & I). Come's with most all furniture.
-
2025-12-07$349,900 Active 142-char remark
Show marketing remark (142 chars)
Anthem Merrill Ranch community. Has a assumable 5.5% $318,5000 Mortgage. Monthly payment $2,107 (PIT & I). Come's with most all furniture.
-
2025-09-22soldstatus $318,500 Closed
-
2025-09-22soldstatus $318,500
-
2025-08-23status Pending
-
2025-08-21price $315,000
-
2025-08-07price $322,000
-
2025-07-24price $332,000
-
2025-07-10price $340,000
-
2025-06-26price $345,000
-
2025-06-16$350,000 Active
-
2025-06-06soldstatus $309,100
ⓘ Source: listings_history table (triggers on properties + properties_extension) + one-shot
backfill from property_details.listing_events for pre-trigger history.
Tax reassessment forecast AZ · Resets to sale price
- Current annual tax
- $2,762 · $230/mo
- Projected year-2 tax
- $2,762 · $230/mo
- Expected delta
- $0/yr ($0/mo · 0.0%)
ⓘ Screening estimate from a state-policy table — verify with the county assessor before closing.
Climate risk First Street
- Flood 1/10 Low FEMA zone X (unshaded) · 0% chance over 30 yrs
- Wildfire 6/10 Major
- Heat 9/10 Extreme 6 d/yr ≥112°F today · 16 d/yr by 30 yrs out
- Wind 1/10 Low
- Air quality 1/10 Low 0 unhealthy d/yr today · 0 by 30 yrs out
Nearby sold comps map
Loading sold comps map…
Walkable amenities ~0.75 mi
Loading nearby amenities…
Taxation est. · year 1
- Rental income
- $30,658
- − Mortgage interest
- −$18,480
- − Property taxes
- −$2,762
- − Insurance
- −$1,650
- − Repairs & maintenance
- −$2,453
- − Management
- −$2,453
- − Depreciation
- −$9,597
- Taxable loss
- −$6,736
- Est. tax savings @ 24.0%
- +$1,617
- After-tax cash flow
- $664/yr
For passive investors: Depreciation is non-cash, so a rental often shows a tax loss while cash-flowing — sheltering income. Rental losses are passive: they offset passive income freely, and up to $25,000/yr can offset ordinary (W-2) income if you actively participate and your MAGI is under $100k (phasing out to $0 by $150k); unused losses carry forward. On sale, claimed depreciation is recaptured at up to 25%, and gains may owe capital-gains tax (a 1031 exchange can defer both). Figures are a year-1 estimate at your 24.0% rate — not tax advice; consult a CPA.
Schools (NCES district)
- District
- Florence Unified School District (4437)
- NCES district ID
- 0402920
- Math proficiency
- 16% ▼ -11.00%
- Reading proficiency
- 24% ▼ -7.00%
- Median HH income
- $54,426
- Composite
- 18.31/100
- National rank
- #8950
- State rank
- #178 of 249 in AZ
Livability — Florence
- Score
- 60/100
- State rank
- #187
- US rank
- #19483
Category grades
Schools grade is shown separately in the Schools card above.
Census & demographics
- Census place
- Florence, AZ
- County
- Pinal County · 399,947 people
- City population
- 38,671
- Metro
- Phoenix-Mesa-Chandler, AZ
- Population (ZIP)
- 38,671
- Household income
- $79,000
- Rent vs Own
- Severe rent burden
- 102.0
Population outlook (Pinal County) Hauer SSP2
- Today (2025)
- 437,574 people
- By 2030
- 446,903 · +2.1%
- By 2040
- 452,589 · +3.4%
- By 2050
- 444,126 · +1.5%
- By 2075
- 430,300 · -1.7%
- By 2100
- 393,536 · -10.1%
Race, ethnicity, and origin ACS 2023
- Neighborhood character
- Diverse neighborhood (Simpson 0.56)
- Race & ethnicity
- White 59% Hispanic / Latino 28% Two or more races 9% Black 7% Native American 3%
- Hispanic origin (detail)
- Mexican 23%
- Common ancestry
- Italian 5% Portuguese 2% Romanian 2%
- Foreign-born
- 9% · Canada
- Languages at home
- 79% English-only · Spanish 17% German/W. Germanic 1% Russian/Polish/Slavic 1%
Political lean MEDSL · Pinal
- 2024 margin
- Strong R (+22.1) · D 38.5% · R 60.6%
- 2008→2024 swing
- -7.6pp toward R · 2008: -14.5pp · 2024: -22.1pp
- All cycles
- 2024: R+22.1 2020: R+17.3 2016: R+19.3 2012: R+17.1 2008: R+14.5
Not yet ingested
- Civics
- —
Market trends
- HPI YoY
- ▼ -12.75%
- Current HPI
- 233.6644
- Rent YoY
- ▲ 1.27%
- Metro
- Phoenix-Mesa-Chandler, AZ
- State GDP YoY
- ▲ 4.54%
- F500 in state
- 20
Industry mix (Fortune 500 HQ in AZ)
| Industry | F500 HQs | Revenue |
|---|---|---|
| Technology | 2 | $13B |
|
||
| Mining / Metals | 1 | $23B |
|
||
| Environmental Services | 1 | $16B |
|
||
| Metals / Steel | 1 | $14B |
|
||
| Technology Distribution | 1 | $9B |
|
||
| Homebuilding | 1 | $8B |
|
||
Price history
+6.7% since first listed18 events — show timeline
- 2026-04-08 Listing Removed — ARMLS
- 2026-03-13 Relisted — ARMLS
- 2026-03-04 Contingent — ARMLS
- 2026-02-17 Price Changed $329,900 ARMLS
- 2026-01-23 Price Changed $339,500 ARMLS
- 2026-01-09 Listed $339,900 ARMLS
- 2025-12-17 Price Changed $329,900 ForSaleByOwner.com
- 2025-12-07 Listed $349,900 ForSaleByOwner.com
- 2025-09-22 Sold (Public Records) $318,500 Public Records
- 2025-09-22 Sold (MLS) $318,500 ARMLS
- 2025-08-23 Pending — ARMLS
- 2025-08-21 Price Changed $315,000 ARMLS
- 2025-08-07 Price Changed $322,000 ARMLS
- 2025-07-24 Price Changed $332,000 ARMLS
- 2025-07-10 Price Changed $340,000 ARMLS
- 2025-06-26 Price Changed $345,000 ARMLS
- 2025-06-16 Listed $350,000 ARMLS
- 2025-06-06 Sold (Public Records) $309,100 Public Records
Property tax history
+29.8%/yrLatest (2025): $2,762 · +20.9% YoY. Source: county tax records.
Cash-flow waterfall
monthlySold comps — $/sqft
last 12 mo · ≤1 miLoading sold comps…