8095 Meadow Rd #235 · Dallas, TX
Flood risk 1/10 · Minimal
- FEMA flood zone
- X (unshaded)
- Chance of flooding over 30 yrs
- 0.0%
- Est. flood insurance / yr
- $507 – $1,088
Fire risk 1/10 · Minimal
- Est. fire insurance / yr
- $1,222 – $2,270
Heat risk 7/10 · Major
- Hot days now (above 109°F)
- 7 days/yr
- Hot days in 30 yrs
- 24 days/yr
Wind risk 6/10 · Moderate
- Chance of severe wind over 30 yrs
- 27.0%
Air-quality risk 3/10 · Minor
- Unhealthy air days now
- 3 days/yr
- Unhealthy air days in 30 yrs
- 3 days/yr
Risk factors via First Street. Map © Google.
Why this score? — see what drove the C- grade
The composite is a weighted blend of 9 inputs, each scored 0–100. Each bar is that input's sub-score; the figure is the points it added to the 100-point composite (weight × sub-score).
- Cash flow +17.1/30.0
- 1% rule +10.0/10.0
- ARV discount +7.5/15.0
- DSCR +5.3/10.0
- Livability +4.0/5.0
- Rent growth +3.0/5.0
- Schools +2.8/10.0
- Condition / age +2.5/5.0
- Appreciation +0.0/10.0
$99,900
🖨 Deal sheet (PDF) 📄 Offer letter ✓ Due diligence
Listing remarks
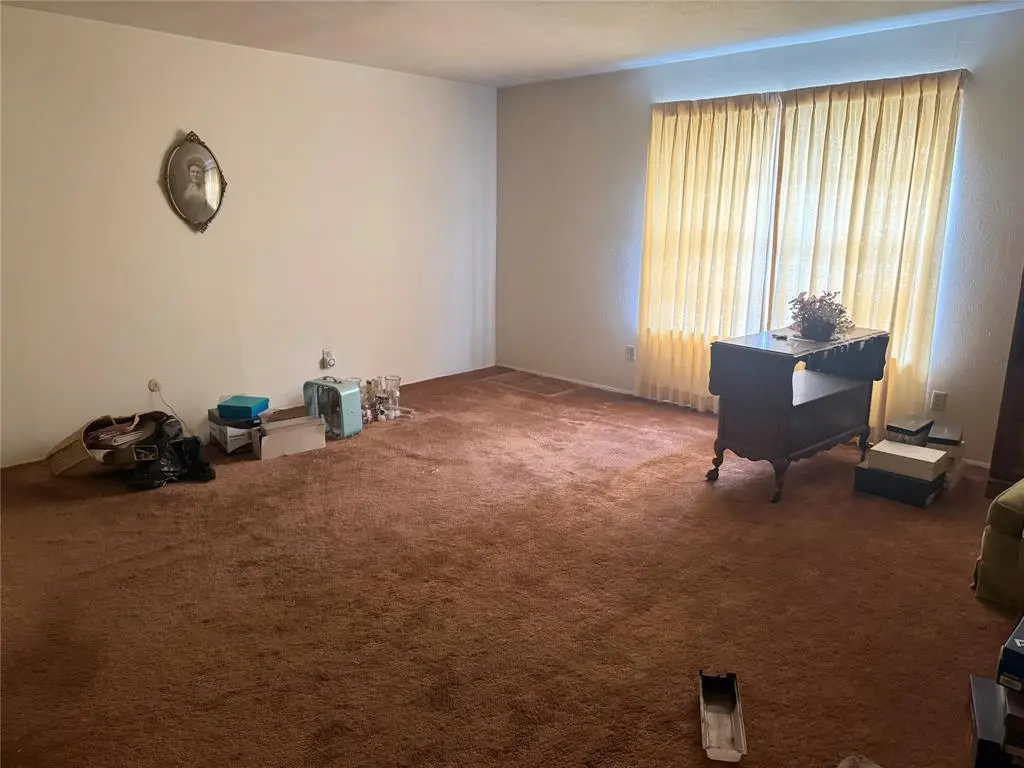
Investor special in an unbeatable location! Conveniently situated near NorthPark Center, Preston Hollow Village, popular restaurants, shopping, and major thoroughfares, this property offers incredible potential for the right buyer. Featuring one assigned parking space and a prime central location, this is a fantastic opportunity to renovate, customize, or add to your investment portfolio. Bring your vision and TLC—location is everything!
Key facts
- $424 HOA
- Garage
- Pool
Tags
Property features AI
Finance
- Other: Probate listing; Complex name: Meadows North Condo; Directions: Use GPS
- Financial info: Listing accepts cash and other terms
- HOA & community: Mandatory association; Monthly association fee includes full use of facilities, insurance, grounds maintenance, structure maintenance and management fees; HOA management: SNL & Associates
Exterior
- Parking: Assigned covered parking space; Attached 1-car garage
- Utilities: Cable available; City water; City sewer; Not in a municipal utility district
- Home design: Residential condominium; Attached property; One story; Built in 1969
- Construction: Brick construction; Composition roof; Slab foundation
- Exterior features: In-ground gunite pool; Condominium lot
Interior
- Kitchen: Dishwasher; Garbage disposal; Electric range
- Bedrooms: 2 bedrooms; Primary bedroom with walk-in closet, linen closet and medicine cabinet
- Flooring: Carpet; Laminate
- Bathrooms: 2 full bathrooms
- Heating & cooling: Central heating (electric); Central air (electric)
- Interior features: Cable TV available; High-speed internet available; Window coverings; One living area; One dining area; Total of 5 rooms; One-level layout
Neighborhood map
What this means for you Summary
Snapshot
- This is a 2-bed/2.0-bath condo listed at $100k.
Deal economics
- At list price, monthly cash flow is $70 ($845/yr) — positive.
- The deal already cash-flows at list — no discount required.
- Meets the 1% rule at list price ($2k rent vs $100k).
- Recommended offer: $98k (1.5% below list) — sets the bar for market timing.
- Cap rate 7.1% vs local median 2.3% in Dallas — top-decile yield for the area; either an underpriced asset or a hidden risk that comps aren't pricing in. Stress-test before assuming the spread holds.
Location & tenants
- Location reads 81/100 on livability (#24 in TX, #1,380 nationally) — a professional / high-income tenant draw. Strengths: amenities A+, commute A+, housing A+; Watch: crime F.
- Dallas ISD (urban): math 31% / reading 36% proficiency, ranked #559 of 826 in TX (top 68%) — families likely to look elsewhere, expect single-tenant / working-renter base with shorter leases; 83% free/reduced lunch — lower-income household profile, screen leases tightly.
- Zoned schools: Arthur Kramer El (math 37% / reading 47%, grade F, #1,335 of 4,322 statewide, top 33%, 454 students, 68% FRL); Benjamin Franklin International Exploratory Acad (math 26% / reading 32%, grade F, #1,103 of 1,662 statewide, top 67%, 878 students, 86% FRL); Hillcrest H S (math 28% / reading 44%, grade F, #930 of 1,632 statewide, top 57%, 1,610 students, 74% FRL).
- Market conditions: Rents rising (+2.0%/yr); 214 active listings in the ZIP; 40 comparable units currently listed for rent nearby; rentals at typical pace (median 17d on market — plan ~3-4 weeks tenant-placement turnaround); 12,577 units permitted in Dallas County in 2024 (6,829 in 5+ unit buildings).
- This rent runs 37% of the median local income ($59k/yr) — at the standard rent-burdened threshold; future hikes will face affordability resistance.
Forward outlook
- Local home prices are declining (-3.0%/yr); year-one equity from $691 of loan paydown is wiped out by about $3k of value loss. Plan a longer hold.
- Dallas County population projected at +35% by 2050 — long-run rental-demand tailwind backs the buy-and-hold thesis.
Negotiation context
- It's been on market 17 days — a 2% lower offer ($98k) is reasonable based on typical stale-listing flexibility.
Risks & watch-outs
- Watch-outs: property tax is 4.2% of price; HOA is 24% of rent.
- Climate carrying-cost: major wind risk, 27% chance of damaging wind over 30y; extreme-heat days projected 7→24/yr by 2055 (HVAC capex compounding) — expect insurance premiums to compound above CPI over the hold.
Questions for the listing agent
- Built in 1969 — when were the roof, HVAC, electrical panel, plumbing, and water heater last replaced?
- Property tax is high relative to price — has the assessment been appealed recently, and will the sale trigger a re-assessment?
- What does the HOA fee cover, when was the last increase, and are there any pending special assessments or reserve-fund shortfalls?
- Any open or pending special assessments — roof, HVAC, plumbing, elevator, façade? What's the per-unit balance and payoff schedule, and is the seller paying it off at close or rolling it to the buyer?
- Is there a deadline driving the sale (1031 exchange, divorce, estate, relocation)? That informs how much negotiation room exists.
- Crime grade is F in this area — have there been break-ins, vandalism, or insurance claims at this property in the last 3 years? What carrier currently insures it and at what premium?
- What's the average days-on-market for RENTAL listings here right now (not sales)? A rising rental-DOM trend means longer vacancies and softer asking-rent achievability than the comps imply.
- What's the recent tenant-quality profile in this submarket — average credit score on applications, eviction rate, late-payment / NSF rate, and stable-employment percentage? A property-management company in the area should have these aggregated.
- How much new apartment / multifamily construction is in the pipeline within 1–3 miles? Heavy new supply (>2% of stock underway) typically softens rents 12–24 months out; light construction supports rent growth.
Investment metrics
- 1% rule
- 1.78% ✓
- Cap rate
- 7.14%
- Cash-on-cash
- 3.02%
- DSCR
- 1.13
- GRM
- 4.7
CMA / ARV
No comps found within radius.
Projected returns pro-forma
-3.0% appreciation · 1.96% rent growth · sell at horizon
- IRR
- -13.2%
- Equity multiple
- 0.53×
- Total profit
- $-13,126
- Equity at exit
- $14,895
- IRR
- -6.8%
- Equity multiple
- 0.59×
- Total profit
- $-11,350
- Equity at exit
- $8,638
Cash invested: $27,972 (down + closing). Projections, not guarantees.
Landlord ↔ Tenant lean methodology
- Overall (STATE)
- 87 Strongly Landlord-Friendly
- State Texas
- 87 Strongly Landlord-Friendly · R+5
- County
- — inherits STATE
- City
- — inherits STATE
ZIP-level market 75231
- Rents YoY
- 2.0%
- Active inventory
- 214
- Price-to-rent
- 4.7×
Monthly cashflow live
- Estimated rent
- $1,782 high interval (Pro) →
- Mortgage (P&I)
- −$524
- Tax from tax record
- −$348 /mo · $4,174/yr
- Insurance
- −$42
- HOA
- −$424
- Vacancy / Maint / Mgmt
- −$374
- Net cashflow
- $70
Break-even live
Sensitivity live
| Price | -10% $127 | -5% $99 | +0% $70 | +5% $42 | +10% $14 |
|---|---|---|---|---|---|
| Rent | -10% $-70 | -5% $0 | +0% $70 | +5% $141 | +10% $211 |
| Rate | -1.0pp $121 | -0.5pp $96 | base $70 | +0.5pp $44 | +1.0pp $18 |
UW: 25.0% down · 7.5% · 30yr · 1.5% tax · 5.0% vac · 8.0% maint · 8.0% mgmt
Financing live
Cash to close
- Down payment
- $24,975
- Closing costs
- $2,997
- Reserves months
- —
- Total cash needed
- —
Loan-product check · same deal, 3 products live
Conventional
25% down · 7.5% · 30yr
- Down + closing
- —
- Monthly P&I
- —
- Monthly cashflow
- —
- DSCR
- —
- Eligible?
- —
Personal DTI + credit; lowest rate.
DSCR
20% down · 8.5% · 30yr
- Down + closing
- —
- Monthly P&I
- —
- Monthly cashflow
- —
- DSCR
- —
- Eligible?
- —
No personal income docs; deal must DSCR.
Hard money
10% down · 12.0% · 12mo
- Down + closing
- —
- Monthly P&I
- —
- Monthly cashflow
- —
- DSCR
- —
- Eligible?
- —
Short-term bridge; refi at stabilization.
Rent comps 40 comps
| Address | Beds | Baths | Sqft | Rent | $/sqft | DOM | Units | Dist |
|---|---|---|---|---|---|---|---|---|
| 8071 Meadow Rd #218 Dallas, TX | 3.0 | 2.0 | 1197 | $1,490 | $1.24 | 45d | 1 | 0.02mi |
| 8095 Meadow Rd #236 Dallas, TX | 2.0 | 2.0 | 1197 | $1,650 | $1.38 | 45d | 1 | 0.04mi |
| 8083 Meadow Rd Unit 1233189P Dallas, TX | 2.0 | 2.0 | 1044 | $4,051 | $3.88 | 0d | 1 | 0.05mi |
| 10550 N Central Expy Dallas, TX | 2.0 | 1.0–2.0 | 885 | $2,150 | $2.43 | 1d | 13 | 0.14mi |
| 8175 Meadow Rd Dallas, TX | 2.0 | 1.0–2.0 | 620 | $1,400 | $2.26 | 45d | 1 | 0.14mi |
| 8107 Manderville Ln Dallas, TX | 2.0 | 1.0–2.5 | 920 | $2,379 | $2.59 | 0d | 21 | 0.16mi |
| 7777 Manderville Ln Dallas, TX | 2.0 | 1.0–2.0 | 863 | $3,018 | $3.50 | 1d | 58 | 0.18mi |
| 8122 Midtown Blvd Unit 1335743P Dallas, TX | 1.0 | 1.0 | 753 | $2,996 | $3.98 | 4d | 1 | 0.19mi |
| 10658 N Central Expy Dallas, TX | 2.0 | 1.0–2.0 | 929 | $3,053 | $3.29 | 0d | 82 | 0.20mi |
| 10658 N Central Expy Dallas, TX | 2.0 | 1.0–2.0 | 929 | $3,227 | $3.47 | 18d | 90 | 0.20mi |
| 10333 N Central Expy Dallas, TX | 1.0–2.0 | 1.0–2.0 | 600 | $1,500 | $2.50 | 17d | 20 | 0.20mi |
| 8071 Meadow Park Dr Unit 1 Dallas, TX | 3.0 | 2.0 | 1197 | $1,490 | $1.24 | 45d | 1 | 0.23mi |
| 7903 Meadow Park Dr Dallas, TX | 1.0 | 1.0 | 734 | $1,100 | $1.50 | 3d | 1 | 0.26mi |
| 7903 Meadow Park Dr #103 Dallas, TX | 1.0 | 1.0 | 734 | $1,100 | $1.50 | 45d | 1 | 0.26mi |
| 10406 High Hollows Dr #226 Dallas, TX | 1.0 | 1.5 | 933 | $1,375 | $1.47 | 23d | 1 | 0.26mi |
| 10406 High Hollows Dr Dallas, TX | 1.0 | 1.5 | 933 | $1,375 | $1.47 | 20d | 1 | 0.26mi |
| 10438 High Hollows Dr #245 Dallas, TX | 2.0 | 2.0 | 1208 | $1,700 | $1.41 | 9d | 1 | 0.28mi |
| 10432 High Hollows Dr Dallas, TX | 2.0 | 2.0 | 1204 | $1,695 | $1.41 | 45d | 1 | 0.28mi |
| 7770 Meadow Rd #202 Dallas, TX | 2.0 | 2.0 | 881 | $1,600 | $1.82 | 45d | 1 | 0.28mi |
| 8250 Meadow Rd Dallas, TX | 3.0 | 1.0–2.0 | 980 | $2,108 | $2.15 | 1d | 25 | 0.29mi |
| 10216 Regal Oaks Dr Unit C Dallas, TX | 1.0 | 1.0 | 734 | $1,280 | $1.74 | 45d | 1 | 0.29mi |
| 10594 High Hollows Dr #290 Dallas, TX | 2.0 | 1.0 | 851 | $1,495 | $1.76 | 26d | 1 | 0.31mi |
| 10501 Steppington Dr Dallas, TX | 1.0 | 1.0 | 626 | $1,158 | $1.85 | 21d | 15 | 0.31mi |
| 7879 Riverfall Dr Dallas, TX | 1.0–2.0 | 1.0–2.0 | 678 | $1,444 | $2.13 | 0d | 32 | 0.33mi |
| 10020 Regal Park Ln Unit 1018238P Dallas, TX | 2.0 | 2.0 | 1076 | $3,091 | $2.87 | 0d | 1 | 0.34mi |
| 10020 Regal Park Ln Unit 1520122P Dallas, TX | 2.0 | 2.0 | 1076 | $3,697 | $3.44 | 8d | 1 | 0.34mi |
| 8196 Manderville Ln Dallas, TX | 2.0 | 2.0 | 1055 | $2,297 | $2.18 | 26d | 1 | 0.34mi |
| 10566 High Hollows Dr #254 Dallas, TX | 2.0 | 2.0 | 1187 | $1,800 | $1.52 | 20d | 1 | 0.34mi |
| 10640 Steppington Dr Dallas, TX | 1.0–2.0 | 1.0–2.0 | 724 | $1,295 | $1.79 | 0d | 26 | 0.34mi |
| 10119 Regal Park Ln #205 Dallas, TX | 2.0 | 2.0 | 949 | $1,800 | $1.90 | 3d | 1 | 0.37mi |
| 10109 Regal Park Ln #112 Dallas, TX | 2.0 | 2.0 | 1200 | $1,850 | $1.54 | 9d | 1 | 0.37mi |
| 7730 Meadow Park Dr #201 Dallas, TX | 2.0 | 2.0 | 1050 | $1,890 | $1.80 | 26d | 1 | 0.38mi |
| 10570 Stone Canyon Rd Dallas, TX | 1.0–2.0 | 1.0–2.0 | 646 | $1,464 | $2.27 | 1d | 25 | 0.39mi |
| 10570 Stone Canyon Rd Unit 354 Dallas, TX | 1.0 | 1.0 | 820 | $1,122 | $1.37 | 45d | 1 | 0.39mi |
| 10650 Steppington Dr Dallas, TX | 1.0–2.0 | 1.0–2.0 | 983 | $1,850 | $1.88 | 0d | 2 | 0.42mi |
| 10650 Steppington Dr Dallas, TX | 1.0–2.0 | 1.0–2.0 | 983 | $1,950 | $1.98 | 45d | 2 | 0.42mi |
| 10651 Steppington Dr Dallas, TX | 2.0 | 1.0–2.0 | 735 | $1,505 | $2.05 | 0d | 38 | 0.42mi |
| 10588 Stone Canyon Rd Dallas, TX | 2.0 | 1.0–2.0 | 783 | $1,614 | $2.06 | 1d | 44 | 0.42mi |
| 8169 Midtown Blvd Dallas, TX | 2.0 | 1.0–2.0 | 924 | $2,120 | $2.29 | 0d | 40 | 0.42mi |
| 10590 Stone Canyon Rd Dallas, TX | 2.0 | 2.0 | 1111 | $1,560 | $1.40 | 26d | 1 | 0.44mi |
HOA detail condo
- Monthly dues
- $424 · $5,088/yr
- Likely covers
- parking
- Assessments
- None detected in remarks — confirm with the listing agent.
Listing history 10 events
-
2026-06-21days on market $99,900 Active 17 DOM
-
2026-06-18days on market $99,900 Active 14 DOM
-
2026-06-17days on market $99,900 Active 13 DOM
-
2026-06-16days on market $99,900 Active 12 DOM
-
2026-06-15days on market $99,900 Active 11 DOM
-
2026-06-13days on market $99,900 Active 9 DOM
-
2026-06-09days on market $99,900 Active 5 DOM
-
2026-06-08days on market $99,900 Active 4 DOM
-
2026-06-07remarks 441-char remark
-
2026-06-07$99,900 Active 3 DOM
ⓘ Source: listings_history table (triggers on properties + properties_extension) + one-shot
backfill from property_details.listing_events for pre-trigger history.
Tax reassessment forecast TX · Resets to sale price
- Current annual tax
- $4,174 · $348/mo
- Projected year-2 tax
- $4,174 · $348/mo
- Expected delta
- $0/yr ($0/mo · 0.0%)
ⓘ Screening estimate from a state-policy table — verify with the county assessor before closing.
Climate risk First Street
- Flood 1/10 Low FEMA zone X (unshaded) · 0% chance over 30 yrs
- Wildfire 1/10 Low
- Heat 7/10 Severe 7 d/yr ≥109°F today · 24 d/yr by 30 yrs out
- Wind 6/10 Major 27% chance of damaging wind over 30 yrs
- Air quality 3/10 Moderate 3 unhealthy d/yr today · 3 by 30 yrs out
Nearby sold comps map
Loading sold comps map…
Walkable amenities ~0.75 mi
Loading nearby amenities…
Taxation est. · year 1
- Rental income
- $21,383
- − Mortgage interest
- −$5,596
- − Property taxes
- −$4,174
- − Insurance
- −$500
- − Repairs & maintenance
- −$1,711
- − Management
- −$1,711
- − HOA
- −$5,088
- − Depreciation
- −$2,906
- Taxable loss
- −$302
- Est. tax savings @ 24.0%
- +$72
- After-tax cash flow
- $917/yr
For passive investors: Depreciation is non-cash, so a rental often shows a tax loss while cash-flowing — sheltering income. Rental losses are passive: they offset passive income freely, and up to $25,000/yr can offset ordinary (W-2) income if you actively participate and your MAGI is under $100k (phasing out to $0 by $150k); unused losses carry forward. On sale, claimed depreciation is recaptured at up to 25%, and gains may owe capital-gains tax (a 1031 exchange can defer both). Figures are a year-1 estimate at your 24.0% rate — not tax advice; consult a CPA.
Schools (NCES district)
- District
- Dallas ISD
- NCES district ID
- 4816230
- Math proficiency
- 31% ▼ -16.00%
- Reading proficiency
- 36% ▼ -4.00%
- Median HH income
- $42,881
- Composite
- 28.41/100
- National rank
- #6763
- State rank
- #559 of 826 in TX
Livability — Dallas
- Score
- 81/100
- State rank
- #24
- US rank
- #1380
Category grades
Schools grade is shown separately in the Schools card above.
Census & demographics
- Census place
- Dallas, TX
- County
- Dallas County · 2,612,404 people
- City population
- 1,168,437
- Metro
- Dallas-Fort Worth-Arlington, TX
- Population (ZIP)
- 38,370
- Household income
- $58,540
- Rent vs Own
- Severe rent burden
- 3482.0
Population outlook (Dallas County) Hauer SSP2
- Today (2025)
- 2,979,839 people
- By 2030
- 3,191,823 · +7.1%
- By 2040
- 3,619,611 · +21.5%
- By 2050
- 4,026,915 · +35.1%
- By 2075
- 4,957,073 · +66.4%
- By 2100
- 5,508,725 · +84.9%
Race, ethnicity, and origin ACS 2023
- Neighborhood character
- Highly diverse neighborhood (Simpson 0.74)
- Race & ethnicity
- Hispanic / Latino 33% White 29% Black 24% Two or more races 13% Asian 9%
- Hispanic origin (detail)
- Mexican 26%
- Common ancestry
- Slovak 1% Lithuanian 1% Romanian 1%
- Foreign-born
- 29% · Canada, Philippines, India
- Languages at home
- 57% English-only · Spanish 27% Other Asian/Pacific 4% Other Indo-European 3%
Political lean MEDSL · Dallas
- 2024 margin
- Strong D (+22.2) · D 60.2% · R 38.0% · Other 1.8%
- 2008→2024 swing
- +6.9pp toward D · 2008: 15.3pp · 2024: 22.2pp
- All cycles
- 2024: D+22.2 2020: D+31.6 2016: D+26.2 2012: D+15.4 2008: D+15.3
Not yet ingested
- Civics
- —
Market trends
- HPI YoY
- ▼ -359.41%
- Current HPI
- 249.5841
- Rent YoY
- ▲ 1.96%
- Metro
- Dallas-Fort Worth-Arlington, TX
- State GDP YoY
- ▲ 3.95%
- F500 in state
- 110
Industry mix (Fortune 500 HQ in TX)
| Industry | F500 HQs | Revenue |
|---|---|---|
| Energy | 16 | $1,198B |
|
||
| Technology | 5 | $198B |
|
||
| Engineering / Construction | 4 | $72B |
|
||
| Energy Services | 3 | $60B |
|
||
| Utilities | 3 | $41B |
|
||
| Healthcare | 2 | $330B |
|
||
Price history
1 event — show timeline
- 2026-06-04 Listed $99,900 NTREIS
Property tax history
+8.3%/yrLatest (2025): $4,174 · -0.4% YoY. Source: county tax records.
Cash-flow waterfall
monthlySold comps — $/sqft
last 12 mo · ≤1 miLoading sold comps…