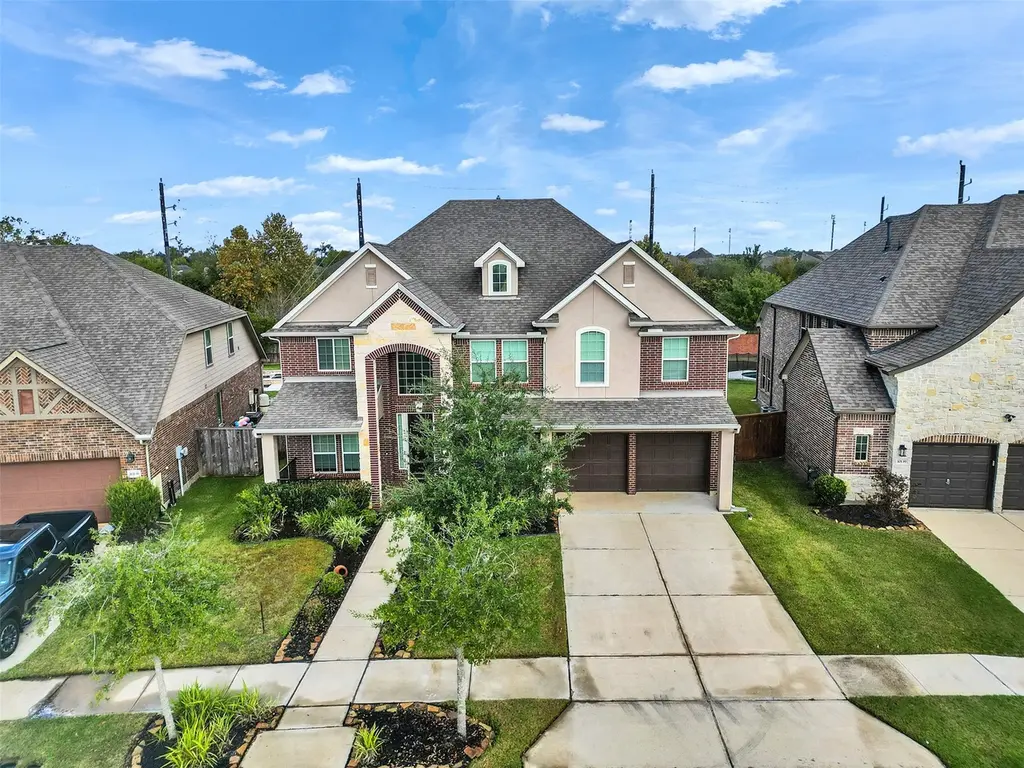
10135 Cypress Path · Sienna, TX
Flood risk 1/10 · Minimal
- FEMA flood zone
- X
- Chance of flooding over 30 yrs
- 0.0%
- Est. flood insurance / yr
- $507 – $1,088
Fire risk 3/10 · Minor
- Est. fire insurance / yr
- $1,222 – $2,270
Heat risk 9/10 · Severe
- Hot days now (above 111°F)
- 7 days/yr
- Hot days in 30 yrs
- 22 days/yr
Wind risk 9/10 · Severe
- Chance of severe wind over 30 yrs
- 99.0%
Air-quality risk 2/10 · Minimal
- Unhealthy air days now
- 2 days/yr
- Unhealthy air days in 30 yrs
- 2 days/yr
Risk factors via First Street. Map © Google.
Why this score? — see what drove the D- grade
The composite is a weighted blend of 9 inputs, each scored 0–100. Each bar is that input's sub-score; the figure is the points it added to the 100-point composite (weight × sub-score).
- ARV discount +12.1/15.0
- Cash flow +6.7/30.0
- Schools +4.5/10.0
- Appreciation +4.2/10.0
- 1% rule +3.6/10.0
- Rent growth +2.5/5.0
- Livability +2.5/5.0
- Condition / age +2.5/5.0
- DSCR +1.0/10.0
$525,000
🖨 Deal sheet 📄 Offer letter ✓ Due diligence
Listing remarks
BEAUTIFULLY APPOINTED SPACIOUS HOME WITH A BRICK/STONE/STUCCO EXTERIOR, OPEN FLOOR PLAN DESIGN, AN ELEGANT IMPRESSIVE LAYOUT WITH FORMAL FOYER ENTRY. ZONED TO EXCEPTIONAL AWARD WINNING SCHOOLS IN THE ACCLAIMED MASTER PLANNED COMMUNITY OF SIENNA. SOME OF THE MANY FEATURES INCLUDE A PRIMARY BEDROOM DOWNSTAIRS JOINED WITH A SPACIOUS SITTING AREA, A FORMAL DINING ROOM, AN OFFICE/STUDY WITH FRENCH DOORS (OPTIONAL 6TH BEDROOM HAVING A FULL BATHROOM ADJACENT TO IT), AN EXQUISITE FAMILY ROOM WITH HIGH CEILINGS AND A BEAUTIFUL FIREPLACE AS ITS FOCAL POINT, GRANITE COUNTERS IN THE KITCHEN AND ALL BATHS, FOUR LARGE SECONDARY BEDROOMS UPSTAIRS, A MEDIA ROOM, A GAME ROOM OVERLOOKING THE FAMILY ROOM AND
Key facts
- Formal dining room
- Formal foyer entry
- 9,857 sq ft lot
Tags
Property features AI
Finance
- Other: Lease not considered
- HOA & community: Member of SPRAI association; Annual association fee; Association manages clubhouse, common areas, and recreation facilities; Community amenities include clubhouse, pool, fitness center, playground, tennis and pickleball courts, basketball court, golf course, dog park, picnic areas, trails and meeting/party room
Exterior
- Parking: Attached garage with 2 spaces
- Security: Smoke detectors
- Utilities: Public water; Public sewer
- Home design: Residential property; Built in 2017; Slab foundation; Composition roof
- Construction: Brick, stone, and stucco exterior
- Exterior features: Balcony; Covered patio; Covered porch; Deck; Patio; Fence around back yard; Porch; Subdivision setting; Pond on lot; Association pool
Interior
- Kitchen: Dishwasher; Electric oven; Gas cooktop; Microwave; Garbage disposal; Granite counters; Pantry; Breakfast nook
- Bedrooms: Six possible bedrooms; Primary bedroom on the first floor; Secondary bedrooms on the second floor
- Flooring: Carpet; Laminate; Tile
- Bathrooms: Four full bathrooms; Double vanity in primary bath; Soaking tub and separate shower in primary bath
- Heating & cooling: Central heating (gas); Central air conditioning (electric)
- Interior features: Gas fireplace; Breakfast bar; Double vanity; Granite counters; High ceilings; Kitchen/family room combo; Primary bedroom with private bath; Pantry; Soaking tub; Separate shower; Tub/shower combination; Ceiling fans; Programmable thermostat; Low emissivity windows
- Laundry & utility: Washer hookup; Electric dryer hookup; Gas dryer hookup
Neighborhood map
What this means for you Summary
Snapshot
- This is a 5-bed/4.0-bath single-family listed at $525k.
Deal economics
- At list price, monthly cash flow is $-838 ($-10k/yr) — negative.
- To cash-flow at today's rent, offer at most $377k (28.2% below list).
- To meet the 1% rule (rent ≥ 1% of price), the offer needs to be $451k (14.2% below list).
- Recommended offer: $377k (28.2% below list) — sets the bar for cash-flow.
- Cap rate 4.4% vs local median 3.3% in Sienna — top-decile yield for the area; either an underpriced asset or a hidden risk that comps aren't pricing in. Stress-test before assuming the spread holds.
Location & tenants
- Location reads: area grade D — affects rentability + tenant quality, not the cash-flow math above.
- Fort Bend ISD (suburban): math 44% / reading 53% proficiency, ranked #140 of 826 in TX (top 17%) — families likely to look elsewhere, expect single-tenant / working-renter base with shorter leases.
- Market conditions: Rents soft (-0.1%/yr); 1215 active listings in the ZIP; 2 comparable units currently listed for rent nearby; high-income renter base; 12,093 units permitted in Fort Bend County in 2024 (815 in 5+ unit buildings).
- This rent runs 42% of the median local income ($129k/yr) — at the standard rent-burdened threshold; future hikes will face affordability resistance.
Forward outlook
- Local home prices are declining (-1.7%/yr); year-one equity from $4k of loan paydown is wiped out by about $9k of value loss. Plan a longer hold.
- Fort Bend County population projected at +75% by 2050 — long-run rental-demand tailwind backs the buy-and-hold thesis.
Negotiation context
- Only 7 days on market — expect competitive offers; lowballing is unlikely to land.
- 16 sale attempts since 7y ago with the ask held roughly flat each time — persistent listings suggest the price (not the market) is what's stuck; bring a comps-based counter.
Risks & watch-outs
- Watch-outs: property tax is 3.0% of price.
- Climate carrying-cost: severe wind risk, 99% chance of damaging wind over 30y; extreme-heat days projected 7→22/yr by 2055 (HVAC capex compounding) — expect insurance premiums to compound above CPI over the hold.
Questions for the listing agent
- What do current leases actually rent for vs. the listed asking? Can we see a recent rent roll and the last 12 months of T-12 income?
- Property tax is high relative to price — has the assessment been appealed recently, and will the sale trigger a re-assessment?
- What does the HOA fee cover, when was the last increase, and are there any pending special assessments or reserve-fund shortfalls?
- Is there a deadline driving the sale (1031 exchange, divorce, estate, relocation)? That informs how much negotiation room exists.
- The area grade is low — what's the realistic commute time and amenity access for the typical tenant pool here? Any planned neighborhood developments (good or bad) we should know about?
- What's the average days-on-market for RENTAL listings here right now (not sales)? A rising rental-DOM trend means longer vacancies and softer asking-rent achievability than the comps imply.
- What's the recent tenant-quality profile in this submarket — average credit score on applications, eviction rate, late-payment / NSF rate, and stable-employment percentage? A property-management company in the area should have these aggregated.
- How much new for-sale + rental construction is in the pipeline within 1–3 miles? Heavy new supply typically softens prices + rents 12–24 months out; constrained supply supports both.
Investment metrics
- 1% rule
- 0.86% ✗
- Cap rate
- 4.38%
- Cash-on-cash
- -6.84%
- DSCR
- 0.70
- GRM
- 9.7
CMA / ARV
- ARV (median comp)
- $584,256
- List price
- $525,000
- Delta
- -10.14%
- Verdict
- UNDERPRICED
- Comps
- 20 within 1.0 mi
Show comp detail 12 sales within ~0.75 mi
| Address | Dist | Beds/Ba | Sqft | Sold | Price | $/sf | Match |
|---|---|---|---|---|---|---|---|
| 10022 Orchard Fld | 0.05mi | 4/3.5 (-1) | 3,563 (-4%) | 1mo | $597,900 | $168 | 83 |
| 10115 Cypress Path | 0.06mi | 4/3.5 (-1) | 3,457 (-7%) | 2mo | $520,900 | $151 | 77 |
| 10026 Golden Woods Dr | 0.43mi | 5/4.5 | 3,634 (-2%) | 4mo | $645,000 | $177 | 71 |
| 10039 Cypress Path | 0.15mi | 4/3.5 (-1) | 3,348 (-10%) | 0mo | $585,000 | $175 | 70 |
| 9811 Mount Shasta | 0.26mi | 5/5.0 | 4,150 (+12%) | 1mo | $699,900 | $169 | 63 |
| 9918 Knollwood Ln | 0.56mi | 4/3.0 (-1) | 3,831 (+3%) | 1mo | $550,000 | $144 | 58 |
| 2618 Lazy Vine Ln | 0.52mi | 4/3.5 (-1) | 3,478 (-6%) | 1mo | $750,000 | $216 | 58 |
| 9019 Serenity Frst | 0.72mi | 4/4.5 (-1) | 3,474 (-6%) | 3mo | $824,900 | $237 | 47 |
| 2018 Edgemont Pl | 0.61mi | 5/3.5 | 3,227 (-13%) | 2mo | $499,500 | $155 | 46 |
| 1939 Creekwood Cv | 0.66mi | 4/4.0 (-1) | 3,344 (-10%) | 2mo | $594,990 | $178 | 46 |
| 9418 San Marco Dr | 0.58mi | 4/4.5 (-1) | 3,266 (-12%) | 4mo | $745,000 | $228 | 43 |
| 9434 San Marco Dr | 0.55mi | 4/4.5 (-1) | 4,234 (+14%) | 1mo | $724,900 | $171 | 43 |
Match score weights: distance 35% · size 25% · config 20% · recency 20%. Top-matched comps best support the ARV.
Projected returns pro-forma
-1.67% appreciation · 0.0% rent growth · sell at horizon
- IRR
- -21.4%
- Equity multiple
- 0.18×
- Total profit
- $-121,188
- Equity at exit
- $110,108
- IRR
- -20.0%
- Equity multiple
- -0.33×
- Total profit
- $-195,944
- Equity at exit
- $101,986
Cash invested: $147,000 (down + closing). Projections, not guarantees.
Landlord ↔ Tenant lean methodology
- Overall (STATE)
- 87 Strongly Landlord-Friendly
- State Texas
- 87 Strongly Landlord-Friendly · R+5
- County
- — inherits STATE
- City
- — inherits STATE
ZIP-level market 77459
- Home prices YoY
- -0.8%
- Rents YoY
- -0.1%
- Active inventory
- 1215
- Price-to-rent
- 9.7×
Monthly cashflow live
- Estimated rent
- $4,506 medium interval (Pro) →
- Mortgage (P&I)
- −$2,753
- Tax from tax record
- −$1,297 /mo · $15,566/yr
- Insurance
- −$219
- HOA
- −$129
- Vacancy / Maint / Mgmt
- −$946
- Net cashflow
- $-838
Break-even live
UW: 25.0% down · 7.5% · 30yr · 1.5% tax · 5.0% vac · 8.0% maint · 8.0% mgmt
Financing live
Cash to close
- Down payment
- $131,250
- Closing costs
- $15,750
- Reserves months
- —
- Total cash needed
- —
Loan-product check · same deal, 3 products live
Conventional
25% down · 7.5% · 30yr
- Down + closing
- —
- Monthly P&I
- —
- Monthly cashflow
- —
- DSCR
- —
- Eligible?
- —
Personal DTI + credit; lowest rate.
DSCR
20% down · 8.5% · 30yr
- Down + closing
- —
- Monthly P&I
- —
- Monthly cashflow
- —
- DSCR
- —
- Eligible?
- —
No personal income docs; deal must DSCR.
Hard money
10% down · 12.0% · 12mo
- Down + closing
- —
- Monthly P&I
- —
- Monthly cashflow
- —
- DSCR
- —
- Eligible?
- —
Short-term bridge; refi at stabilization.
Rent comps 2 comps
| Address | Beds | Baths | Sqft | Rent | $/sqft | DOM | Units | Dist |
|---|---|---|---|---|---|---|---|---|
| 9006 Meadow Bridge Dr Missouri City, TX | 4.0 | 3.5 | 3958 | $6,580 | $1.66 | 2d | 1 | 0.78mi |
| 2718 Van Gogh Ln Missouri City, TX | 4.0 | 2.5 | 3036 | $3,595 | $1.18 | 10d | 1 | 1.25mi |
HOA detail
- Monthly dues
- $129 · $1,548/yr
Listing history 40 events
-
2026-06-09days on market $525,000 Active 7 DOM
-
2026-06-08days on market $525,000 Active 6 DOM
-
2026-06-07days on market $525,000 Active 5 DOM
-
2026-06-04days on market $525,000 Active 2 DOM
-
2026-06-02days on market $525,000 Active 1 DOM
-
2026-06-01days on market $525,000 Active 62 DOM
-
2026-05-31days on market $525,000 Active 61 DOM
-
2026-04-28price $525,000 1079-char remark
-
2026-03-31$530,000 Active 1079-char remark
-
2026-03-30historical
-
2026-02-26$549,750 Active
-
2026-02-25historical
-
2026-02-21$555,000 Active
-
2026-02-20historical
-
2026-02-06$558,000 Active
-
2026-02-06historical $3,500
-
2026-02-05historical
-
2026-01-27price $565,000
-
2026-01-04$3,500
-
2026-01-02historical $3,500
-
2026-01-02$570,000 Active
-
2026-01-01$3,500
-
2026-01-01historical
-
2025-12-25historical $3,500
-
2025-11-28$3,500
-
2025-11-26$585,000 Active
-
2025-11-01historical $3,650
-
2025-10-31historical
-
2025-10-15historical
-
2025-10-14$599,950 Active
-
2025-09-29$605,000 Active
-
2025-09-29historical
-
2025-09-16$3,650
-
2025-09-11$610,000 Active
-
2019-11-08soldstatus Sold
-
2019-10-18status Pending, Continue to Show
-
2019-09-11price $399,900
-
2019-04-30$415,000 Active
-
2019-04-09historical
-
2019-01-02$449,000 Active
ⓘ Source: listings_history table (triggers on properties + properties_extension) + one-shot
backfill from property_details.listing_events for pre-trigger history.
Tax reassessment forecast TX · Resets to sale price
- Current annual tax
- $15,566 · $1,297/mo
- Projected year-2 tax
- $15,566 · $1,297/mo
- Expected delta
- $0/yr ($0/mo · 0.0%)
ⓘ Screening estimate from a state-policy table — verify with the county assessor before closing.
Climate risk First Street
- Flood 1/10 Low FEMA zone X · 0% chance over 30 yrs
- Wildfire 3/10 Moderate
- Heat 9/10 Extreme 7 d/yr ≥111°F today · 22 d/yr by 30 yrs out
- Wind 9/10 Extreme 99% chance of damaging wind over 30 yrs
- Air quality 2/10 Low 2 unhealthy d/yr today · 2 by 30 yrs out
Nearby sold comps map
Loading sold comps map…
Walkable amenities ~0.75 mi
Loading nearby amenities…
Taxation est. · year 1
- Rental income
- $54,078
- − Mortgage interest
- −$29,408
- − Property taxes
- −$15,566
- − Insurance
- −$2,625
- − Repairs & maintenance
- −$4,326
- − Management
- −$4,326
- − HOA
- −$1,548
- − Depreciation
- −$15,273
- Taxable loss
- −$18,994
- Est. tax savings @ 24.0%
- +$4,559
- After-tax cash flow
- $-5,497/yr
For passive investors: Depreciation is non-cash, so a rental often shows a tax loss while cash-flowing — sheltering income. Rental losses are passive: they offset passive income freely, and up to $25,000/yr can offset ordinary (W-2) income if you actively participate and your MAGI is under $100k (phasing out to $0 by $150k); unused losses carry forward. On sale, claimed depreciation is recaptured at up to 25%, and gains may owe capital-gains tax (a 1031 exchange can defer both). Figures are a year-1 estimate at your 24.0% rate — not tax advice; consult a CPA.
Schools (NCES district)
- District
- Fort Bend ISD
- NCES district ID
- 4819650
- Math proficiency
- 44% ▼ -15.00%
- Reading proficiency
- 53% ▼ -4.00%
- Median HH income
- $82,360
- Composite
- 44.61/100
- National rank
- #2779
- State rank
- #140 of 826 in TX
Livability — Sienna
No livability data for this city. (Only ~50 U.S. cities are tracked.)
Census & demographics
- Census place
- Sienna, TX
- County
- Fort Bend County · 836,777 people
- Metro
- Houston-The Woodlands-Sugar Land, TX
- Population (ZIP)
- 84,221
- Household income
- $129,151
- Rent vs Own
- Severe rent burden
- 1004.0
Population outlook (Fort Bend County) Hauer SSP2
- Today (2025)
- 1,004,526 people
- By 2030
- 1,153,104 · +14.8%
- By 2040
- 1,453,718 · +44.7%
- By 2050
- 1,753,781 · +74.6%
- By 2075
- 2,455,772 · +144.5%
- By 2100
- 2,930,528 · +191.7%
Race, ethnicity, and origin ACS 2023
- Neighborhood character
- Highly diverse neighborhood (Simpson 0.75)
- Race & ethnicity
- White 34% Black 26% Asian 22% Hispanic / Latino 13% Two or more races 10%
- Hispanic origin (detail)
- Mexican 7%
- Common ancestry
- Lithuanian 2% Slovak 1% Italian 1%
- Foreign-born
- 21% · Canada, China, Vietnam
- Languages at home
- 73% English-only · Other Asian/Pacific 8% Spanish 7% Other Indo-European 5%
Political lean MEDSL · Fort Bend
- 2024 margin
- Toss-up / Even · D 49.5% · R 47.9% · Other 2.6%
- 2008→2024 swing
- +4.0pp toward D · 2008: -2.4pp · 2024: 1.6pp
- All cycles
- 2024: D+1.6 2020: D+10.6 2016: D+6.6 2012: R+6.8 2008: R+2.4
Not yet ingested
- Civics
- —
Market trends
- HPI YoY
- ▼ -1.67%
- Current HPI
- 212.3573
- Rent YoY
- ▼ -0.15%
- Metro
- Houston-The Woodlands-Sugar Land, TX
- State GDP YoY
- ▲ 3.95%
- F500 in state
- 110
Industry mix (Fortune 500 HQ in TX)
| Industry | F500 HQs | Revenue |
|---|---|---|
| Energy | 16 | $1,198B |
|
||
| Technology | 5 | $198B |
|
||
| Engineering / Construction | 4 | $72B |
|
||
| Energy Services | 3 | $60B |
|
||
| Utilities | 3 | $41B |
|
||
| Healthcare | 2 | $330B |
|
||
Price history
+16.9% since first listed36 events — show timeline
- 2026-06-10 Listing Removed — HARMLS
- 2026-06-02 Listed $525,000 HARMLS
- 2026-06-01 Listing Removed — HARMLS
- 2026-04-28 Price Changed $525,000 HARMLS
- 2026-03-31 Listed $530,000 HARMLS
- 2026-03-30 Listing Removed — HARMLS
- 2026-02-26 Listed $549,750 HARMLS
- 2026-02-25 Listing Removed — HARMLS
- 2026-02-21 Listed $555,000 HARMLS
- 2026-02-20 Listing Removed — HARMLS
- 2026-02-06 Listed $558,000 HARMLS
- 2026-02-06 Rental Removed $3,500 HARMLS
- 2026-02-05 Listing Removed — HARMLS
- 2026-01-27 Price Changed $565,000 HARMLS
- 2026-01-04 Listed for Rent $3,500 HARMLS
- 2026-01-02 Rental Removed $3,500 HARMLS
- 2026-01-02 Listed $570,000 HARMLS
- 2026-01-01 Listed for Rent $3,500 HARMLS
- 2026-01-01 Listing Removed — HARMLS
- 2025-12-25 Rental Removed $3,500 HARMLS
- 2025-11-28 Listed for Rent $3,500 HARMLS
- 2025-11-26 Listed $585,000 HARMLS
- 2025-11-01 Rental Removed $3,650 HARMLS
- 2025-10-31 Listing Removed — HARMLS
- 2025-10-15 Listing Removed — HARMLS
- 2025-10-14 Listed $599,950 HARMLS
- 2025-09-29 Listing Removed — HARMLS
- 2025-09-29 Listed $605,000 HARMLS
- 2025-09-16 Listed for Rent $3,650 HARMLS
- 2025-09-11 Listed $610,000 HARMLS
- 2019-11-08 Sold (MLS) — HARMLS
- 2019-10-18 Pending — HARMLS
- 2019-09-11 Price Changed $399,900 HARMLS
- 2019-04-30 Listed $415,000 HARMLS
- 2019-04-09 Listing Removed — HARMLS
- 2019-01-02 Listed $449,000 HARMLS
Property tax history
+34.1%/yrLatest (2025): $15,566 · +4.6% YoY. Source: county tax records.
Cash-flow waterfall
monthlySold comps — $/sqft
last 12 mo · ≤1 miLoading sold comps…