 Multi-family
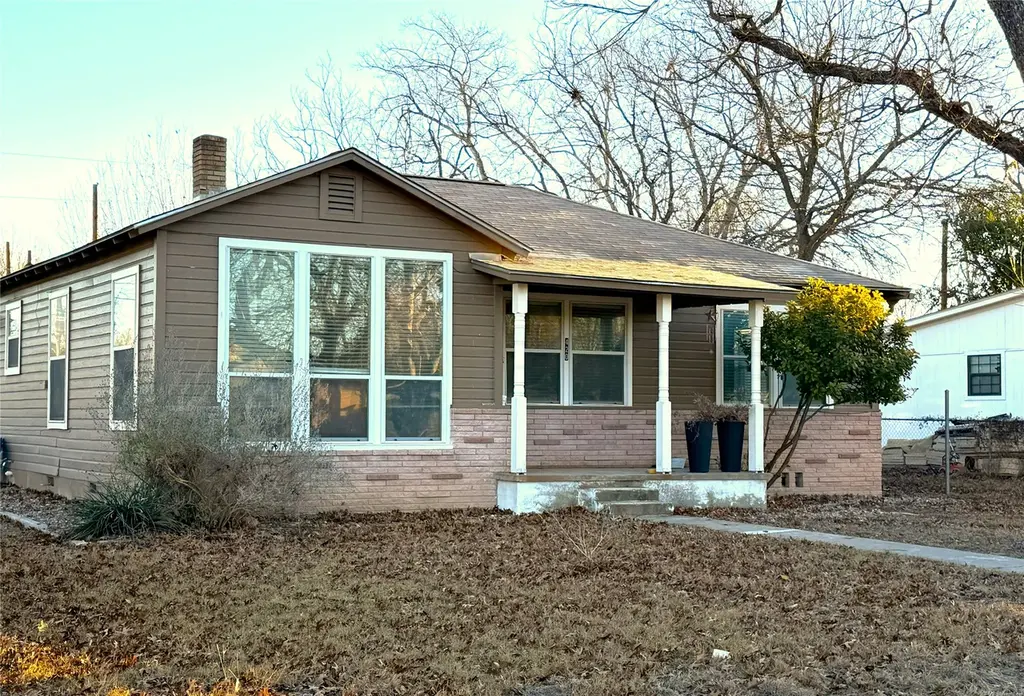
420 Stonewall St · Kerrville, TX
Flood risk 1/10 · Minimal
- FEMA flood zone
- X (unshaded)
- Chance of flooding over 30 yrs
- 0.0%
- Est. flood insurance / yr
- $507 – $1,088
Fire risk 4/10 · Minor
- Est. fire insurance / yr
- $1,222 – $2,270
Heat risk 6/10 · Moderate
- Hot days now (above 103°F)
- 7 days/yr
- Hot days in 30 yrs
- 23 days/yr
Wind risk 6/10 · Moderate
- Chance of severe wind over 30 yrs
- 52.0%
Air-quality risk 1/10 · Minimal
- Unhealthy air days now
- 0 days/yr
- Unhealthy air days in 30 yrs
- 0 days/yr
Risk factors via First Street. Map © Google.
Why this score? — see what drove the B+ grade
The composite is a weighted blend of 9 inputs, each scored 0–100. Each bar is that input's sub-score; the figure is the points it added to the 100-point composite (weight × sub-score).
- Cash flow +30.0/30.0
- ARV discount +15.0/15.0
- 1% rule +10.0/10.0
- DSCR +10.0/10.0
- Schools +4.1/10.0
- Livability +4.0/5.0
- Rent growth +3.3/5.0
- Condition / age +2.5/5.0
- Appreciation +0.0/10.0
$365,000
🖨 Deal sheet 📄 Offer letter ✓ Due diligence
Multi-family units
County records classify this as Multi-Family (2-4 Unit). Listing-text estimate: 1 unit. estimate disagrees with records
Listing remarks MLS
Charming cottage plus income potential in the heart of Kerrville. This property features a cute 3/1 main house and a 2/1 second unit—perfect for multi-generational living, guest quarters, or rental income. Plenty of parking and close to everything Kerrville has to offer: shopping, dining, schools, and medical. Great opportunity to live in one and rent the other or keep both as investment properties.
Key facts
- Guest quarters
- Plenty of parking
- Close to dining
Tags
Neighborhood map
What this means for you Summary
Snapshot
- This is a 3-bed/1.0-bath multifamily listed at $365k.
Deal economics
- At list price, monthly cash flow is $3k ($31k/yr) — positive.
- The deal already cash-flows at list — no discount required.
- Meets the 1% rule at list price ($6k rent vs $365k).
- Recommended offer: $332k (9.0% below list) — sets the bar for market timing.
- Cap rate 14.7% vs local median 2.1% in Kerrville — top-decile yield for the area; either an underpriced asset or a hidden risk that comps aren't pricing in. Stress-test before assuming the spread holds.
Location & tenants
- Location reads 81/100 on livability (#25 in TX, #1,483 nationally) — a professional / high-income tenant draw. Strengths: crime A+, cost of living A+, housing A+; Watch: employment C-, commute F.
- Kerrville ISD (town): math 45% / reading 51% proficiency, ranked #220 of 826 in TX (top 27%) — families likely to look elsewhere, expect single-tenant / working-renter base with shorter leases.
- Market conditions: Rents rising (+3.0%/yr); 753 active listings in the ZIP; 5 comparable units currently listed for rent nearby; rentals lingering (median 44d on market — plan ~5-8 weeks vacancy on turnover, expect pricing pressure); 100% of comp listings sitting > 30 days — soft ceiling on asking rent; 422 units permitted in Kerr County in 2024 (322 in 5+ unit buildings).
- At $6,461/mo this rent would consume 116% of the median local household income ($67k/yr) (locally 1092% of renters already pay >50% of income on rent) — very limited rent-growth headroom before tenants either downsize or default.
Forward outlook
- Local home prices are declining (-3.0%/yr); year-one equity from $3k of loan paydown is wiped out by about $11k of value loss. Plan a longer hold.
- Kerr County population projected at +15% by 2050 — long-run rental-demand tailwind backs the buy-and-hold thesis.
- At projected returns (-3.0% appreciation + 3.0% rent growth), your $102k cash investment doubles in ~4 years — after that, you're playing with house money.
Negotiation context
- It's been on market 115 days — a 9% lower offer ($332k) is reasonable based on typical stale-listing flexibility.
- 4 sale attempts since 22y ago with the ask held roughly flat each time — persistent listings suggest the price (not the market) is what's stuck; bring a comps-based counter.
Risks & watch-outs
- Climate carrying-cost: major wind risk, 52% chance of damaging wind over 30y; extreme-heat days projected 7→23/yr by 2055 (HVAC capex compounding) — expect insurance premiums to compound above CPI over the hold.
Questions for the listing agent
- It's been on market 115 days. Have you received any prior offers? Is the seller open to a 9% concession, seller financing, or rate buy-down credit?
- Why hasn't it sold? Are there any deal-killer items the seller is aware of (foundation, flood, title, zoning, code violations)?
- Is there a deadline driving the sale (1031 exchange, divorce, estate, relocation)? That informs how much negotiation room exists.
- Schools are B-rated — typically a magnet for longer-tenancy family renters. What's the average tenant stay here, and is there a school-zone premium baked into asking?
- What's the average days-on-market for RENTAL listings here right now (not sales)? A rising rental-DOM trend means longer vacancies and softer asking-rent achievability than the comps imply.
- What's the recent tenant-quality profile in this submarket — average credit score on applications, eviction rate, late-payment / NSF rate, and stable-employment percentage? A property-management company in the area should have these aggregated.
- How much new apartment / multifamily construction is in the pipeline within 1–3 miles? Heavy new supply (>2% of stock underway) typically softens rents 12–24 months out; light construction supports rent growth.
Investment metrics
- 1% rule
- 1.77% ✓
- Cap rate
- 14.69%
- Cash-on-cash
- 29.99%
- DSCR
- 2.33
- GRM
- 4.7
CMA / ARV
- ARV (median comp)
- $465,737
- List price
- $365,000
- Delta
- -21.63%
- Verdict
- UNDERPRICED
- Comps
- 10 within 1.0 mi
Projected returns pro-forma
-3.0% appreciation · 3.03% rent growth · sell at horizon
- IRR
- 24.6%
- Equity multiple
- 2.02×
- Total profit
- $103,823
- Equity at exit
- $54,423
- IRR
- 32.4%
- Equity multiple
- 3.95×
- Total profit
- $301,124
- Equity at exit
- $31,559
Cash invested: $102,200 (down + closing). Projections, not guarantees.
Landlord ↔ Tenant lean methodology
- Overall (STATE)
- 87 Strongly Landlord-Friendly
- State Texas
- 87 Strongly Landlord-Friendly · R+5
- County
- — inherits STATE
- City
- — inherits STATE
ZIP-level market 78028
- Rents YoY
- 3.0%
- Active inventory
- 753
- Price-to-rent
- 16.1×
Monthly cashflow live
- Estimated rent
- $6,461 medium interval (Pro) →
- Mortgage (P&I)
- −$1,914
- Tax from tax record
- −$484 /mo · $5,809/yr
- Insurance
- −$152
- HOA
- −$0
- Vacancy / Maint / Mgmt
- −$1,357
- Net cashflow
- $2,554
Break-even live
4-unit breakdown (identical units grouped — click to expand)
| Units | Beds | Baths | Est. rent |
|---|---|---|---|
| 1× unit | 3 | 1 | $1,890 |
| 3× units | 2 | 1 | $4,572 |
| #2 | 2 | 1 | $1,524 |
| #3 | 2 | 1 | $1,524 |
| #4 | 2 | 1 | $1,524 |
| Total (4 units) | $6,461 | ||
UW: 25.0% down · 7.5% · 30yr · 1.5% tax · 5.0% vac · 8.0% maint · 8.0% mgmt
Financing live
Cash to close
- Down payment
- $91,250
- Closing costs
- $10,950
- Reserves months
- —
- Total cash needed
- —
Loan-product check · same deal, 3 products live
Conventional
25% down · 7.5% · 30yr
- Down + closing
- —
- Monthly P&I
- —
- Monthly cashflow
- —
- DSCR
- —
- Eligible?
- —
Personal DTI + credit; lowest rate.
DSCR
20% down · 8.5% · 30yr
- Down + closing
- —
- Monthly P&I
- —
- Monthly cashflow
- —
- DSCR
- —
- Eligible?
- —
No personal income docs; deal must DSCR.
Hard money
10% down · 12.0% · 12mo
- Down + closing
- —
- Monthly P&I
- —
- Monthly cashflow
- —
- DSCR
- —
- Eligible?
- —
Short-term bridge; refi at stabilization.
Rent comps 5 comps
| Address | Beds | Baths | Sqft | Rent | $/sqft | DOM | Units | Dist |
|---|---|---|---|---|---|---|---|---|
| 705 Lee St Kerrville, TX | 4.0 | 2.0 | 1781 | $2,300 | $1.29 | 43d | 1 | 0.21mi |
| 329 W Main St Kerrville, TX | 2.0 | 1.0 | 1794 | $1,995 | $1.11 | 43d | 1 | 0.23mi |
| 113 Los Cedros Loop Kerrville, TX | 3.0 | 2.0 | 1780 | $2,300 | $1.29 | 44d | 1 | 0.69mi |
| 1000 Guadalupe St Kerrville, TX | 2.0 | 2.0 | 1777 | $2,500 | $1.41 | 43d | 1 | 0.89mi |
| 327 Roy St Kerrville, TX | 3.0 | 2.0 | 1962 | $1,750 | $0.89 | 43d | 1 | 1.49mi |
Listing history 25 events
-
2026-06-19days on market $365,000 Active 115 DOM
-
2026-06-18days on market $365,000 Active 114 DOM
-
2026-06-17days on market $365,000 Active 113 DOM
-
2026-06-16days on market $365,000 Active 112 DOM
-
2026-06-15days on market $365,000 Active 111 DOM
-
2026-06-14days on market $365,000 Active 109 DOM
-
2026-06-12days on market $365,000 Active 108 DOM
-
2026-06-09days on market $365,000 Active 105 DOM
-
2026-06-08days on market $365,000 Active 104 DOM
-
2026-06-07days on market $365,000 Active 103 DOM
-
2026-06-05days on market $365,000 Active 100 DOM
-
2026-06-03days on market $365,000 Active 99 DOM
-
2026-06-02days on market $365,000 Active 98 DOM
-
2026-06-01days on market $365,000 Active 97 DOM
-
2026-05-31days on market $365,000 Active 96 DOM
-
2026-05-30days on market $365,000 Active 95 DOM
-
2026-02-24$365,000 Active 408-char remark
Show marketing remark (408 chars)
Charming cottage plus income potential in the heart of Kerrville. This property features a cute 3/1 main house and a 2/1 second unit—perfect for multi-generational living, guest quarters, or rental income. Plenty of parking and close to everything Kerrville has to offer: shopping, dining, schools, and medical. Great opportunity to live in one and rent the other or keep both as investment properties.
-
2022-09-26soldstatus
-
2021-03-16soldstatus
-
2021-03-12soldstatus 160-char remark
Show marketing remark (160 chars)
Investment opportunity! Income producing property. Cute 3/1 Cottage as main house and a traditional 2/1 second unit. Ample Parking. Close to all town amenities
-
2020-09-18$282,500 160-char remark
Show marketing remark (160 chars)
Investment opportunity! Income producing property. Cute 3/1 Cottage as main house and a traditional 2/1 second unit. Ample Parking. Close to all town amenities
-
2009-04-22soldstatus
-
2008-09-30$129,900
-
2004-05-05soldstatus
-
2004-03-21$69,000
ⓘ Source: listings_history table (triggers on properties + properties_extension) + one-shot
backfill from property_details.listing_events for pre-trigger history.
Tax reassessment forecast TX · Resets to sale price
- Current annual tax
- $5,809 · $484/mo
- Projected year-2 tax
- $6,680 · $557/mo
- Expected delta
- +$870/yr (+$73/mo · 15.0%)
ⓘ Screening estimate from a state-policy table — verify with the county assessor before closing.
Climate risk First Street
- Flood 1/10 Low FEMA zone X (unshaded) · 0% chance over 30 yrs
- Wildfire 4/10 Moderate
- Heat 6/10 Major 7 d/yr ≥103°F today · 23 d/yr by 30 yrs out
- Wind 6/10 Major 52% chance of damaging wind over 30 yrs
- Air quality 1/10 Low 0 unhealthy d/yr today · 0 by 30 yrs out
Nearby sold comps map
Loading sold comps map…
Walkable amenities ~0.75 mi
Loading nearby amenities…
Taxation est. · year 1
- Rental income
- $77,532
- − Mortgage interest
- −$20,446
- − Property taxes
- −$5,809
- − Insurance
- −$1,825
- − Repairs & maintenance
- −$6,203
- − Management
- −$6,203
- − Depreciation
- −$10,618
- Taxable income
- $26,429
- Est. tax owed @ 24.0%
- −$6,343
- After-tax cash flow
- $24,304/yr
For passive investors: Depreciation is non-cash, so a rental often shows a tax loss while cash-flowing — sheltering income. Rental losses are passive: they offset passive income freely, and up to $25,000/yr can offset ordinary (W-2) income if you actively participate and your MAGI is under $100k (phasing out to $0 by $150k); unused losses carry forward. On sale, claimed depreciation is recaptured at up to 25%, and gains may owe capital-gains tax (a 1031 exchange can defer both). Figures are a year-1 estimate at your 24.0% rate — not tax advice; consult a CPA.
Schools (NCES district)
- District
- Kerrville ISD
- NCES district ID
- 4825590
- Math proficiency
- 45% ▼ -10.00%
- Reading proficiency
- 51% ▼ -1.00%
- Median HH income
- $44,050
- Composite
- 40.54/100
- National rank
- #3702
- State rank
- #220 of 826 in TX
Livability — Kerrville
- Score
- 81/100
- State rank
- #25
- US rank
- #1483
Category grades
Schools grade is shown separately in the Schools card above.
Census & demographics
- Census place
- Kerrville, TX
- County
- Kerr County · 41,206 people
- City population
- 41,206
- Metro
- Kerrville, TX
- Population (ZIP)
- 41,206
- Household income
- $66,991
- Rent vs Own
- Severe rent burden
- 1092.0
Population outlook (Kerr County) Hauer SSP2
- Today (2025)
- 54,010 people
- By 2030
- 55,651 · +3.0%
- By 2040
- 58,923 · +9.1%
- By 2050
- 62,117 · +15.0%
- By 2075
- 71,809 · +33.0%
- By 2100
- 77,004 · +42.6%
Race, ethnicity, and origin ACS 2023
- Neighborhood character
- Predominantly White (69%)
- Race & ethnicity
- White 69% Hispanic / Latino 26% Two or more races 12% Black 2%
- Hispanic origin (detail)
- Mexican 22%
- Common ancestry
- Lithuanian 3% Slovak 3% Portuguese 2%
- Foreign-born
- 6% · Canada
- Languages at home
- 89% English-only · Spanish 10%
Political lean MEDSL · Kerr
- 2024 margin
- Solid R (+54.3) · D 22.4% · R 76.8%
- 2008→2024 swing
- -4.8pp toward R · 2008: -49.6pp · 2024: -54.3pp
- All cycles
- 2024: R+54.3 2020: R+51.7 2016: R+56.3 2012: R+59.1 2008: R+49.6
Not yet ingested
- Civics
- —
Market trends
- HPI YoY
- ▼ -260.97%
- Current HPI
- 213.3663
- Rent YoY
- ▲ 3.03%
- Metro
- Kerrville, TX
- State GDP YoY
- ▲ 3.95%
- F500 in state
- 110
Industry mix (Fortune 500 HQ in TX)
| Industry | F500 HQs | Revenue |
|---|---|---|
| Energy | 16 | $1,198B |
|
||
| Technology | 5 | $198B |
|
||
| Engineering / Construction | 4 | $72B |
|
||
| Energy Services | 3 | $60B |
|
||
| Utilities | 3 | $41B |
|
||
| Healthcare | 2 | $330B |
|
||
Price history
+429.0% since first listed9 events — show timeline
- 2026-02-24 Listed $365,000 Unlock MLS
- 2022-09-26 Sold (Public Records) — Public Records
- 2021-03-16 Sold (Public Records) — Public Records
- 2021-03-12 Sold (MLS) — KVMLS
- 2020-09-18 Listed $282,500 KVMLS
- 2009-04-22 Sold (MLS) — KVMLS
- 2008-09-30 Listed $129,900 KVMLS
- 2004-05-05 Sold (MLS) — KVMLS
- 2004-03-21 Listed $69,000 KVMLS
Property tax history
+7.4%/yrLatest (2025): $5,809 · -1.7% YoY. Source: county tax records.
Cash-flow waterfall
monthlySold comps — $/sqft
last 12 mo · ≤1 miLoading sold comps…