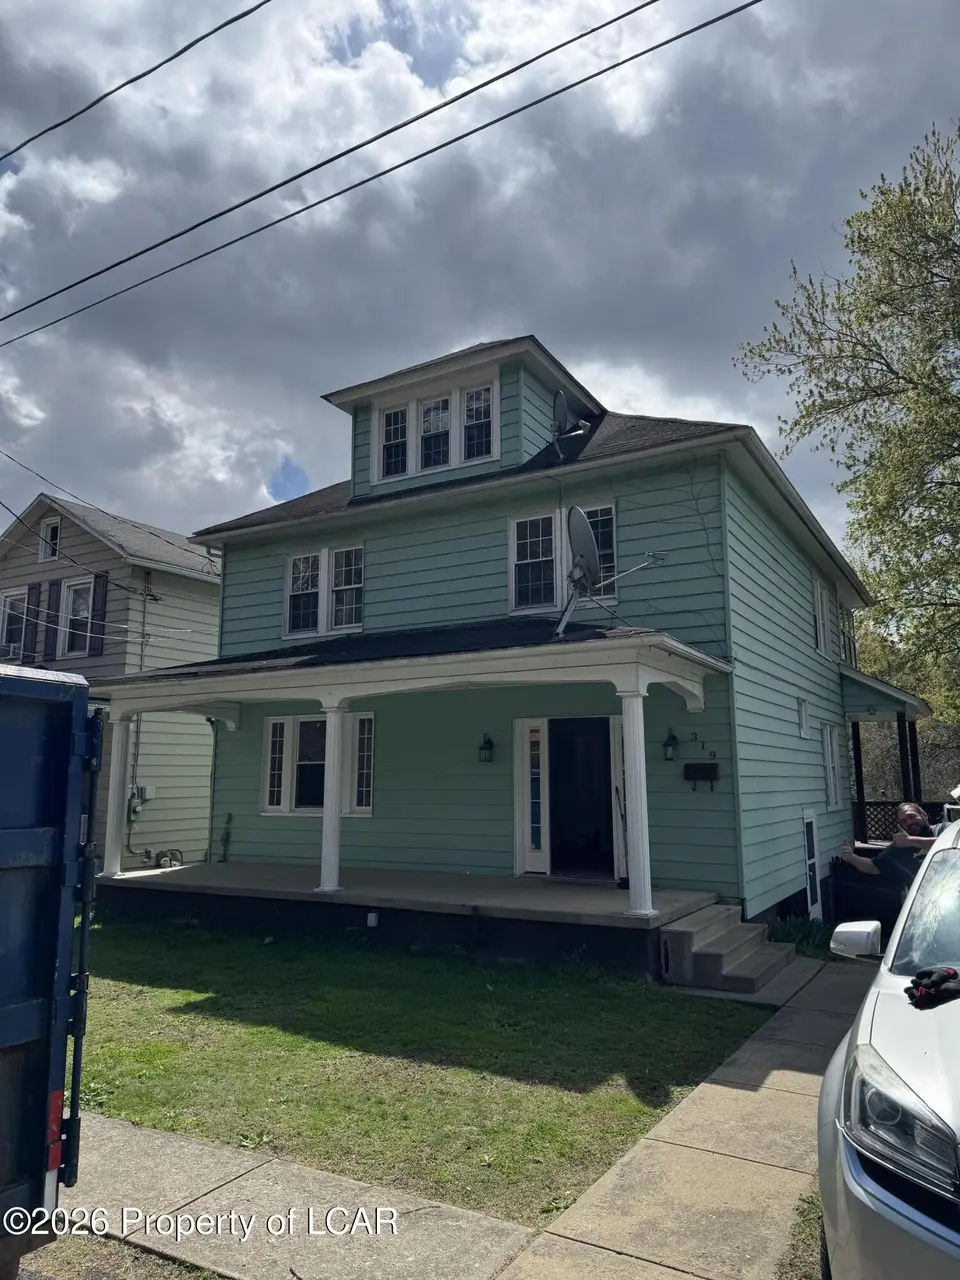
319 Newport St · Newport, PA
Flood risk 1/10 · Minimal
- FEMA flood zone
- X (unshaded)
- Chance of flooding over 30 yrs
- 0.0%
- Est. flood insurance / yr
- $507 – $1,088
Fire risk 4/10 · Minor
- Est. fire insurance / yr
- $511 – $949
Heat risk 3/10 · Minor
- Hot days now (above 94°F)
- 7 days/yr
- Hot days in 30 yrs
- 16 days/yr
Wind risk 3/10 · Minor
- Chance of severe wind over 30 yrs
- 4.0%
Air-quality risk 2/10 · Minimal
- Unhealthy air days now
- 1 days/yr
- Unhealthy air days in 30 yrs
- 2 days/yr
Risk factors via First Street. Map © Google.
Why this score? — see what drove the C- grade
The composite is a weighted blend of 9 inputs, each scored 0–100. Each bar is that input's sub-score; the figure is the points it added to the 100-point composite (weight × sub-score).
- Cash flow +18.0/30.0
- Appreciation +7.8/10.0
- DSCR +5.7/10.0
- 1% rule +4.8/10.0
- ARV discount +4.2/15.0
- Livability +3.6/5.0
- Rent growth +2.5/5.0
- Condition / age +2.5/5.0
- Schools +2.0/10.0
$144,900
🖨 Deal sheet 📄 Offer letter ✓ Due diligence
Listing remarks MLS
Beautifully maintained home 4 nice size Bedrooms & 1 Full Bath. . Quiet street, and above ground pool. . Move in ready! This is a beautiful home Call today !!1
Key facts
- Garage
- Listed 48 days
Property features AI
Finance
- Financial info: Annual property tax reported
Exterior
- Parking: Detached 1-car garage
- Utilities: Public water service; Public sewer service
- Home design: Single-family residence; Two stories
- Construction: Aluminum siding
- Exterior features: Residential zoning; Public water; Public sewer
Interior
- Bathrooms: One full bathroom
- Heating & cooling: Oil heating with baseboard radiators
- Interior features: Partially finished basement; Five total rooms
Neighborhood map
What this means for you Summary
Snapshot
- This is a 3-bed/1.0-bath single-family listed at $145k.
Deal economics
- At list price, monthly cash flow is $125 ($2k/yr) — positive.
- The deal already cash-flows at list — no discount required.
- To meet the 1% rule (rent ≥ 1% of price), the offer needs to be $142k (2.1% below list).
- Recommended offer: $141k (3.0% below list) — sets the bar for market timing.
Location & tenants
- Location reads 72/100 on livability (#609 in PA) — a middle-class / working-renter tenant base. Strengths: crime A+, cost of living A+, housing A+; Watch: amenities F, commute F.
- Greater Nanticoke Area SD (suburban): math 14% / reading 34% proficiency, ranked #479 of 539 in PA (top 89%) — low school quality limits family demand, transient renter base, plan for 1-2y turnover.
- Market conditions: 20 active listings in the ZIP; 3 comparable units currently listed for rent nearby; rentals at typical pace (median 14d on market — plan ~3-4 weeks tenant-placement turnaround); 349 units permitted in Luzerne County in 2024 (16 in 5+ unit buildings).
Forward outlook
- In year one you build about $9k of equity ($1k loan paydown + $8k appreciation (5.6% local appreciation)).
- Luzerne County population projected at +4% by 2050 — modest demand growth; plan on rents tracking national, not racing it.
- At projected returns (5.6% appreciation + 3.0% rent growth), your $41k cash investment doubles in ~4 years — after that, you're playing with house money.
- By year 4, paydown + projected appreciation supports a ~$31k cash-out refi (75% LTV) — recoverable capital for the next deal without selling this one.
Negotiation context
- It's been on market 48 days — a 3% lower offer ($141k) is reasonable based on typical stale-listing flexibility.
- 2 sale attempts since 8y ago; this cycle's ask has dropped $25k (15%) from the opening price — seller is motivated, your offer sets the floor, not the list.
- Current owner paid $112k; 29% above their basis — modest negotiation headroom, anchor on the comps not their cost.
Risks & watch-outs
- Watch-outs: built in 1930 — expect roof / HVAC / electrical / plumbing capex.
Questions for the listing agent
- It's been on market 48 days. Have you received any prior offers? Is the seller open to a 3% concession, seller financing, or rate buy-down credit?
- Built in 1930 — when were the roof, HVAC, electrical panel, plumbing, and water heater last replaced?
- Is there a deadline driving the sale (1031 exchange, divorce, estate, relocation)? That informs how much negotiation room exists.
- What's the average days-on-market for RENTAL listings here right now (not sales)? A rising rental-DOM trend means longer vacancies and softer asking-rent achievability than the comps imply.
- What's the recent tenant-quality profile in this submarket — average credit score on applications, eviction rate, late-payment / NSF rate, and stable-employment percentage? A property-management company in the area should have these aggregated.
- How much new for-sale + rental construction is in the pipeline within 1–3 miles? Heavy new supply typically softens prices + rents 12–24 months out; constrained supply supports both.
Investment metrics
- 1% rule
- 0.98% ✗
- Cap rate
- 7.33%
- Cash-on-cash
- 3.71%
- DSCR
- 1.17
- GRM
- 8.5
CMA / ARV
- ARV (median comp)
- $135,138
- List price
- $144,900
- Delta
- 7.22%
- Verdict
- FAIR
- Comps
- 20 within 1.0 mi
Show comp detail 3 sales within ~0.75 mi
| Address | Dist | Beds/Ba | Sqft | Sold | Price | $/sf | Match |
|---|---|---|---|---|---|---|---|
| 146 Railroad St | 0.30mi | 3/1.0 | 2,037 (+10%) | 11mo | $166,000 | $81 | 60 |
| 8 Chestnut St | 0.54mi | 3/1.0 | 1,806 (-2%) | 16mo | $40,000 | $22 | 58 |
| 5 Orchard St | 0.54mi | 3/2.0 | 1,743 (-6%) | 11mo | $172,500 | $99 | 52 |
Match score weights: distance 35% · size 25% · config 20% · recency 20%. Top-matched comps best support the ARV.
Projected returns pro-forma
5.58% appreciation · 3.0% rent growth · sell at horizon
- IRR
- 17.4%
- Equity multiple
- 2.14×
- Total profit
- $46,249
- Equity at exit
- $87,269
- IRR
- 17.3%
- Equity multiple
- 4.23×
- Total profit
- $130,862
- Equity at exit
- $155,060
Cash invested: $40,572 (down + closing). Projections, not guarantees.
Landlord ↔ Tenant lean methodology
- Overall (STATE)
- 62 Landlord-Friendly
- State Pennsylvania
- 62 Landlord-Friendly · EVEN
- County
- — inherits STATE
- City
- — inherits STATE
ZIP-level market 18617
- Home prices YoY
- 2.0%
- Active inventory
- 20
- Price-to-rent
- 8.5×
Monthly cashflow live
- Estimated rent
- $1,418 medium interval (Pro) →
- Mortgage (P&I)
- −$760
- Tax from tax record
- −$175 /mo · $2,096/yr
- Insurance
- −$60
- HOA
- −$0
- Vacancy / Maint / Mgmt
- −$298
- Net cashflow
- $125
Break-even live
UW: 25.0% down · 7.5% · 30yr · 1.5% tax · 5.0% vac · 8.0% maint · 8.0% mgmt
Financing live
Cash to close
- Down payment
- $36,225
- Closing costs
- $4,347
- Reserves months
- —
- Total cash needed
- —
Loan-product check · same deal, 3 products live
Conventional
25% down · 7.5% · 30yr
- Down + closing
- —
- Monthly P&I
- —
- Monthly cashflow
- —
- DSCR
- —
- Eligible?
- —
Personal DTI + credit; lowest rate.
DSCR
20% down · 8.5% · 30yr
- Down + closing
- —
- Monthly P&I
- —
- Monthly cashflow
- —
- DSCR
- —
- Eligible?
- —
No personal income docs; deal must DSCR.
Hard money
10% down · 12.0% · 12mo
- Down + closing
- —
- Monthly P&I
- —
- Monthly cashflow
- —
- DSCR
- —
- Eligible?
- —
Short-term bridge; refi at stabilization.
Rent comps 3 comps
| Address | Beds | Baths | Sqft | Rent | $/sqft | DOM | Units | Dist |
|---|---|---|---|---|---|---|---|---|
| 17 W Main St Glen Lyon, PA | 4.0 | 1.0 | 2000 | $1,650 | $0.82 | 14d | 1 | 0.67mi |
| 34 Arch St Glen Lyon, PA | 3.0 | 2.0 | 1600 | $1,250 | $0.78 | 14d | 1 | 0.91mi |
| 34 Arch St Unit 1 Glen Lyon, PA | 3.0 | 2.0 | 1600 | $1,250 | $0.78 | 44d | 1 | 0.91mi |
Listing history 21 events
-
2026-06-18days on market $144,900 Active 48 DOM
-
2026-06-17days on market $144,900 Active 47 DOM
-
2026-06-16days on market $144,900 Active 46 DOM
-
2026-06-15days on market $144,900 Active 45 DOM
-
2026-06-14days on market $144,900 Active 43 DOM
-
2026-06-13pricedays on market $144,900 Active 42 DOM
-
2026-06-10days on market $149,900 Active 40 DOM
-
2026-06-09days on market $149,900 Active 39 DOM
-
2026-06-08days on market $149,900 Active 38 DOM
-
2026-06-07days on market $149,900 Active 37 DOM
-
2026-06-05days on market $149,900 Active 34 DOM
-
2026-06-02days on market $149,900 Active 32 DOM
-
2026-06-01days on market $149,900 Active 31 DOM
-
2026-05-31days on market $149,900 Active 30 DOM
-
2026-05-30days on market $149,900 Active 29 DOM
-
2026-05-13price $159,900 237-char remark
-
2026-05-01$169,900 Active 237-char remark
-
2021-08-23soldstatus $112,000
-
2019-06-20soldstatus $106,000
-
2019-05-20soldstatus $106,000 168-char remark
Show marketing remark (168 chars)
Beautifully maintained home 4 nice size Bedrooms & 1 Full Bath. . Quiet street, and above ground pool. . Move in ready! This is a beautiful home Call today !!1
-
2018-11-23$117,500 168-char remark
Show marketing remark (168 chars)
Beautifully maintained home 4 nice size Bedrooms & 1 Full Bath. . Quiet street, and above ground pool. . Move in ready! This is a beautiful home Call today !!1
ⓘ Source: listings_history table (triggers on properties + properties_extension) + one-shot
backfill from property_details.listing_events for pre-trigger history.
Tax reassessment forecast PA · Partial reset (capped growth)
- Current annual tax
- $2,096 · $175/mo
- Projected year-2 tax
- $2,193 · $183/mo
- Expected delta
- +$97/yr (+$8/mo · 4.6%)
ⓘ Screening estimate from a state-policy table — verify with the county assessor before closing.
Climate risk First Street
- Flood 1/10 Low FEMA zone X (unshaded) · 0% chance over 30 yrs
- Wildfire 4/10 Moderate
- Heat 3/10 Moderate 7 d/yr ≥94°F today · 16 d/yr by 30 yrs out
- Wind 3/10 Moderate 4% chance of damaging wind over 30 yrs
- Air quality 2/10 Low 1 unhealthy d/yr today · 2 by 30 yrs out
Nearby sold comps map
Loading sold comps map…
Walkable amenities ~0.75 mi
Loading nearby amenities…
Taxation est. · year 1
- Rental income
- $17,018
- − Mortgage interest
- −$8,117
- − Property taxes
- −$2,096
- − Insurance
- −$724
- − Repairs & maintenance
- −$1,361
- − Management
- −$1,361
- − Depreciation
- −$4,215
- Taxable loss
- −$857
- Est. tax savings @ 24.0%
- +$206
- After-tax cash flow
- $1,711/yr
For passive investors: Depreciation is non-cash, so a rental often shows a tax loss while cash-flowing — sheltering income. Rental losses are passive: they offset passive income freely, and up to $25,000/yr can offset ordinary (W-2) income if you actively participate and your MAGI is under $100k (phasing out to $0 by $150k); unused losses carry forward. On sale, claimed depreciation is recaptured at up to 25%, and gains may owe capital-gains tax (a 1031 exchange can defer both). Figures are a year-1 estimate at your 24.0% rate — not tax advice; consult a CPA.
Schools (NCES district)
- District
- Greater Nanticoke Area SD
- NCES district ID
- 4216290
- Math proficiency
- 14% ▼ -8.00%
- Reading proficiency
- 34% ▼ -14.00%
- Median HH income
- $38,990
- Composite
- 20.1/100
- National rank
- #8647
- State rank
- #479 of 539 in PA
Livability — Newport
- Score
- 72/100
- State rank
- #609
- US rank
- #5859
Category grades
Schools grade is shown separately in the Schools card above.
Census & demographics
- Census place
- Glen Lyon, PA
- Population (ZIP)
- 1,616
Population outlook (Luzerne County) Hauer SSP2
- Today (2025)
- 319,505 people
- By 2030
- 319,943 · +0.1%
- By 2040
- 322,643 · +1.0%
- By 2050
- 330,817 · +3.5%
- By 2075
- 379,145 · +18.7%
- By 2100
- 431,908 · +35.2%
Race, ethnicity, and origin ACS 2023
- Neighborhood character
- Predominantly White (81%)
- Race & ethnicity
- White 81% Two or more races 10% Black 6% Asian 3% Hispanic / Latino 1%
- Common ancestry
- Romanian 45% Scotch-Irish 6% Iranian 1%
- Foreign-born
- 1% · Canada
- Languages at home
- 98% English-only · Other Indo-European 1% Spanish 1%
Political lean MEDSL · Luzerne
- 2024 margin
- R (+19.2) · D 40.0% · R 59.2%
- 2008→2024 swing
- -27.6pp toward R · 2008: 8.4pp · 2024: -19.2pp
- All cycles
- 2024: R+19.2 2020: R+14.4 2016: R+19.6 2012: D+4.8 2008: D+8.4
Not yet ingested
- Civics
- —
Market trends
- HPI YoY
- ▲ 5.58%
- Current HPI
- 278.0674
- Rent YoY
- —
- Metro
- —
- State GDP YoY
- ▲ 1.68%
- F500 in state
- 34
Industry mix (Fortune 500 HQ in PA)
| Industry | F500 HQs | Revenue |
|---|---|---|
| Healthcare | 2 | $309B |
|
||
| Insurance | 2 | $27B |
|
||
| Telecommunications / Media | 1 | $124B |
|
||
| Industrial Distribution | 1 | $22B |
|
||
| Financial Services | 1 | $20B |
|
||
| Chemicals / Materials | 1 | $18B |
|
||
Price history
+23.3% since first listed8 events — show timeline
- 2026-06-10 Price Changed $144,900 LCAR
- 2026-05-21 Price Changed $149,900 LCAR
- 2026-05-13 Price Changed $159,900 LCAR
- 2026-05-01 Listed $169,900 LCAR
- 2021-08-23 Sold (Public Records) $112,000 Public Records
- 2019-06-20 Sold (Public Records) $106,000 Public Records
- 2019-05-20 Sold (MLS) $106,000 LCAR
- 2018-11-23 Listed $117,500 LCAR
Property tax history
+3.1%/yrLatest (2026): $2,096 · +9.9% YoY. Source: county tax records.
Cash-flow waterfall
monthlySold comps — $/sqft
last 12 mo · ≤1 miLoading sold comps…