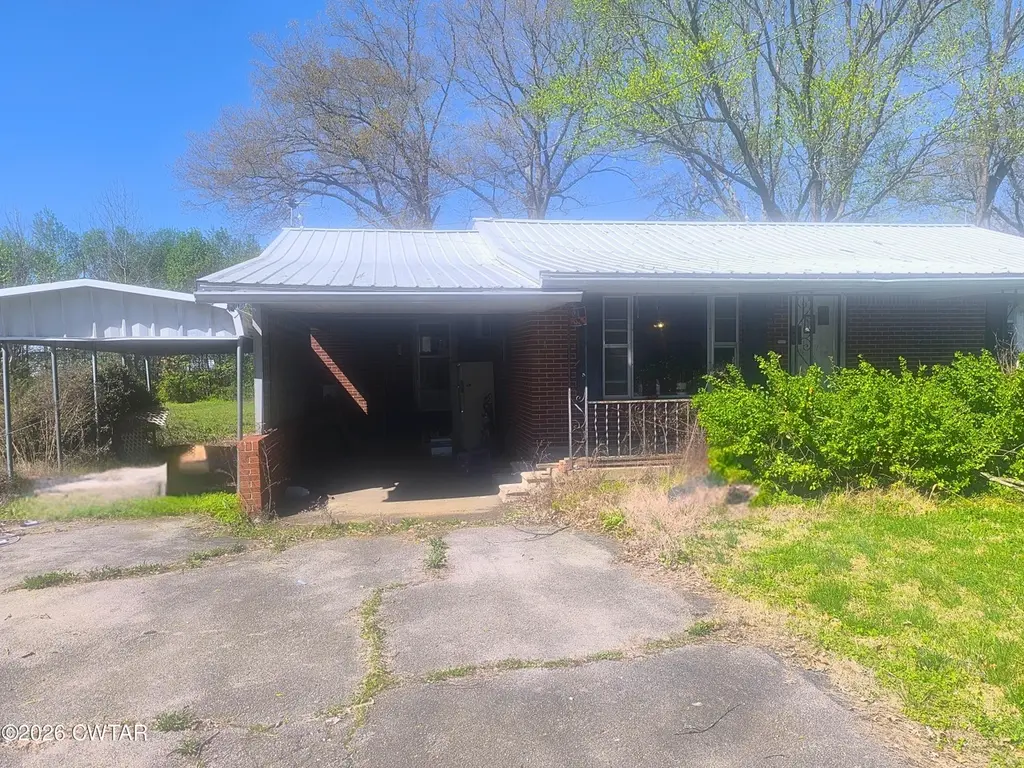
70 Tn-140 · Cottage Grove, TN
Flood risk 1/10 · Minimal
- FEMA flood zone
- X (unshaded)
- Chance of flooding over 30 yrs
- 0.0%
- Est. flood insurance / yr
- $507 – $1,088
Fire risk 2/10 · Minimal
- Est. fire insurance / yr
- $949 – $1,763
Heat risk 6/10 · Moderate
- Hot days now (above 107°F)
- 7 days/yr
- Hot days in 30 yrs
- 20 days/yr
Wind risk 4/10 · Minor
- Chance of severe wind over 30 yrs
- 10.0%
Air-quality risk 1/10 · Minimal
- Unhealthy air days now
- 0 days/yr
- Unhealthy air days in 30 yrs
- 0 days/yr
Risk factors via First Street. Map © Google.
Why this score? — see what drove the B grade
The composite is a weighted blend of 9 inputs, each scored 0–100. Each bar is that input's sub-score; the figure is the points it added to the 100-point composite (weight × sub-score).
- Cash flow +30.0/30.0
- DSCR +10.0/10.0
- 1% rule +9.0/10.0
- ARV discount +7.5/15.0
- Appreciation +5.5/10.0
- Livability +2.6/5.0
- Rent growth +2.5/5.0
- Schools +2.5/10.0
- Condition / age +1.0/5.0
$70,000
🖨 Deal sheet 📄 Offer letter ✓ Due diligence
Key facts
- 0.35 acre lot
- 2 parking spots
- Built 1971
Property features AI
Exterior
- Parking: 2 total parking spaces; 2-car carport; 2 open parking spaces
- Utilities: Private water source; Electricity connected; Sewer connected; Water connected
- Home design: Single-family residence; One story
- Construction: Brick construction; Metal roof; Single-level foundation (one story)
- Exterior features: Asphalt road frontage on a public maintained highway
Interior
- Bedrooms: 2 bedrooms on the main level
- Bathrooms: 1 full bathroom on the main level
- Heating & cooling: Ceiling fan cooling
- Interior features: Ceiling fans
- Laundry & utility: Dedicated laundry room
Neighborhood map
What this means for you Summary
Snapshot
- This is a 2-bed/1.0-bath single-family listed at $70k. Condition is rated poor.
Deal economics
- At list price, monthly cash flow is $290 ($3k/yr) — positive.
- The deal already cash-flows at list — no discount required.
- Meets the 1% rule at list price ($980 rent vs $70k).
- Recommended offer: $68k (3.0% below list) — sets the bar for market timing.
Location & tenants
- Location reads 52/100 on livability (#399 in TN) — a working-class tenant base; expect higher turnover. Strengths: cost of living A+, crime A; Watch: schools F, amenities F, commute F.
- Henry County (rural): math 30% / reading 30% proficiency, ranked #60 of 139 in TN (top 43%) — families likely to look elsewhere, expect single-tenant / working-renter base with shorter leases.
- Market conditions: 18 active listings in the ZIP; 19 units permitted in Henry County in 2024 (0 in 5+ unit buildings).
Forward outlook
- In year one you build about $1k of equity ($484 loan paydown + $691 appreciation (1.0% local appreciation)).
- Henry County population projected to shrink 10% by 2050 — rents likely to lag national; underwrite the cash flow, not the appreciation.
- At projected returns (1.0% appreciation + 3.0% rent growth), your $20k cash investment doubles in ~4 years — after that, you're playing with house money.
Negotiation context
- It's been on market 57 days — a 3% lower offer ($68k) is reasonable based on typical stale-listing flexibility.
Risks & watch-outs
- Climate carrying-cost: extreme-heat days projected 7→20/yr by 2055 (HVAC capex compounding) — expect insurance premiums to compound above CPI over the hold.
Questions for the listing agent
- It's been on market 57 days. Have you received any prior offers? Is the seller open to a 3% concession, seller financing, or rate buy-down credit?
- Have any recent inspections been done? Can we get a copy of the seller's disclosures and any deferred-maintenance estimates?
- Built in 1971 — when were the roof, HVAC, electrical panel, plumbing, and water heater last replaced?
- Is there a deadline driving the sale (1031 exchange, divorce, estate, relocation)? That informs how much negotiation room exists.
- Schools are F-rated, which usually means shorter tenancies and higher turnover. Who's the typical renter profile here, and what's been the actual vacancy rate?
- What's the average days-on-market for RENTAL listings here right now (not sales)? A rising rental-DOM trend means longer vacancies and softer asking-rent achievability than the comps imply.
- What's the recent tenant-quality profile in this submarket — average credit score on applications, eviction rate, late-payment / NSF rate, and stable-employment percentage? A property-management company in the area should have these aggregated.
- How much new for-sale + rental construction is in the pipeline within 1–3 miles? Heavy new supply typically softens prices + rents 12–24 months out; constrained supply supports both.
Investment metrics
- 1% rule
- 1.40% ✓
- Cap rate
- 11.27%
- Cash-on-cash
- 17.78%
- DSCR
- 1.79
- GRM
- 6.0
CMA / ARV
No comps found within radius.
Projected returns pro-forma
0.99% appreciation · 3.0% rent growth · sell at horizon
- IRR
- 19.8%
- Equity multiple
- 2.01×
- Total profit
- $19,773
- Equity at exit
- $23,852
- IRR
- 22.9%
- Equity multiple
- 3.76×
- Total profit
- $54,183
- Equity at exit
- $31,663
Cash invested: $19,600 (down + closing). Projections, not guarantees.
Landlord ↔ Tenant lean methodology
- Overall (STATE)
- 87 Strongly Landlord-Friendly
- State Tennessee
- 87 Strongly Landlord-Friendly · R+13
- County
- — inherits STATE
- City
- — inherits STATE
ZIP-level market 38229
- Home prices YoY
- 0.5%
- Active inventory
- 18
- Price-to-rent
- 6.0×
Monthly cashflow live
- Estimated rent
- $980 medium interval (Pro) →
- Mortgage (P&I)
- −$367
- Tax est. 1.5%
- −$88 /mo · $1,050/yr
- Insurance
- −$29
- HOA
- −$0
- Vacancy / Maint / Mgmt
- −$206
- Net cashflow
- $290
Break-even live
UW: 25.0% down · 7.5% · 30yr · 1.5% tax · 5.0% vac · 8.0% maint · 8.0% mgmt
Financing live
Cash to close
- Down payment
- $17,500
- Closing costs
- $2,100
- Reserves months
- —
- Total cash needed
- —
Loan-product check · same deal, 3 products live
Conventional
25% down · 7.5% · 30yr
- Down + closing
- —
- Monthly P&I
- —
- Monthly cashflow
- —
- DSCR
- —
- Eligible?
- —
Personal DTI + credit; lowest rate.
DSCR
20% down · 8.5% · 30yr
- Down + closing
- —
- Monthly P&I
- —
- Monthly cashflow
- —
- DSCR
- —
- Eligible?
- —
No personal income docs; deal must DSCR.
Hard money
10% down · 12.0% · 12mo
- Down + closing
- —
- Monthly P&I
- —
- Monthly cashflow
- —
- DSCR
- —
- Eligible?
- —
Short-term bridge; refi at stabilization.
Listing history 3 events
-
2026-05-19status Pending
-
2026-04-24price $70,000
-
2026-03-16$75,000 Active
ⓘ Source: listings_history table (triggers on properties + properties_extension) + one-shot
backfill from property_details.listing_events for pre-trigger history.
Climate risk First Street
- Flood 1/10 Low FEMA zone X (unshaded) · 0% chance over 30 yrs
- Wildfire 2/10 Low
- Heat 6/10 Major 7 d/yr ≥107°F today · 20 d/yr by 30 yrs out
- Wind 4/10 Moderate 10% chance of damaging wind over 30 yrs
- Air quality 1/10 Low 0 unhealthy d/yr today · 0 by 30 yrs out
Nearby sold comps map
Loading sold comps map…
Walkable amenities ~0.75 mi
Loading nearby amenities…
Taxation est. · year 1
- Rental income
- $11,758
- − Mortgage interest
- −$3,921
- − Property taxes
- −$1,050
- − Insurance
- −$350
- − Repairs & maintenance
- −$941
- − Management
- −$941
- − Depreciation
- −$2,036
- Taxable income
- $2,520
- Est. tax owed @ 24.0%
- −$605
- After-tax cash flow
- $2,879/yr
For passive investors: Depreciation is non-cash, so a rental often shows a tax loss while cash-flowing — sheltering income. Rental losses are passive: they offset passive income freely, and up to $25,000/yr can offset ordinary (W-2) income if you actively participate and your MAGI is under $100k (phasing out to $0 by $150k); unused losses carry forward. On sale, claimed depreciation is recaptured at up to 25%, and gains may owe capital-gains tax (a 1031 exchange can defer both). Figures are a year-1 estimate at your 24.0% rate — not tax advice; consult a CPA.
Condition & rehab AI · 13 photos
The property requires extensive repairs and maintenance, including structural repairs, painting, and landscaping. Immediate action is needed to ensure safety and improve the property's value.
Repairs flagged
- Major Exposed ceiling — Structural damage
- Major Exposed subfloor — Structural damage
- Major Exposed foundation — Structural damage
- Major Overgrown vegetation — Safety hazard
Value-add opportunities
- Both Painting and cleaning — Improves appearance and safety
- Both Landscaping — Enhances curb appeal and safety
- Both Structural repairs — Ensures safety and stability
Renovation cost estimate screening
| Repair item | Severity | Est. cost |
|---|---|---|
| Exposed ceiling · Structural damage | Major | $15,000–50,000 |
| Exposed subfloor · Structural damage | Major | $15,000–50,000 |
| Exposed foundation · Structural damage | Major | $15,000–50,000 |
| Overgrown vegetation · Safety hazard | Major | $15,000–50,000 |
| Total estimated repair cost · 4 items | $60,000–200,000 |
Value-add ROI direction
- Both Painting and cleaning — Improves appearance and safety ↑
- Both Landscaping — Enhances curb appeal and safety ↑
- Both Structural repairs — Ensures safety and stability ↑
ⓘ Cost ranges are severity-bucket heuristics (US national rule-of-thumb). Get contractor quotes + a written scope before underwriting a rehab budget.
Schools (NCES district)
- District
- Henry County
- NCES district ID
- 4701830
- Math proficiency
- 30% ▼ -3.00%
- Reading proficiency
- 30% ▼ -6.00%
- Median HH income
- $41,770
- Composite
- 25.42/100
- National rank
- #7457
- State rank
- #60 of 139 in TN
Livability — Cottage Grove
- Score
- 52/100
- State rank
- #399
- US rank
- #24875
Category grades
Schools grade is shown separately in the Schools card above.
Census & demographics
- Population (ZIP)
- 2,509
Population outlook (Henry County) Hauer SSP2
- Today (2025)
- 31,750 people
- By 2030
- 31,277 · -1.5%
- By 2040
- 30,064 · -5.3%
- By 2050
- 28,675 · -9.7%
- By 2075
- 25,767 · -18.8%
- By 2100
- 22,318 · -29.7%
Race, ethnicity, and origin ACS 2023
- Neighborhood character
- Predominantly White (93%)
- Race & ethnicity
- White 93% Hispanic / Latino 2% Two or more races 2% Black 1%
- Common ancestry
- Slovak 2% Italian 1%
- Foreign-born
- 0%
- Languages at home
- 97% English-only · Spanish 3%
Political lean MEDSL · Henry
- 2024 margin
- Solid R (+55.3) · D 21.8% · R 77.1% · Other 1.1%
- 2008→2024 swing
- -33.0pp toward R · 2008: -22.4pp · 2024: -55.3pp
- All cycles
- 2024: R+55.3 2020: R+51.1 2016: R+49.8 2012: R+30.2 2008: R+22.4
Not yet ingested
- Civics
- —
Market trends
- HPI YoY
- ▲ 0.99%
- Current HPI
- 215.6697
- Rent YoY
- —
- Metro
- —
- State GDP YoY
- ▲ 2.78%
- F500 in state
- 22
Industry mix (Fortune 500 HQ in TN)
| Industry | F500 HQs | Revenue |
|---|---|---|
| Healthcare | 3 | $91B |
|
||
| Retail | 3 | $72B |
|
||
| Transportation / Logistics | 1 | $88B |
|
||
| Paper / Packaging | 1 | $19B |
|
||
| Insurance | 1 | $13B |
|
||
| Energy | 1 | $12B |
|
||
Price history
-6.7% since first listed3 events — show timeline
- 2026-05-19 Pending — CWTAR
- 2026-04-24 Price Changed $70,000 CWTAR
- 2026-03-16 Listed $75,000 CWTAR
Cash-flow waterfall
monthlySold comps — $/sqft
last 12 mo · ≤1 miLoading sold comps…