637 Pinellas Bayway S · Tierra Verde, FL
Flood risk 9/10 · Severe
- FEMA flood zone
- AE
- Chance of flooding over 30 yrs
- 0.99%
- Est. flood insurance / yr
- $1,737 – $8,500
Fire risk 1/10 · Minimal
- Est. fire insurance / yr
- $947 – $1,759
Heat risk 10/10 · Severe
- Hot days now (above 106°F)
- 7 days/yr
- Hot days in 30 yrs
- 28 days/yr
Wind risk 10/10 · Severe
- Chance of severe wind over 30 yrs
- 99.0%
Air-quality risk 3/10 · Minor
- Unhealthy air days now
- 3 days/yr
- Unhealthy air days in 30 yrs
- 3 days/yr
Risk factors via First Street. Map © Google.
Why this score? — see what drove the D+ grade
The composite is a weighted blend of 9 inputs, each scored 0–100. Each bar is that input's sub-score; the figure is the points it added to the 100-point composite (weight × sub-score).
- Cash flow +14.0/30.0
- ARV discount +7.5/15.0
- Appreciation +4.9/10.0
- DSCR +4.3/10.0
- Schools +4.3/10.0
- 1% rule +3.9/10.0
- Livability +3.2/5.0
- Rent growth +2.5/5.0
- Condition / age +2.2/5.0
$420,000
🖨 Deal sheet 📄 Offer letter ✓ Due diligence
Listing remarks
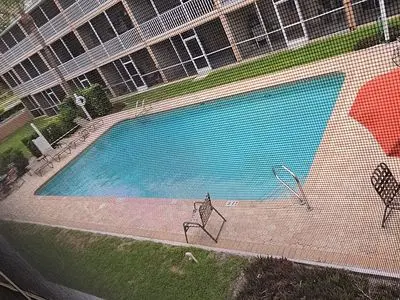
Prestigious condo located on one of the most desired locations in the Tampa Bay Area. St. Pete Beaches and Ft Desoto Park 5 minutes away. Walking distance to several Tierra Verde restaurants, bars, and shops. Large community pool.
Key facts
- Built 1991
- Listed 9 days
Neighborhood map
What this means for you Summary
Snapshot
- This is a 2-bed/3.0-bath other listed at $420k. Condition is rated fair.
Deal economics
- At list price, monthly cash flow is $-369 ($-4k/yr) — negative.
- To cash-flow at today's rent, offer at most $367k (12.7% below list).
- To meet the 1% rule (rent ≥ 1% of price), the offer needs to be $375k (10.8% below list).
- Recommended offer: $367k (12.7% below list) — sets the bar for cash-flow.
- Cap rate 6.5% vs local median 1.1% in Tierra Verde — top-decile yield for the area; either an underpriced asset or a hidden risk that comps aren't pricing in. Stress-test before assuming the spread holds.
Location & tenants
- Location reads 65/100 on livability (#646 in FL) — a middle-class / working-renter tenant base. Strengths: crime A+, employment A+, housing A+; Watch: schools D+, amenities F, commute F.
- Pinellas (suburban): math 51% / reading 51% proficiency, ranked #31 of 73 in FL (top 42%) — acceptable for families but not a draw, mixed tenant base, ~2y average lease.
- Market conditions: 282 active listings in the ZIP; 26 comparable units currently listed for rent nearby; rentals at typical pace (median 18d on market — plan ~3-4 weeks tenant-placement turnaround); solid renter incomes; 2,676 units permitted in Pinellas County in 2024 (1,422 in 5+ unit buildings).
- This rent runs 44% of the median local income ($103k/yr) — at the standard rent-burdened threshold; future hikes will face affordability resistance.
Forward outlook
- In year one you build about $2k of equity ($3k loan paydown + $-651 appreciation (-0.1% local appreciation)).
- Pinellas County population projected at +14% by 2050 — modest demand growth; plan on rents tracking national, not racing it.
- By year 9, paydown + projected appreciation supports a ~$32k cash-out refi (75% LTV) — recoverable capital for the next deal without selling this one.
Negotiation context
- Only 10 days on market — expect competitive offers; lowballing is unlikely to land.
Risks & watch-outs
- Watch-outs: flood insurance adds $427/mo.
- Climate carrying-cost: in FEMA flood zone AE (mandatory federal flood insurance); severe wind risk, 99% chance of damaging wind over 30y; extreme-heat days projected 7→28/yr by 2055 (HVAC capex compounding) — expect insurance premiums to compound above CPI over the hold.
Questions for the listing agent
- What do current leases actually rent for vs. the listed asking? Can we see a recent rent roll and the last 12 months of T-12 income?
- Have any recent inspections been done? Can we get a copy of the seller's disclosures and any deferred-maintenance estimates?
- What's the actual annual flood-insurance premium (NFIP or private), and is the property in a SFHA with mandatory coverage?
- Is there a deadline driving the sale (1031 exchange, divorce, estate, relocation)? That informs how much negotiation room exists.
- Schools are D-rated, which usually means shorter tenancies and higher turnover. Who's the typical renter profile here, and what's been the actual vacancy rate?
- The area grade is low — what's the realistic commute time and amenity access for the typical tenant pool here? Any planned neighborhood developments (good or bad) we should know about?
- What's the average days-on-market for RENTAL listings here right now (not sales)? A rising rental-DOM trend means longer vacancies and softer asking-rent achievability than the comps imply.
- What's the recent tenant-quality profile in this submarket — average credit score on applications, eviction rate, late-payment / NSF rate, and stable-employment percentage? A property-management company in the area should have these aggregated.
- How much new for-sale + rental construction is in the pipeline within 1–3 miles? Heavy new supply typically softens prices + rents 12–24 months out; constrained supply supports both.
Investment metrics
- 1% rule
- 0.89% ✗
- Cap rate
- 6.46%
- Cash-on-cash
- 0.59%
- DSCR
- 1.03
- GRM
- 9.3
CMA / ARV
No comps found within radius.
Projected returns pro-forma
-0.15% appreciation · 3.0% rent growth · sell at horizon
- IRR
- -7.1%
- Equity multiple
- 0.67×
- Total profit
- $-38,527
- Equity at exit
- $118,712
- IRR
- -0.9%
- Equity multiple
- 0.91×
- Total profit
- $-10,847
- Equity at exit
- $140,135
Cash invested: $117,600 (down + closing). Projections, not guarantees.
Landlord ↔ Tenant lean methodology
- Overall (STATE)
- 87 Strongly Landlord-Friendly
- State Florida
- 87 Strongly Landlord-Friendly · R+3
- County
- — inherits STATE
- City
- — inherits STATE
ZIP-level market 33715
- Home prices YoY
- -0.1%
- Active inventory
- 282
- Price-to-rent
- 9.3×
Monthly cashflow live
- Estimated rent
- $3,747 high interval (Pro) →
- Mortgage (P&I)
- −$2,203
- Tax est. 1.5%
- −$525 /mo · $6,300/yr
- Insurance
- −$175
- Flood insurance flood zone
- −$427 /mo · $5,118/yr
- HOA
- −$0
- Vacancy / Maint / Mgmt
- −$787
- Net cashflow
- $-369
Break-even live
UW: 25.0% down · 7.5% · 30yr · 1.5% tax · 5.0% vac · 8.0% maint · 8.0% mgmt
Financing live
Cash to close
- Down payment
- $105,000
- Closing costs
- $12,600
- Reserves months
- —
- Total cash needed
- —
Loan-product check · same deal, 3 products live
Conventional
25% down · 7.5% · 30yr
- Down + closing
- —
- Monthly P&I
- —
- Monthly cashflow
- —
- DSCR
- —
- Eligible?
- —
Personal DTI + credit; lowest rate.
DSCR
20% down · 8.5% · 30yr
- Down + closing
- —
- Monthly P&I
- —
- Monthly cashflow
- —
- DSCR
- —
- Eligible?
- —
No personal income docs; deal must DSCR.
Hard money
10% down · 12.0% · 12mo
- Down + closing
- —
- Monthly P&I
- —
- Monthly cashflow
- —
- DSCR
- —
- Eligible?
- —
Short-term bridge; refi at stabilization.
Rent comps 26 comps
| Address | Beds | Baths | Sqft | Rent | $/sqft | DOM | Units | Dist |
|---|---|---|---|---|---|---|---|---|
| 637 Pinellas Bayway Unit 105 Tierra Verde, FL | 2.0 | 2.5 | 1650 | $4,000 | $2.42 | 4d | 1 | 0.02mi |
| 719 Pinellas Bayway S #301 St Petersburg, FL | 2.0 | 2.0 | 1110 | $2,800 | $2.52 | 3d | 1 | 0.03mi |
| 745 Pinellas Bayway S #206 Saint Petersburg, FL | 2.0 | 2.5 | 1475 | $2,950 | $2.00 | 20d | 1 | 0.09mi |
| 745 Pinellas Bayway S #105 Saint Petersburg, FL | 2.0 | 2.5 | 1475 | $3,000 | $2.03 | 24d | 1 | 0.09mi |
| 751 Pinellas Bayway S #305 Saint Petersburg, FL | 2.0 | 2.5 | 1600 | $3,200 | $2.00 | 24d | 1 | 0.13mi |
| 910 Pinellas Bayway S #103 Saint Petersburg, FL | 2.0 | 2.0 | 1580 | $3,900 | $2.47 | 24d | 1 | 0.24mi |
| 853 2nd Ave S Tierra Verde, FL | 3.0 | 2.0 | 1841 | $4,300 | $2.34 | 24d | 1 | 0.29mi |
| 375 Madeira Cir Saint Petersburg, FL | 3.0 | 3.0 | 1585 | $4,200 | $2.65 | 14d | 1 | 0.31mi |
| 1055 Pinellas Bayway S Saint Petersburg, FL | 3.0 | 3.5 | 2236 | $6,000 | $2.68 | 2d | 1 | 0.33mi |
| 346 Madeira Cir Saint Petersburg, FL | 3.0 | 2.5 | 1585 | $3,300 | $2.08 | 3d | 1 | 0.33mi |
| 1101 Pinellas Bayway S #303 Saint Petersburg, FL | 2.0 | 2.5 | 2014 | $3,550 | $1.76 | 24d | 1 | 0.35mi |
| 1101 Pinellas Bayway S Tierra Verde, FL | 2.0 | 2.5 | 2014 | $3,700 | $1.84 | 24d | 1 | 0.36mi |
| 1117 Pinellas Bayway S #306 St Petersburg, FL | 2.0 | 2.5 | 1918 | $4,550 | $2.37 | 2d | 1 | 0.44mi |
| 1117 Pinellas Bayway S #303 St Petersburg, FL | 3.0 | 2.5 | 1918 | $3,200 | $1.67 | 17d | 1 | 0.44mi |
| 363 Pinellas Bayway S #50 Saint Petersburg, FL | 2.0 | 2.0 | 1365 | $4,800 | $3.52 | 4d | 1 | 0.44mi |
| 126 1st St E #210 Saint Petersburg, FL | 2.0 | 2.0 | 1220 | $3,700 | $3.03 | 3d | 1 | 0.60mi |
| 113 1st St E #103 Saint Petersburg, FL | 2.0 | 2.0 | 1220 | $3,750 | $3.07 | 17d | 1 | 0.67mi |
| 1575 Pinellas Bayway S Unit 1575 St. Petersburg, FL | 3.0 | 3.5 | 2100 | $3,700 | $1.76 | 24d | 1 | 0.78mi |
| 337 1st St W Saint Petersburg, FL | 3.0 | 2.0 | 1679 | $4,800 | $2.86 | 24d | 1 | 0.80mi |
| 113 4th Ave St Pete Beach, FL | 3.0 | 2.0 | 1600 | $7,500 | $4.69 | 1d | 1 | 0.86mi |
| 106 7th Ave St Pete Beach, FL | 3.0 | 3.0 | 1599 | $9,000 | $5.63 | 24d | 1 | 0.89mi |
| 108 11th Ave St Pete Beach, FL | 2.0 | 2.0 | 1079 | $7,000 | $6.49 | 24d | 1 | 0.95mi |
| 2460 E Vina del Mar Blvd St Pete Beach, FL | 3.0 | 3.0 | 2109 | $7,500 | $3.56 | 4d | 1 | 1.23mi |
| 330 N Tessier Dr St Pete Beach, FL | 2.0 | 2.0 | 1352 | $3,500 | $2.59 | 23d | 1 | 1.33mi |
| 301 N Tessier Dr Unit 1545798P St Pete Beach, FL | 3.0 | 2.0 | 1894 | $4,355 | $2.30 | 12d | 1 | 1.37mi |
| 291 N Tessier Dr St Pete Beach, FL | 3.0 | 2.0 | 1975 | $6,500 | $3.29 | 4d | 1 | 1.38mi |
Listing history 6 events
-
2026-06-15days on market $420,000 Active 10 DOM
-
2026-06-13days on market $420,000 Active 8 DOM
-
2026-06-09days on market $420,000 Active 4 DOM
-
2026-06-08days on market $420,000 Active 3 DOM
-
2026-06-07remarks 230-char remark
-
2026-06-07$420,000 Active 2 DOM
ⓘ Source: listings_history table (triggers on properties + properties_extension) + one-shot
backfill from property_details.listing_events for pre-trigger history.
Climate risk First Street
- Flood 9/10 Extreme FEMA zone AE · 99% chance over 30 yrs
- Wildfire 1/10 Low
- Heat 10/10 Extreme 7 d/yr ≥106°F today · 28 d/yr by 30 yrs out
- Wind 10/10 Extreme 99% chance of damaging wind over 30 yrs
- Air quality 3/10 Moderate 3 unhealthy d/yr today · 3 by 30 yrs out
Nearby sold comps map
Loading sold comps map…
Walkable amenities ~0.75 mi
Loading nearby amenities…
Taxation est. · year 1
- Rental income
- $44,961
- − Mortgage interest
- −$23,527
- − Property taxes
- −$6,300
- − Insurance
- −$7,219
- − Repairs & maintenance
- −$3,597
- − Management
- −$3,597
- − Depreciation
- −$12,218
- Taxable loss
- −$11,496
- Est. tax savings @ 24.0%
- +$2,759
- After-tax cash flow
- $-1,671/yr
For passive investors: Depreciation is non-cash, so a rental often shows a tax loss while cash-flowing — sheltering income. Rental losses are passive: they offset passive income freely, and up to $25,000/yr can offset ordinary (W-2) income if you actively participate and your MAGI is under $100k (phasing out to $0 by $150k); unused losses carry forward. On sale, claimed depreciation is recaptured at up to 25%, and gains may owe capital-gains tax (a 1031 exchange can defer both). Figures are a year-1 estimate at your 24.0% rate — not tax advice; consult a CPA.
Condition & rehab AI · 1 photo
The home is in fair condition with average exterior and landscaping. Minor improvements in landscaping and painting can significantly enhance its value.
Value-add opportunities
- Both Landscaping improvements — Enhances curb appeal and can attract more buyers or renters.
- Both Painting exterior siding — Fresh paint can improve the home's appearance and value.
- Both Landscaping upgrades — Aesthetic improvements can increase both resale and rental value.
Renovation cost estimate screening
Value-add ROI direction
- Both Landscaping improvements — Enhances curb appeal and can attract more buyers or renters. ↑
- Both Painting exterior siding — Fresh paint can improve the home's appearance and value. ↑
- Both Landscaping upgrades — Aesthetic improvements can increase both resale and rental value. ↑
ⓘ Cost ranges are severity-bucket heuristics (US national rule-of-thumb). Get contractor quotes + a written scope before underwriting a rehab budget.
Schools (NCES district)
- District
- Pinellas
- NCES district ID
- 1201560
- Math proficiency
- 51% ▼ -5.00%
- Reading proficiency
- 51% ▼ -3.00%
- Median HH income
- $46,270
- Composite
- 43.27/100
- National rank
- #3046
- State rank
- #31 of 73 in FL
Livability — Tierra Verde
- Score
- 65/100
- State rank
- #646
- US rank
- #12766
Category grades
Schools grade is shown separately in the Schools card above.
Census & demographics
- Census place
- Tierra Verde, FL
- County
- Pinellas County · 939,478 people
- City population
- 7,932
- Metro
- Tampa-St. Petersburg-Clearwater, FL
- Population (ZIP)
- 8,032
- Household income
- $102,782
- Rent vs Own
- Severe rent burden
- 106.0
Population outlook (Pinellas County) Hauer SSP2
- Today (2025)
- 1,027,532 people
- By 2030
- 1,063,586 · +3.5%
- By 2040
- 1,125,020 · +9.5%
- By 2050
- 1,168,637 · +13.7%
- By 2075
- 1,265,188 · +23.1%
- By 2100
- 1,260,357 · +22.7%
Race, ethnicity, and origin ACS 2023
- Neighborhood character
- Predominantly White (89%)
- Race & ethnicity
- White 89% Two or more races 5% Hispanic / Latino 5% Asian 2%
- Hispanic origin (detail)
- Puerto Rican 2%
- Common ancestry
- Romanian 6% Hungarian 3% Lithuanian 3%
- Foreign-born
- 11% · Canada, China
- Languages at home
- 88% English-only · Spanish 5% Russian/Polish/Slavic 2% Arabic 1%
Political lean MEDSL · Pinellas
- 2024 margin
- Lean R (+5.2) · D 46.9% · R 52.1%
- 2008→2024 swing
- -13.5pp toward R · 2008: 8.3pp · 2024: -5.2pp
- All cycles
- 2024: R+5.2 2020: D+0.2 2016: R+1.1 2012: D+5.6 2008: D+8.3
Not yet ingested
- Civics
- —
Market trends
- HPI YoY
- ▼ -0.15%
- Current HPI
- 264.9727
- Rent YoY
- —
- Metro
- Tampa-St. Petersburg-Clearwater, FL
- State GDP YoY
- ▲ 3.28%
- F500 in state
- 36
Industry mix (Fortune 500 HQ in FL)
| Industry | F500 HQs | Revenue |
|---|---|---|
| Industrial Technology | 2 | $29B |
|
||
| Insurance | 2 | $17B |
|
||
| Retail | 1 | $60B |
|
||
| Technology Distribution | 1 | $58B |
|
||
| Homebuilding | 1 | $35B |
|
||
| Technology Manufacturing | 1 | $35B |
|
||
Price history
1 event — show timeline
- 2026-06-06 Listed $420,000 FSBO.com
Cash-flow waterfall
monthlySold comps — $/sqft
last 12 mo · ≤1 miLoading sold comps…