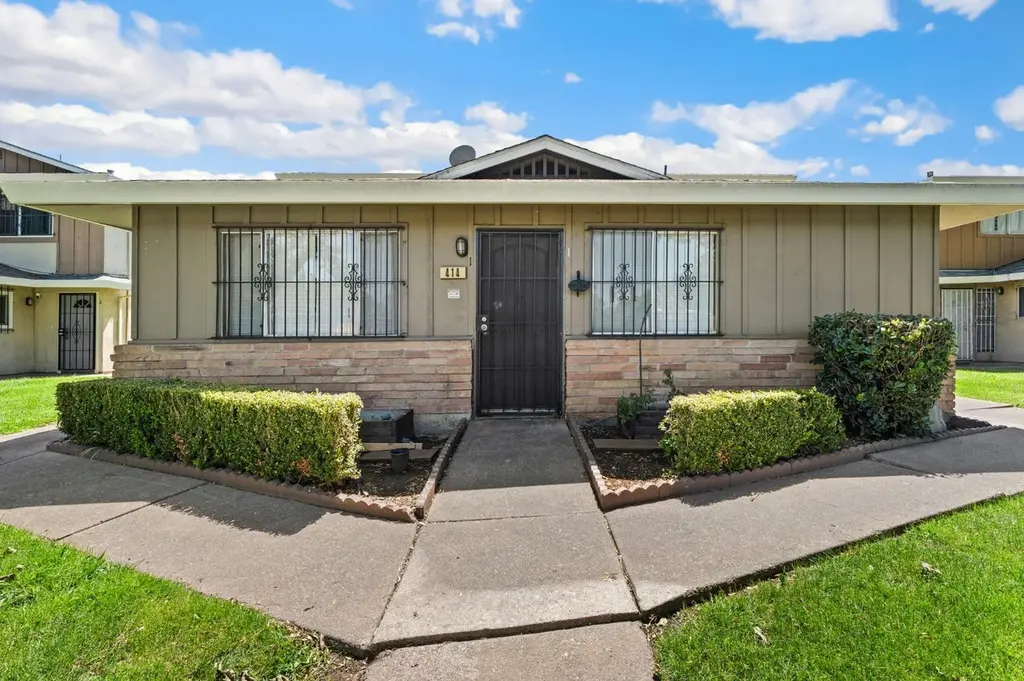
414 E Bianchi Rd #1 · Stockton, CA
Flood risk 1/10 · Minimal
- FEMA flood zone
- X
- Chance of flooding over 30 yrs
- 0.0%
- Est. flood insurance / yr
- $507 – $1,088
Fire risk 6/10 · Moderate
- Est. fire insurance / yr
- $659 – $1,223
Heat risk 7/10 · Major
- Hot days now (above 102°F)
- 7 days/yr
- Hot days in 30 yrs
- 15 days/yr
Wind risk 1/10 · Minimal
- Chance of severe wind over 30 yrs
- —
Air-quality risk 10/10 · Severe
- Unhealthy air days now
- 30 days/yr
- Unhealthy air days in 30 yrs
- 30 days/yr
Risk factors via First Street. Map © Google.
Why this score? — see what drove the C- grade
The composite is a weighted blend of 9 inputs, each scored 0–100. Each bar is that input's sub-score; the figure is the points it added to the 100-point composite (weight × sub-score).
- Cash flow +18.7/30.0
- 1% rule +9.8/10.0
- ARV discount +7.5/15.0
- DSCR +5.9/10.0
- Rent growth +3.2/5.0
- Schools +2.9/10.0
- Livability +2.9/5.0
- Condition / age +2.5/5.0
- Appreciation +0.0/10.0
$115,000
🖨 Deal sheet (PDF) 📄 Offer letter ✓ Due diligence
Listing remarks
Welcome to this 2-bed, 1-bath condo in Stockton, offering 795 square feet of comfortable first floor living. This is an excellent opportunity for first-time buyers, investors, or anyone seeking a low-maintenance and comfortable living space at a compelling price point. Featuring newer kitchen appliances, ceiling fans, and central heating and cooling, this unit has the essentials covered so you can simply move in and enjoy. Situated close to shopping, dining, schools, parks, and major roads, everything you need is just moments away whether you are commuting to work or exploring the city. Looking to build equity or generate rental income, this is a smart and accessible entry point into homeow
Key facts
- $420 HOA
- Garage
- Built 1972
Neighborhood map
What this means for you Summary
Snapshot
- This is a 2-bed/1.0-bath condo listed at $115k.
Deal economics
- At list price, monthly cash flow is $114 ($1k/yr) — positive.
- The deal already cash-flows at list — no discount required.
- Meets the 1% rule at list price ($2k rent vs $115k).
- Recommended offer: $113k (1.5% below list) — sets the bar for market timing.
- Cap rate 7.5% vs local median 3.6% in Stockton — top-decile yield for the area; either an underpriced asset or a hidden risk that comps aren't pricing in. Stress-test before assuming the spread holds.
Location & tenants
- Location reads 57/100 on livability (#734 in CA) — a working-class tenant base; expect higher turnover. Strengths: housing A+, health & safety A, amenities A-; Watch: employment C-, schools D-, crime F.
- Stockton Unified (urban): math 23% / reading 46% proficiency, ranked #295 of 517 in CA (top 57%) — families likely to look elsewhere, expect single-tenant / working-renter base with shorter leases; 78% free/reduced lunch — lower-income household profile, screen leases tightly.
- Market conditions: Rents rising (+2.7%/yr); 175 active listings in the ZIP; 40 comparable units currently listed for rent nearby; rentals at typical pace (median 22d on market — plan ~3-4 weeks tenant-placement turnaround); 3,779 units permitted in San Joaquin County in 2024 (0 in 5+ unit buildings).
Forward outlook
- Local home prices are declining (-3.0%/yr); year-one equity from $795 of loan paydown is wiped out by about $3k of value loss. Plan a longer hold.
- San Joaquin County population projected at +17% by 2050 — long-run rental-demand tailwind backs the buy-and-hold thesis.
Negotiation context
- It's been on market 25 days — a 2% lower offer ($113k) is reasonable based on typical stale-listing flexibility.
Risks & watch-outs
- Watch-outs: HOA is 25% of rent.
- Climate carrying-cost: major wildfire risk; extreme-heat days projected 7→15/yr by 2055 (HVAC capex compounding) — expect insurance premiums to compound above CPI over the hold.
Questions for the listing agent
- Built in 1972 — when were the roof, HVAC, electrical panel, plumbing, and water heater last replaced?
- What does the HOA fee cover, when was the last increase, and are there any pending special assessments or reserve-fund shortfalls?
- Any open or pending special assessments — roof, HVAC, plumbing, elevator, façade? What's the per-unit balance and payoff schedule, and is the seller paying it off at close or rolling it to the buyer?
- Is there a deadline driving the sale (1031 exchange, divorce, estate, relocation)? That informs how much negotiation room exists.
- Schools are D-rated, which usually means shorter tenancies and higher turnover. Who's the typical renter profile here, and what's been the actual vacancy rate?
- Crime grade is F in this area — have there been break-ins, vandalism, or insurance claims at this property in the last 3 years? What carrier currently insures it and at what premium?
- What's the average days-on-market for RENTAL listings here right now (not sales)? A rising rental-DOM trend means longer vacancies and softer asking-rent achievability than the comps imply.
- What's the recent tenant-quality profile in this submarket — average credit score on applications, eviction rate, late-payment / NSF rate, and stable-employment percentage? A property-management company in the area should have these aggregated.
- How much new apartment / multifamily construction is in the pipeline within 1–3 miles? Heavy new supply (>2% of stock underway) typically softens rents 12–24 months out; light construction supports rent growth.
Investment metrics
- 1% rule
- 1.48% ✓
- Cap rate
- 7.49%
- Cash-on-cash
- 4.26%
- DSCR
- 1.19
- GRM
- 5.6
CMA / ARV
No comps found within radius.
Projected returns pro-forma
-3.0% appreciation · 2.69% rent growth · sell at horizon
- IRR
- -9.9%
- Equity multiple
- 0.64×
- Total profit
- $-11,591
- Equity at exit
- $17,147
- IRR
- -0.8%
- Equity multiple
- 0.95×
- Total profit
- $-1,686
- Equity at exit
- $9,943
Cash invested: $32,200 (down + closing). Projections, not guarantees.
Landlord ↔ Tenant lean methodology
- Overall (STATE)
- 18 Strongly Tenant-Friendly
- State California
- 18 Strongly Tenant-Friendly · D+13
- County
- — inherits STATE
- City
- — inherits STATE
ZIP-level market 95207
- Rents YoY
- 2.7%
- Active inventory
- 175
- Price-to-rent
- 5.6×
Monthly cashflow live
- Estimated rent
- $1,701 high interval (Pro) →
- Mortgage (P&I)
- −$603
- Tax from tax record
- −$159 /mo · $1,905/yr
- Insurance
- −$48
- HOA
- −$420
- Vacancy / Maint / Mgmt
- −$357
- Net cashflow
- $114
Break-even live
Sensitivity live
| Price | -10% $179 | -5% $147 | +0% $114 | +5% $82 | +10% $49 |
|---|---|---|---|---|---|
| Rent | -10% $-20 | -5% $47 | +0% $114 | +5% $182 | +10% $249 |
| Rate | -1.0pp $172 | -0.5pp $144 | base $114 | +0.5pp $85 | +1.0pp $54 |
UW: 25.0% down · 7.5% · 30yr · 1.5% tax · 5.0% vac · 8.0% maint · 8.0% mgmt
Financing live
Cash to close
- Down payment
- $28,750
- Closing costs
- $3,450
- Reserves months
- —
- Total cash needed
- —
Loan-product check · same deal, 3 products live
Conventional
25% down · 7.5% · 30yr
- Down + closing
- —
- Monthly P&I
- —
- Monthly cashflow
- —
- DSCR
- —
- Eligible?
- —
Personal DTI + credit; lowest rate.
DSCR
20% down · 8.5% · 30yr
- Down + closing
- —
- Monthly P&I
- —
- Monthly cashflow
- —
- DSCR
- —
- Eligible?
- —
No personal income docs; deal must DSCR.
Hard money
10% down · 12.0% · 12mo
- Down + closing
- —
- Monthly P&I
- —
- Monthly cashflow
- —
- DSCR
- —
- Eligible?
- —
Short-term bridge; refi at stabilization.
Rent comps 40 comps
| Address | Beds | Baths | Sqft | Rent | $/sqft | DOM | Units | Dist |
|---|---|---|---|---|---|---|---|---|
| 4475 La Cresta Way #2 Stockton, CA | 2.0 | 1.0 | 840 | $1,950 | $2.32 | 44d | 1 | 0.04mi |
| 4433 Continental Way Stockton, CA | 1.0–2.0 | 1.0 | 786 | $2,662 | $3.38 | 3d | 23 | 0.22mi |
| 126 E Jamestown St Stockton, CA | 2.0 | 1.0 | 750 | $1,195 | $1.59 | 44d | 1 | 0.28mi |
| 150 Gateway Ct Stockton, CA | 2.0 | 1.0 | 645 | $1,375 | $2.13 | 44d | 1 | 0.34mi |
| 126 E Jamestown St Apt 221 Stockton, CA | 2.0 | 1.0 | 750 | $1,195 | $1.59 | 24d | 1 | 0.38mi |
| 126 E Jamestown St Unit 230 Stockton, CA | 2.0 | 1.0 | 700 | $1,095 | $1.56 | 44d | 1 | 0.38mi |
| 613 Camanche Ln Stockton, CA | 1.0–2.0 | 1.0 | 815 | $1,695 | $2.08 | 3d | 3 | 0.47mi |
| 705 Camanche Ln Unit CAM-12 Stockton, CA | 2.0 | 1.0 | 940 | $1,495 | $1.59 | 20d | 1 | 0.47mi |
| 705 Camanche Ln Stockton, CA | 2.0 | 1.0 | 940 | $1,495 | $1.59 | 3d | 1 | 0.47mi |
| 705 Camanche Ln Unit CAM-07 Stockton, CA | 2.0 | 1.0 | 940 | $1,695 | $1.80 | 20d | 1 | 0.47mi |
| 5324 Holiday Dr Stockton, CA | 1.0–2.0 | 1.0 | 750 | $1,495 | $1.99 | 3d | 3 | 0.50mi |
| 4770 West Ln Stockton, CA | 1.0 | 1.0 | 657 | $1,795 | $2.73 | 22d | 1 | 0.54mi |
| 4770 West Ln Stockton, CA | 1.0 | 1.0 | 657 | $1,795 | $2.73 | 11d | 1 | 0.54mi |
| 4770 West Ln Stockton, CA | 1.0 | 1.0 | 657 | $1,795 | $2.73 | 15d | 1 | 0.54mi |
| 4770 West Ln Stockton, CA | 1.0 | 1.0 | 657 | $1,795 | $2.73 | 44d | 1 | 0.54mi |
| 3814 N California St Unit 6 Stockton, CA | 2.0 | 1.0 | 600 | $1,000 | $1.67 | 11d | 1 | 0.66mi |
| 3814 N California St Unit 3 Stockton, CA | 2.0 | 1.0 | 600 | $1,000 | $1.67 | 4d | 1 | 0.66mi |
| 328 Northbank Ct #41 Stockton, CA | 2.0 | 1.5 | 885 | $1,600 | $1.81 | 20d | 1 | 0.79mi |
| 110 E Grove St Apt 19 Stockton, CA | 1.0 | 1.0 | 595 | $1,050 | $1.76 | 44d | 1 | 0.87mi |
| 4332 Pacific Ave Stockton, CA | 1.0–2.0 | 1.0 | 645 | $1,545 | $2.39 | 3d | 3 | 0.92mi |
| 4332 Pacific Ave #37 Stockton, CA | 1.0 | 1.0 | 596 | $1,500 | $2.52 | 24d | 1 | 0.92mi |
| 4332 Pacific Ave #11 Stockton, CA | 2.0 | 1.0 | 695 | $1,545 | $2.22 | 24d | 1 | 0.92mi |
| 764 E Swain Rd Unit SW-05 Stockton, CA | 2.0 | 1.0 | 915 | $1,675 | $1.83 | 3d | 1 | 0.98mi |
| 764 E Swain Rd Unit SW-12 Stockton, CA | 2.0 | 1.0 | 915 | $1,655 | $1.81 | 20d | 1 | 0.98mi |
| 764 E Swain Rd Stockton, CA | 2.0 | 1.0 | 915 | $1,675 | $1.83 | 11d | 1 | 0.98mi |
| 6032 Cresenda Ave Stockton, CA | 3.0 | 1.0 | 968 | $2,500 | $2.58 | 22d | 1 | 1.14mi |
| 440 E Arcade St Stockton, CA | 3.0 | 2.0 | 962 | $2,350 | $2.44 | 44d | 1 | 1.21mi |
| 3301 Pacific Ave Stockton, CA | 1.0 | 1.0 | 685 | $1,375 | $2.01 | 24d | 1 | 1.23mi |
| 6465 West Ln Stockton, CA | 1.0 | 1.0 | 539 | $1,270 | $2.36 | 24d | 1 | 1.24mi |
| 6465 West Ln Stockton, CA | 1.0 | 1.0 | 539 | $1,320 | $2.45 | 44d | 1 | 1.24mi |
| 6465 West Ln Stockton, CA | 1.0 | 1.0 | 539 | $1,270 | $2.36 | 12d | 1 | 1.24mi |
| 650 Dave Brubeck Way Unit 4B Stockton, CA | 1.0 | 1.0 | 600 | $850 | $1.42 | 15d | 1 | 1.26mi |
| 650 Dave Brubeck Way Unit 5A Stockton, CA | 2.0 | 1.0 | 600 | $1,650 | $2.75 | 44d | 1 | 1.26mi |
| 2704 N Hunter St Stockton, CA | 2.0 | 1.0 | 825 | $1,795 | $2.18 | 24d | 1 | 1.27mi |
| 4401 Manchester Ave Stockton, CA | 2.0 | 1.0–1.5 | 925 | $1,474 | $1.59 | 44d | 2 | 1.30mi |
| 4401 Manchester Ave Stockton, CA | 2.0 | 1.0–1.5 | 925 | $1,474 | $1.59 | 22d | 1 | 1.30mi |
| 220 E Ellis St Stockton, CA | 2.0 | 1.0 | 940 | $1,495 | $1.59 | 44d | 1 | 1.34mi |
| 451 Marengo Ave Stockton, CA | 3.0 | 1.0 | 1100 | $2,250 | $2.05 | 15d | 1 | 1.36mi |
| 5650 Stratford Cir Stockton, CA | 1.0–2.0 | 1.0–2.0 | 928 | $2,325 | $2.51 | 3d | 5 | 1.37mi |
| 221 Quincy St Unit 1-45 Stockton, CA | 2.0 | 1.0 | 800 | $1,550 | $1.94 | 3d | 1 | 1.43mi |
HOA detail condo
- Monthly dues
- $420 · $5,040/yr
- Assessments
- None detected in remarks — confirm with the listing agent.
Listing history 4 events
-
2024-01-11soldstatus $150,000
-
1997-12-23soldstatus $12,000
-
1990-01-05soldstatus $10,000
-
1981-03-13soldstatus $18,440
ⓘ Source: listings_history table (triggers on properties + properties_extension) + one-shot
backfill from property_details.listing_events for pre-trigger history.
Tax reassessment forecast CA · Resets to sale price
- Current annual tax
- $1,905 · $159/mo
- Projected year-2 tax
- $1,905 · $159/mo
- Expected delta
- $0/yr ($0/mo · 0.0%)
ⓘ Screening estimate from a state-policy table — verify with the county assessor before closing.
Climate risk First Street
- Flood 1/10 Low FEMA zone X · 0% chance over 30 yrs
- Wildfire 6/10 Major
- Heat 7/10 Severe 7 d/yr ≥102°F today · 15 d/yr by 30 yrs out
- Wind 1/10 Low
- Air quality 10/10 Extreme 30 unhealthy d/yr today · 30 by 30 yrs out
Nearby sold comps map
Loading sold comps map…
Walkable amenities ~0.75 mi
Loading nearby amenities…
Taxation est. · year 1
- Rental income
- $20,415
- − Mortgage interest
- −$6,442
- − Property taxes
- −$1,905
- − Insurance
- −$575
- − Repairs & maintenance
- −$1,633
- − Management
- −$1,633
- − HOA
- −$5,040
- − Depreciation
- −$3,345
- Taxable loss
- −$158
- Est. tax savings @ 24.0%
- +$38
- After-tax cash flow
- $1,410/yr
For passive investors: Depreciation is non-cash, so a rental often shows a tax loss while cash-flowing — sheltering income. Rental losses are passive: they offset passive income freely, and up to $25,000/yr can offset ordinary (W-2) income if you actively participate and your MAGI is under $100k (phasing out to $0 by $150k); unused losses carry forward. On sale, claimed depreciation is recaptured at up to 25%, and gains may owe capital-gains tax (a 1031 exchange can defer both). Figures are a year-1 estimate at your 24.0% rate — not tax advice; consult a CPA.
Schools (NCES district)
- District
- Stockton Unified
- NCES district ID
- 0638010
- Math proficiency
- 23% ▲ 2.00%
- Reading proficiency
- 46% ▲ 16.00%
- Median HH income
- $37,563
- Composite
- 28.65/100
- National rank
- #6701
- State rank
- #295 of 517 in CA
Livability — Stockton
- Score
- 57/100
- State rank
- #734
- US rank
- #21638
Category grades
Schools grade is shown separately in the Schools card above.
Census & demographics
- Census place
- Stockton, CA
- County
- San Joaquin County · 729,570 people
- City population
- 332,006
- Metro
- Stockton, CA
- Population (ZIP)
- 52,414
- Household income
- $69,455
- Rent vs Own
- Severe rent burden
- 3292.0
Population outlook (San Joaquin County) Hauer SSP2
- Today (2025)
- 796,965 people
- By 2030
- 828,849 · +4.0%
- By 2040
- 885,611 · +11.1%
- By 2050
- 929,798 · +16.7%
- By 2075
- 994,578 · +24.8%
- By 2100
- 971,291 · +21.9%
Race, ethnicity, and origin ACS 2023
- Neighborhood character
- Highly diverse neighborhood (Simpson 0.73)
- Race & ethnicity
- Hispanic / Latino 43% Two or more races 24% White 23% Black 14% Asian 13%
- Hispanic origin (detail)
- Mexican 38%
- Common ancestry
- Russian 1% Italian 1% Lithuanian 1%
- Foreign-born
- 18% · Canada, China, Vietnam
- Languages at home
- 66% English-only · Spanish 22% Other Asian/Pacific 4% Tagalog/Filipino 2%
Political lean MEDSL · San Joaquin
- 2024 margin
- Toss-up / Even · D 48.0% · R 48.9% · Other 3.0%
- 2008→2024 swing
- -11.6pp toward R · 2008: 10.7pp · 2024: -0.9pp
- All cycles
- 2024: R+0.9 2020: D+13.9 2016: D+12.9 2012: D+8.9 2008: D+10.7
Not yet ingested
- Civics
- —
Market trends
- HPI YoY
- ▼ -454.91%
- Current HPI
- 358.6024
- Rent YoY
- ▲ 2.69%
- Metro
- Stockton, CA
- State GDP YoY
- ▲ 3.21%
- F500 in state
- 116
Industry mix (Fortune 500 HQ in CA)
| Industry | F500 HQs | Revenue |
|---|---|---|
| Technology | 27 | $1,492B |
|
||
| Financial Services | 3 | $174B |
|
||
| Retail | 3 | $44B |
|
||
| Insurance | 3 | $26B |
|
||
| Media / Entertainment | 2 | $115B |
|
||
| Pharmaceuticals / Biotech | 2 | $62B |
|
||
Price history
+713.4% since first listed4 events — show timeline
- 2024-01-11 Sold (Public Records) $150,000 Public Records
- 1997-12-23 Sold (Public Records) $12,000 Public Records
- 1990-01-05 Sold (Public Records) $10,000 Public Records
- 1981-03-13 Sold (Public Records) $18,440 Public Records
Property tax history
+16.6%/yrLatest (2025): $1,905 · +320.1% YoY. Source: county tax records.
Cash-flow waterfall
monthlySold comps — $/sqft
last 12 mo · ≤1 miLoading sold comps…