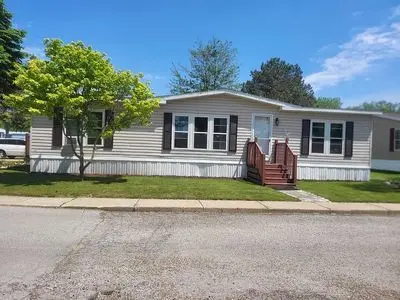
1024 Raven Dr · Auburn, MI
Flood risk 1/10 · Minimal
- FEMA flood zone
- X (unshaded)
- Chance of flooding over 30 yrs
- 0.0%
- Est. flood insurance / yr
- $507 – $1,088
Fire risk 1/10 · Minimal
- Est. fire insurance / yr
- $784 – $1,456
Heat risk 3/10 · Minor
- Hot days now (above 96°F)
- 7 days/yr
- Hot days in 30 yrs
- 14 days/yr
Wind risk 1/10 · Minimal
- Chance of severe wind over 30 yrs
- —
Air-quality risk 2/10 · Minimal
- Unhealthy air days now
- 1 days/yr
- Unhealthy air days in 30 yrs
- 1 days/yr
Risk factors via First Street. Map © Google.
Why this score? — see what drove the B- grade
The composite is a weighted blend of 9 inputs, each scored 0–100. Each bar is that input's sub-score; the figure is the points it added to the 100-point composite (weight × sub-score).
- Cash flow +30.0/30.0
- 1% rule +10.0/10.0
- DSCR +10.0/10.0
- ARV discount +7.5/15.0
- Livability +3.7/5.0
- Schools +2.8/10.0
- Rent growth +2.5/5.0
- Condition / age +2.5/5.0
- Appreciation +0.0/10.0
$65,000
🖨 Deal sheet 📄 Offer letter ✓ Due diligence
Listing remarks
Affordable 3-bedroom home Fairfield Manor Mobile Home Park. Move-In Ready! Located at 1024 Raven Drive, this well maintained corner lot double wide manufactured home offers 1100 square feet of comfortable living space with open concept thru out. Features 3 bedrooms and 2 full bathrooms, spacious open concept living and dining area to full views of kitchen with plenty of cabinet and counter space. Great size bathrooms with master bathroom offering double vanity sinks. Updated appliances in kitchen with washer and dryer hook up. Shed is located on the property and included with fire pit. This listing is for the mobile home and doesn& apos; t include the land/lot. Monthly lot fee is $510.0
Key facts
- Double vanity
- Front and side porch
- Fire pit area
Tags
Neighborhood map
What this means for you Summary
Snapshot
- This is a 3-bed/2.0-bath other listed at $65k.
Deal economics
- At list price, monthly cash flow is $514 ($6k/yr) — positive.
- The deal already cash-flows at list — no discount required.
- Meets the 1% rule at list price ($1k rent vs $65k).
Location & tenants
- Location reads 73/100 on livability (#210 in MI) — a middle-class / working-renter tenant base. Strengths: crime A+, cost of living A+, housing A+; Watch: health & safety C-, amenities F, commute F.
- Bay City School District (urban): math 27% / reading 40% proficiency, ranked #317 of 540 in MI (top 59%) — families likely to look elsewhere, expect single-tenant / working-renter base with shorter leases.
- Market conditions: 246 active listings in the ZIP; 39 units permitted in Bay County in 2024 (0 in 5+ unit buildings).
Forward outlook
- Local home prices are declining (-3.0%/yr); year-one equity from $449 of loan paydown is wiped out by about $2k of value loss. Plan a longer hold.
- Bay County population projected at -21% by 2050 — secular population decline; favor cash flow + early exit over multi-decade hold.
- At projected returns (-3.0% appreciation + 3.0% rent growth), your $18k cash investment doubles in ~4 years — after that, you're playing with house money.
Negotiation context
- Only 8 days on market — expect competitive offers; lowballing is unlikely to land.
Questions for the listing agent
- Is there a deadline driving the sale (1031 exchange, divorce, estate, relocation)? That informs how much negotiation room exists.
- Schools are B-rated — typically a magnet for longer-tenancy family renters. What's the average tenant stay here, and is there a school-zone premium baked into asking?
- What's the average days-on-market for RENTAL listings here right now (not sales)? A rising rental-DOM trend means longer vacancies and softer asking-rent achievability than the comps imply.
- What's the recent tenant-quality profile in this submarket — average credit score on applications, eviction rate, late-payment / NSF rate, and stable-employment percentage? A property-management company in the area should have these aggregated.
- How much new for-sale + rental construction is in the pipeline within 1–3 miles? Heavy new supply typically softens prices + rents 12–24 months out; constrained supply supports both.
Investment metrics
- 1% rule
- 1.88% ✓
- Cap rate
- 15.78%
- Cash-on-cash
- 33.89%
- DSCR
- 2.51
- GRM
- 4.4
CMA / ARV
No comps found within radius.
Projected returns pro-forma
-3.0% appreciation · 3.0% rent growth · sell at horizon
- IRR
- 29.2%
- Equity multiple
- 2.22×
- Total profit
- $22,224
- Equity at exit
- $9,692
- IRR
- 36.6%
- Equity multiple
- 4.38×
- Total profit
- $61,583
- Equity at exit
- $5,620
Cash invested: $18,200 (down + closing). Projections, not guarantees.
Landlord ↔ Tenant lean methodology
- Overall (STATE)
- 62 Landlord-Friendly
- State Michigan
- 62 Landlord-Friendly · EVEN
- County
- — inherits STATE
- City
- — inherits STATE
ZIP-level market 48706
- Active inventory
- 246
- Price-to-rent
- 4.4×
Monthly cashflow live
- Estimated rent
- $1,219 medium interval (Pro) →
- Mortgage (P&I)
- −$341
- Tax est. 1.5%
- −$81 /mo · $975/yr
- Insurance
- −$27
- HOA
- −$0
- Vacancy / Maint / Mgmt
- −$256
- Net cashflow
- $514
Break-even live
UW: 25.0% down · 7.5% · 30yr · 1.5% tax · 5.0% vac · 8.0% maint · 8.0% mgmt
Financing live
Cash to close
- Down payment
- $16,250
- Closing costs
- $1,950
- Reserves months
- —
- Total cash needed
- —
Loan-product check · same deal, 3 products live
Conventional
25% down · 7.5% · 30yr
- Down + closing
- —
- Monthly P&I
- —
- Monthly cashflow
- —
- DSCR
- —
- Eligible?
- —
Personal DTI + credit; lowest rate.
DSCR
20% down · 8.5% · 30yr
- Down + closing
- —
- Monthly P&I
- —
- Monthly cashflow
- —
- DSCR
- —
- Eligible?
- —
No personal income docs; deal must DSCR.
Hard money
10% down · 12.0% · 12mo
- Down + closing
- —
- Monthly P&I
- —
- Monthly cashflow
- —
- DSCR
- —
- Eligible?
- —
Short-term bridge; refi at stabilization.
Listing history 14 events
-
2026-06-19days on market $65,000 Active 8 DOM
-
2026-06-18days on market $65,000 Active 7 DOM
-
2026-06-17days on market $65,000 Active 6 DOM
-
2026-06-16days on market $65,000 Active 5 DOM
-
2026-06-15days on market $65,000 Active 4 DOM
-
2026-06-14days on market $65,000 Active 2 DOM
-
2026-06-12days on market $65,000 Active 1 DOM
-
2026-06-09days on market $65,000 Active 8 DOM
-
2026-06-08days on market $65,000 Active 7 DOM
-
2026-06-07days on market $65,000 Active 6 DOM
-
2026-06-05days on market $65,000 Active 3 DOM
-
2026-06-03days on market $65,000 Active 2 DOM
-
2026-06-02remarks 695-char remark
-
2026-06-02$65,000 Active 1 DOM
ⓘ Source: listings_history table (triggers on properties + properties_extension) + one-shot
backfill from property_details.listing_events for pre-trigger history.
Climate risk First Street
- Flood 1/10 Low FEMA zone X (unshaded) · 0% chance over 30 yrs
- Wildfire 1/10 Low
- Heat 3/10 Moderate 7 d/yr ≥96°F today · 14 d/yr by 30 yrs out
- Wind 1/10 Low
- Air quality 2/10 Low 1 unhealthy d/yr today · 1 by 30 yrs out
Nearby sold comps map
Loading sold comps map…
Walkable amenities ~0.75 mi
Loading nearby amenities…
Taxation est. · year 1
- Rental income
- $14,631
- − Mortgage interest
- −$3,641
- − Property taxes
- −$975
- − Insurance
- −$325
- − Repairs & maintenance
- −$1,170
- − Management
- −$1,170
- − Depreciation
- −$1,891
- Taxable income
- $5,458
- Est. tax owed @ 24.0%
- −$1,310
- After-tax cash flow
- $4,858/yr
For passive investors: Depreciation is non-cash, so a rental often shows a tax loss while cash-flowing — sheltering income. Rental losses are passive: they offset passive income freely, and up to $25,000/yr can offset ordinary (W-2) income if you actively participate and your MAGI is under $100k (phasing out to $0 by $150k); unused losses carry forward. On sale, claimed depreciation is recaptured at up to 25%, and gains may owe capital-gains tax (a 1031 exchange can defer both). Figures are a year-1 estimate at your 24.0% rate — not tax advice; consult a CPA.
Schools (NCES district)
- District
- Bay City School District
- NCES district ID
- 2604260
- Math proficiency
- 27% ▼ -8.00%
- Reading proficiency
- 40% ▼ -4.00%
- Median HH income
- $43,833
- Composite
- 28.47/100
- National rank
- #6743
- State rank
- #317 of 540 in MI
Livability — Auburn
- Score
- 73/100
- State rank
- #210
- US rank
- #5234
Category grades
Schools grade is shown separately in the Schools card above.
Census & demographics
- Population (ZIP)
- 38,756
Population outlook (Bay County) Hauer SSP2
- Today (2025)
- 101,476 people
- By 2030
- 98,152 · -3.3%
- By 2040
- 89,711 · -11.6%
- By 2050
- 80,614 · -20.6%
- By 2075
- 60,544 · -40.3%
- By 2100
- 41,603 · -59.0%
Race, ethnicity, and origin ACS 2023
- Neighborhood character
- Predominantly White (90%)
- Race & ethnicity
- White 90% Hispanic / Latino 5% Two or more races 4%
- Common ancestry
- Romanian 16% Lithuanian 9% Slovak 2%
- Foreign-born
- 1%
- Languages at home
- 98% English-only · Spanish 1%
Political lean MEDSL · Bay
- 2024 margin
- R (+14.7) · D 42.0% · R 56.7% · Other 1.3%
- 2008→2024 swing
- -30.0pp toward R · 2008: 15.3pp · 2024: -14.7pp
- All cycles
- 2024: R+14.7 2020: R+11.6 2016: R+12.6 2012: D+6.0 2008: D+15.3
Not yet ingested
- Civics
- —
Market trends
- HPI YoY
- ▼ -133.29%
- Current HPI
- 203.6444
- Rent YoY
- —
- Metro
- —
- State GDP YoY
- ▲ 1.37%
- F500 in state
- 28
Industry mix (Fortune 500 HQ in MI)
| Industry | F500 HQs | Revenue |
|---|---|---|
| Automotive Parts | 3 | $48B |
|
||
| Automotive | 2 | $372B |
|
||
| Chemicals | 1 | $45B |
|
||
| Automotive Retail | 1 | $29B |
|
||
| Healthcare / Medical Devices | 1 | $23B |
|
||
| Automotive Technology | 1 | $20B |
|
||
Price history
1 event — show timeline
- 2026-06-02 Listed $65,000 FSBO.com
Cash-flow waterfall
monthlySold comps — $/sqft
last 12 mo · ≤1 miLoading sold comps…