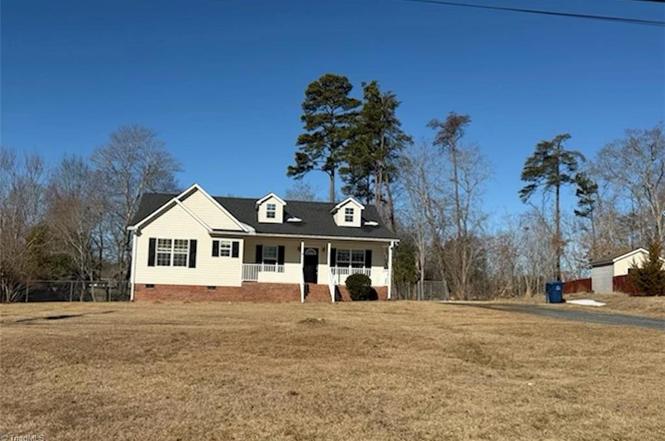
4377 Fox St · Randleman, NC
Flood risk 1/10 · Minimal
- FEMA flood zone
- X (unshaded)
- Chance of flooding over 30 yrs
- 0.0%
- Est. flood insurance / yr
- $507 – $1,088
Fire risk 4/10 · Minor
- Est. fire insurance / yr
- $906 – $1,684
Heat risk 5/10 · Moderate
- Hot days now (above 103°F)
- 7 days/yr
- Hot days in 30 yrs
- 17 days/yr
Wind risk 5/10 · Moderate
- Chance of severe wind over 30 yrs
- 22.0%
Air-quality risk 2/10 · Minimal
- Unhealthy air days now
- 1 days/yr
- Unhealthy air days in 30 yrs
- 1 days/yr
Risk factors via First Street. Map © Google.
Why this score? — see what drove the C- grade
The composite is a weighted blend of 9 inputs, each scored 0–100. Each bar is that input's sub-score; the figure is the points it added to the 100-point composite (weight × sub-score).
- Cash flow +23.5/30.0
- DSCR +7.6/10.0
- ARV discount +5.8/15.0
- 1% rule +5.4/10.0
- Schools +3.6/10.0
- Livability +3.4/5.0
- Rent growth +2.5/5.0
- Condition / age +2.5/5.0
- Appreciation +0.0/10.0
$259,900
🖨 Deal sheet (PDF) 📄 Offer letter ✓ Due diligence
Listing remarks
Motivated seller! Repair work has been done! New flooring through out the home, new countertops in kitchen and new vanity in main bathroom. Are you looking for a house to call home? Step inside and feel the warmth that’s been built here — not just in the walls, but in the laughter, love, and memories shared over the years. Imagine cozy mornings with sunlight streaming through the windows, evenings gathered around the table, and weekends spent making this space uniquely yours. This home has been cared for and cherished, and now it’s ready to welcome someone new to write the next chapter. If you’ve been searching for a place where comfort meets character — wher
Key facts
- 0.46 acre lot
- Built 2000
- Listed 82 days
Property features AI
Finance
- HOA & community: No homeowners association
Exterior
- Parking: Driveway
- Utilities: Public water; Public sewer; Publicly maintained road
- Home design: Residential stick/site-built house; One story; Built in 2000; Existing structure
- Construction: Vinyl siding; Crawl space foundation
- Exterior features: Fenced yard; City lot
Interior
- Kitchen: Kitchen on main level
- Bedrooms: All bedrooms located on the main level
- Bathrooms: 2 full bathrooms
- Heating & cooling: Heat pump and electric heating; Central air conditioning; Electric water heater
- Interior features: Primary bedroom located on the main level
- Laundry & utility: Main-level laundry room
Neighborhood map
What this means for you Summary
Snapshot
- This is a 3-bed/2.0-bath single-family listed at $260k.
Deal economics
- At list price, monthly cash flow is $486 ($6k/yr) — positive.
- The deal already cash-flows at list — no discount required.
- Meets the 1% rule at list price ($3k rent vs $260k).
- Recommended offer: $244k (6.0% below list) — sets the bar for market timing.
- Cap rate 8.5% vs local median 3.7% in Randleman — top-decile yield for the area; either an underpriced asset or a hidden risk that comps aren't pricing in. Stress-test before assuming the spread holds.
Location & tenants
- Location reads 67/100 on livability (#242 in NC) — a middle-class / working-renter tenant base. Strengths: cost of living A+, housing A+; Watch: amenities F, commute F, health & safety F.
- Randolph County School System (rural): math 43% / reading 43% proficiency, ranked #94 of 178 in NC (top 53%) — families likely to look elsewhere, expect single-tenant / working-renter base with shorter leases.
- Zoned schools: Randleman Elementary School (math 48% / reading 38%, grade F, #622 of 1,410 statewide, top 44%, 515 students, 78% FRL); Randleman Middle School (math 30% / reading 36%, grade F, #305 of 475 statewide, top 65%, 831 students, 67% FRL); Randleman High School (math 42% / reading 47%, grade F, #352 of 535 statewide, top 68%, 877 students, 55% FRL) — zoned schools average 67% FRL vs 48% district-wide (19 pts higher); higher-poverty schools than district average — tighter screening recommended.
- Market conditions: 78 active listings in the ZIP; 2 comparable units currently listed for rent nearby; 789 units permitted in Randolph County in 2024 (168 in 5+ unit buildings).
Forward outlook
- Local home prices are declining (-3.0%/yr); year-one equity from $2k of loan paydown is wiped out by about $8k of value loss. Plan a longer hold.
- Randolph County population projected to shrink 10% by 2050 — rents likely to lag national; underwrite the cash flow, not the appreciation.
Negotiation context
- It's been on market 82 days — a 6% lower offer ($244k) is reasonable based on typical stale-listing flexibility.
Risks & watch-outs
- Climate carrying-cost: moderate wind risk, 22% chance of damaging wind over 30y; extreme-heat days projected 7→17/yr by 2055 (HVAC capex compounding) — expect insurance premiums to compound above CPI over the hold.
Questions for the listing agent
- It's been on market 82 days. Have you received any prior offers? Is the seller open to a 6% concession, seller financing, or rate buy-down credit?
- Why hasn't it sold? Are there any deal-killer items the seller is aware of (foundation, flood, title, zoning, code violations)?
- Is there a deadline driving the sale (1031 exchange, divorce, estate, relocation)? That informs how much negotiation room exists.
- Schools are F-rated, which usually means shorter tenancies and higher turnover. Who's the typical renter profile here, and what's been the actual vacancy rate?
- What's the average days-on-market for RENTAL listings here right now (not sales)? A rising rental-DOM trend means longer vacancies and softer asking-rent achievability than the comps imply.
- What's the recent tenant-quality profile in this submarket — average credit score on applications, eviction rate, late-payment / NSF rate, and stable-employment percentage? A property-management company in the area should have these aggregated.
- How much new for-sale + rental construction is in the pipeline within 1–3 miles? Heavy new supply typically softens prices + rents 12–24 months out; constrained supply supports both.
Investment metrics
- 1% rule
- 1.04% ✓
- Cap rate
- 8.53%
- Cash-on-cash
- 8.01%
- DSCR
- 1.36
- GRM
- 8.0
CMA / ARV
- ARV (on-the-fly)
- $250,400
- Comps found
- 12
Show comp detail 12 sales within ~0.75 mi
| Address | Dist | Beds/Ba | Sqft | Sold | Price | $/sf | Match |
|---|---|---|---|---|---|---|---|
| 302 Trollinger St | 0.14mi | 3/2.0 | 1,310 (+5%) | 1mo | $260,000 | $198 | 85 |
| 4 Bradsher Ct | 0.24mi | 3/2.0 | 1,348 (+8%) | 2mo | $319,500 | $237 | 74 |
| 4207 Fox St | 0.33mi | 3/2.0 | 1,313 (+5%) | 4mo | $260,000 | $198 | 73 |
| 4227 Fox St | 0.29mi | 3/2.0 | 1,320 (+5%) | 11mo | $269,000 | $204 | 68 |
| 111 Trollinger St | 0.30mi | 3/2.0 | 1,210 (-3%) | 23mo | $280,000 | $231 | 62 |
| 4220 N Pin Oak Dr | 0.50mi | 3/2.0 | 1,300 (+4%) | 12mo | $271,000 | $208 | 60 |
| 104 Redbud Ln | 0.52mi | 3/2.0 | 1,284 (+3%) | 14mo | $256,000 | $199 | 60 |
| 134 Fox St | 0.60mi | 3/1.5 | 1,250 (-0%) | 16mo | $245,000 | $196 | 56 |
| 872 Charter Oaks Dr | 0.48mi | 3/2.0 | 1,358 (+8%) | 9mo | $269,500 | $198 | 56 |
| 4120 Brown Oaks Rd | 0.34mi | 3/2.0 | 1,334 (+6%) | 23mo | $292,500 | $219 | 54 |
| 1056 Charter Oaks Dr | 0.68mi | 3/2.0 | 1,326 (+6%) | 10mo | $265,000 | $200 | 50 |
| 116 Sunrise Cir | 0.72mi | 2/1.0 (-1) | 1,176 (-6%) | 10mo | $135,000 | $115 | 39 |
Match score weights: distance 35% · size 25% · config 20% · recency 20%. Top-matched comps best support the ARV.
Projected returns pro-forma
-3.0% appreciation · 3.0% rent growth · sell at horizon
- IRR
- -4.1%
- Equity multiple
- 0.85×
- Total profit
- $-11,247
- Equity at exit
- $38,752
- IRR
- 5.5%
- Equity multiple
- 1.41×
- Total profit
- $29,804
- Equity at exit
- $22,471
Cash invested: $72,772 (down + closing). Projections, not guarantees.
Landlord ↔ Tenant lean methodology
- Overall (STATE)
- 85 Strongly Landlord-Friendly
- State North Carolina
- 85 Strongly Landlord-Friendly · R+3
- County
- — inherits STATE
- City
- — inherits STATE
ZIP-level market 27317
- Home prices YoY
- -15.3%
- Active inventory
- 78
- Price-to-rent
- 8.0×
Monthly cashflow live
- Estimated rent
- $2,693 medium interval (Pro) →
- Mortgage (P&I)
- −$1,363
- Tax from tax record
- −$171 /mo · $2,047/yr
- Insurance
- −$108
- HOA
- −$0
- Vacancy / Maint / Mgmt
- −$565
- Net cashflow
- $486
Break-even live
Sensitivity live
| Price | -10% $633 | -5% $559 | +0% $486 | +5% $412 | +10% $338 |
|---|---|---|---|---|---|
| Rent | -10% $273 | -5% $379 | +0% $486 | +5% $592 | +10% $698 |
| Rate | -1.0pp $616 | -0.5pp $552 | base $486 | +0.5pp $418 | +1.0pp $350 |
UW: 25.0% down · 7.5% · 30yr · 1.5% tax · 5.0% vac · 8.0% maint · 8.0% mgmt
Financing live
Cash to close
- Down payment
- $64,975
- Closing costs
- $7,797
- Reserves months
- —
- Total cash needed
- —
Loan-product check · same deal, 3 products live
Conventional
25% down · 7.5% · 30yr
- Down + closing
- —
- Monthly P&I
- —
- Monthly cashflow
- —
- DSCR
- —
- Eligible?
- —
Personal DTI + credit; lowest rate.
DSCR
20% down · 8.5% · 30yr
- Down + closing
- —
- Monthly P&I
- —
- Monthly cashflow
- —
- DSCR
- —
- Eligible?
- —
No personal income docs; deal must DSCR.
Hard money
10% down · 12.0% · 12mo
- Down + closing
- —
- Monthly P&I
- —
- Monthly cashflow
- —
- DSCR
- —
- Eligible?
- —
Short-term bridge; refi at stabilization.
Rent comps 2 comps
| Address | Beds | Baths | Sqft | Rent | $/sqft | DOM | Units | Dist |
|---|---|---|---|---|---|---|---|---|
| 518 Woods Dr Randleman, NC | 4.0 | 2.0 | 1800 | $3,000 | $1.67 | 15d | 1 | 0.08mi |
| 1125 N Main St Randleman, NC | 3.0 | 1.0 | 1134 | $1,400 | $1.23 | 24d | 1 | 0.55mi |
Listing history 7 events
-
2026-05-08soldstatus $240,000
-
2026-05-01status Pending
-
2026-03-31historical Due Diligence Period
-
2026-03-27price $259,900
-
2026-02-06$270,000 Active
-
2003-03-12soldstatus $116,500
-
2000-12-04soldstatus $110,500
ⓘ Source: listings_history table (triggers on properties + properties_extension) + one-shot
backfill from property_details.listing_events for pre-trigger history.
Tax reassessment forecast NC · Resets to sale price
- Current annual tax
- $2,047 · $171/mo
- Projected year-2 tax
- $2,131 · $178/mo
- Expected delta
- +$84/yr (+$7/mo · 4.1%)
ⓘ Screening estimate from a state-policy table — verify with the county assessor before closing.
Climate risk First Street
- Flood 1/10 Low FEMA zone X (unshaded) · 0% chance over 30 yrs
- Wildfire 4/10 Moderate
- Heat 5/10 Major 7 d/yr ≥103°F today · 17 d/yr by 30 yrs out
- Wind 5/10 Major 22% chance of damaging wind over 30 yrs
- Air quality 2/10 Low 1 unhealthy d/yr today · 1 by 30 yrs out
Nearby sold comps map
Loading sold comps map…
Walkable amenities ~0.75 mi
Loading nearby amenities…
Taxation est. · year 1
- Rental income
- $32,314
- − Mortgage interest
- −$14,558
- − Property taxes
- −$2,047
- − Insurance
- −$1,300
- − Repairs & maintenance
- −$2,585
- − Management
- −$2,585
- − Depreciation
- −$7,561
- Taxable income
- $1,678
- Est. tax owed @ 24.0%
- −$403
- After-tax cash flow
- $5,423/yr
For passive investors: Depreciation is non-cash, so a rental often shows a tax loss while cash-flowing — sheltering income. Rental losses are passive: they offset passive income freely, and up to $25,000/yr can offset ordinary (W-2) income if you actively participate and your MAGI is under $100k (phasing out to $0 by $150k); unused losses carry forward. On sale, claimed depreciation is recaptured at up to 25%, and gains may owe capital-gains tax (a 1031 exchange can defer both). Figures are a year-1 estimate at your 24.0% rate — not tax advice; consult a CPA.
Schools (NCES district)
- District
- Randolph County School System
- NCES district ID
- 3703780
- Math proficiency
- 43% ▲ 1.00%
- Reading proficiency
- 43% ▲ 2.00%
- Median HH income
- $43,490
- Composite
- 36.37/100
- National rank
- #4686
- State rank
- #94 of 178 in NC
Livability — Randleman
- Score
- 67/100
- State rank
- #242
- US rank
- #10980
Category grades
Schools grade is shown separately in the Schools card above.
Census & demographics
- Census place
- Randleman, NC
- Population (ZIP)
- 17,769
Population outlook (Randolph County) Hauer SSP2
- Today (2025)
- 142,640 people
- By 2030
- 140,911 · -1.2%
- By 2040
- 135,692 · -4.9%
- By 2050
- 128,575 · -9.9%
- By 2075
- 111,507 · -21.8%
- By 2100
- 93,376 · -34.5%
Race, ethnicity, and origin ACS 2023
- Neighborhood character
- Predominantly White (79%)
- Race & ethnicity
- White 79% Hispanic / Latino 13% Two or more races 7% Black 4%
- Hispanic origin (detail)
- Mexican 11% Puerto Rican 2%
- Common ancestry
- Serbian 7% Slovak 3% Italian 2%
- Foreign-born
- 6% · Canada
- Languages at home
- 88% English-only · Spanish 12%
Political lean MEDSL · Randolph
- 2024 margin
- Solid R (+57.2) · D 21.0% · R 78.3%
- 2008→2024 swing
- -15.0pp toward R · 2008: -42.3pp · 2024: -57.2pp
- All cycles
- 2024: R+57.2 2020: R+56.3 2016: R+56.7 2012: R+50.2 2008: R+42.3
Not yet ingested
- Civics
- —
Market trends
- HPI YoY
- ▼ -43.66%
- Current HPI
- 241.7323
- Rent YoY
- —
- Metro
- —
- State GDP YoY
- ▲ 3.28%
- F500 in state
- 26
Industry mix (Fortune 500 HQ in NC)
| Industry | F500 HQs | Revenue |
|---|---|---|
| Financial Services | 2 | $213B |
|
||
| Retail | 2 | $95B |
|
||
| Industrial Conglomerate | 1 | $38B |
|
||
| Metals / Steel | 1 | $35B |
|
||
| Utilities | 1 | $30B |
|
||
| Industrial Machinery | 1 | $19B |
|
||
Price history
+117.2% since first listed7 events — show timeline
- 2026-05-08 Sold (Public Records) $240,000 Public Records
- 2026-05-01 Pending — Triad MLS
- 2026-03-31 Contingent — Triad MLS
- 2026-03-27 Price Changed $259,900 Triad MLS
- 2026-02-06 Listed $270,000 Triad MLS
- 2003-03-12 Sold (Public Records) $116,500 Public Records
- 2000-12-04 Sold (Public Records) $110,500 Public Records
Property tax history
+3.4%/yrLatest (2025): $2,047 · +0.0% YoY. Source: county tax records.
Cash-flow waterfall
monthlySold comps — $/sqft
last 12 mo · ≤1 miLoading sold comps…