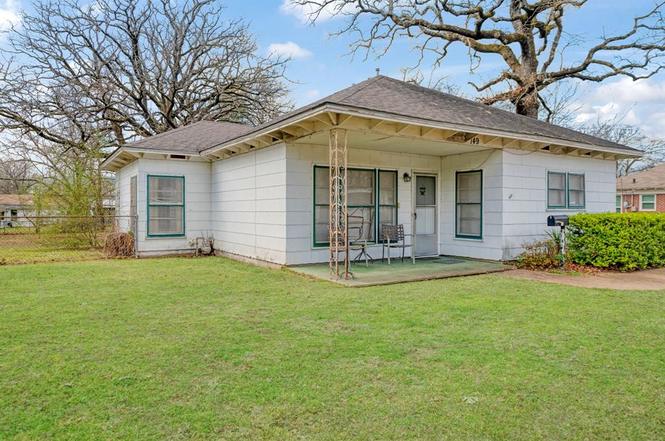
149 30th St NW · Paris, TX
Flood risk 1/10 · Minimal
- FEMA flood zone
- X (unshaded)
- Chance of flooding over 30 yrs
- 0.0%
- Est. flood insurance / yr
- $507 – $1,088
Fire risk 7/10 · Major
- Est. fire insurance / yr
- $1,222 – $2,270
Heat risk 7/10 · Major
- Hot days now (above 111°F)
- 7 days/yr
- Hot days in 30 yrs
- 22 days/yr
Wind risk 4/10 · Minor
- Chance of severe wind over 30 yrs
- 22.0%
Air-quality risk 2/10 · Minimal
- Unhealthy air days now
- 0 days/yr
- Unhealthy air days in 30 yrs
- 1 days/yr
Risk factors via First Street. Map © Google.
Why this score? — see what drove the D grade
The composite is a weighted blend of 9 inputs, each scored 0–100. Each bar is that input's sub-score; the figure is the points it added to the 100-point composite (weight × sub-score).
- Cash flow +16.3/30.0
- ARV discount +7.5/15.0
- DSCR +5.1/10.0
- 1% rule +3.9/10.0
- Livability +3.1/5.0
- Schools +3.0/10.0
- Rent growth +2.5/5.0
- Condition / age +2.5/5.0
- Appreciation +0.0/10.0
$139,900
🖨 Deal sheet (PDF) 📄 Offer letter ✓ Due diligence
Listing remarks
Very well-maintained 3-bedroom, 1-bath home located in desirable NW Paris, within walking distance to Travis Junior High School. This property would make an excellent investment opportunity or family home. The adorable kitchen features charming built-ins and an abundance of natural light. All bedrooms are spacious and offer plenty of closet space, with one bedroom providing flexibility to serve as a bonus room, office, or playroom if desired. You’ll also appreciate the oversized utility room along with an additional space perfect for storage, hobbies, or a craft room. Outside, the large fenced backyard offers plenty of room for family activities, pets, and entertaining guests. Additio
Key facts
- Bonus room
- 0.31 acre lot
- Garage
Tags
Property features AI
Finance
- Other: Horse not permitted
- Financial info: Treat as clear loan type; No second mortgage
- HOA & community: No association
Exterior
- Parking: Driveway; Covered parking (1 space); Attached garage with 1 garage space
- Utilities: City water; City sewer; Individual gas meter
- Home design: Single family residence; One story; Residential property
- Construction: Built in 1965; Composition roof; Slab foundation
- Exterior features: Chain link fencing; Interior lot
Interior
- Kitchen: Gas range; Eat-in kitchen
- Bedrooms: 3 bedrooms (all on main level)
- Flooring: Laminate; Linoleum
- Bathrooms: 1 full bathroom
- Heating & cooling: Central heating (natural gas); Central air (electric)
- Interior features: Built-in features; Eat-in kitchen; One living area; One dining area; 7 total rooms; Living room (14 x 15); Kitchen (13 x 12); Primary bedroom (15 x 12); Bedroom (13 x 11); Bedroom with built-in cabinets (11 x 21); Utility room (11 x 11); Extra storage room (15 x 12)
- Laundry & utility: Utility room
Neighborhood map
What this means for you Summary
Snapshot
- This is a 3-bed/1.0-bath single-family listed at $140k.
Deal economics
- At list price, monthly cash flow is $78 ($936/yr) — positive.
- The deal already cash-flows at list — no discount required.
- To meet the 1% rule (rent ≥ 1% of price), the offer needs to be $124k (11.3% below list).
- Recommended offer: $124k (11.3% below list) — sets the bar for 1% rule.
- Cap rate 7.0% vs local median 3.7% in Paris — top-decile yield for the area; either an underpriced asset or a hidden risk that comps aren't pricing in. Stress-test before assuming the spread holds.
Location & tenants
- Location reads 61/100 on livability (#984 in TX) — a middle-class / working-renter tenant base. Strengths: cost of living A+, housing A+; Watch: crime F, amenities F, commute F.
- Paris ISD (town): math 36% / reading 37% proficiency, ranked #521 of 826 in TX (top 63%) — families likely to look elsewhere, expect single-tenant / working-renter base with shorter leases; 70% free/reduced lunch — lower-income household profile, screen leases tightly.
- Zoned schools: Justiss El (math 27% / reading 32%, grade F, #2,525 of 4,322 statewide, top 62%, 552 students, 90% FRL); Crockett Int (math 33% / reading 33%, grade F, #930 of 1,662 statewide, top 57%, 560 students, 79% FRL); Paris H S (math 60% / reading 51%, grade C, #364 of 1,632 statewide, top 23%, 934 students, 71% FRL).
- Market conditions: 277 active listings in the ZIP; 119 units permitted in Lamar County in 2024 (71 in 5+ unit buildings).
- This rent runs 32% of the median local income ($46k/yr) — at the standard rent-burdened threshold; future hikes will face affordability resistance.
Forward outlook
- Local home prices are declining (-3.0%/yr); year-one equity from $967 of loan paydown is wiped out by about $4k of value loss. Plan a longer hold.
- Lamar County population projected at -13% by 2050 — secular population decline; favor cash flow + early exit over multi-decade hold.
Negotiation context
- It's been on market 109 days — a 9% lower offer ($127k) is reasonable based on typical stale-listing flexibility.
Risks & watch-outs
- Climate carrying-cost: major wildfire risk; extreme-heat days projected 7→22/yr by 2055 (HVAC capex compounding) — expect insurance premiums to compound above CPI over the hold.
Questions for the listing agent
- It's been on market 109 days. Have you received any prior offers? Is the seller open to a 11% concession, seller financing, or rate buy-down credit?
- Built in 1965 — when were the roof, HVAC, electrical panel, plumbing, and water heater last replaced?
- Why hasn't it sold? Are there any deal-killer items the seller is aware of (foundation, flood, title, zoning, code violations)?
- Is there a deadline driving the sale (1031 exchange, divorce, estate, relocation)? That informs how much negotiation room exists.
- Schools are D-rated, which usually means shorter tenancies and higher turnover. Who's the typical renter profile here, and what's been the actual vacancy rate?
- Crime grade is F in this area — have there been break-ins, vandalism, or insurance claims at this property in the last 3 years? What carrier currently insures it and at what premium?
- The area grade is low — what's the realistic commute time and amenity access for the typical tenant pool here? Any planned neighborhood developments (good or bad) we should know about?
- What's the average days-on-market for RENTAL listings here right now (not sales)? A rising rental-DOM trend means longer vacancies and softer asking-rent achievability than the comps imply.
- What's the recent tenant-quality profile in this submarket — average credit score on applications, eviction rate, late-payment / NSF rate, and stable-employment percentage? A property-management company in the area should have these aggregated.
- How much new for-sale + rental construction is in the pipeline within 1–3 miles? Heavy new supply typically softens prices + rents 12–24 months out; constrained supply supports both.
Investment metrics
- 1% rule
- 0.89% ✗
- Cap rate
- 6.96%
- Cash-on-cash
- 2.39%
- DSCR
- 1.11
- GRM
- 9.4
CMA / ARV
- ARV (on-the-fly)
- $91,728
- Comps found
- 8
Show comp detail 8 sales within ~0.75 mi
| Address | Dist | Beds/Ba | Sqft | Sold | Price | $/sf | Match |
|---|---|---|---|---|---|---|---|
| 264 SW 28th | 0.28mi | 3/1.5 | 1,028 (+2%) | 5mo | $144,900 | $141 | 77 |
| 227 24th St NW | 0.46mi | 3/2.0 | 1,044 (+4%) | 3mo | $29,900 | $29 | 66 |
| 560 26th St SW | 0.52mi | 3/1.5 | 1,072 (+6%) | 0mo | $94,900 | $89 | 63 |
| 214 NW 23rd | 0.56mi | 2/1.0 (-1) | 1,010 (+0%) | 23mo | $119,900 | $119 | 50 |
| 2330 Shiloh St | 0.63mi | 3/1.0 | 988 (-2%) | 24mo | $109,000 | $110 | 48 |
| 130 25th St NW | 0.42mi | 2/1.0 (-1) | 1,132 (+12%) | 15mo | $67,000 | $59 | 42 |
| 2524 Graham | 0.38mi | 4/2.0 (+1) | 1,156 (+15%) | 10mo | $105,000 | $91 | 40 |
| 2530 W Sherman St | 0.50mi | 2/1.0 (-1) | 864 (-14%) | 17mo | $55,000 | $64 | 34 |
Match score weights: distance 35% · size 25% · config 20% · recency 20%. Top-matched comps best support the ARV.
Projected returns pro-forma
-3.0% appreciation · 3.0% rent growth · sell at horizon
- IRR
- -12.5%
- Equity multiple
- 0.55×
- Total profit
- $-17,725
- Equity at exit
- $20,860
- IRR
- -3.5%
- Equity multiple
- 0.77×
- Total profit
- $-9,126
- Equity at exit
- $12,096
Cash invested: $39,172 (down + closing). Projections, not guarantees.
Landlord ↔ Tenant lean methodology
- Overall (STATE)
- 87 Strongly Landlord-Friendly
- State Texas
- 87 Strongly Landlord-Friendly · R+5
- County
- — inherits STATE
- City
- — inherits STATE
ZIP-level market 75460
- Active inventory
- 277
- Price-to-rent
- 9.4×
Monthly cashflow live
- Estimated rent
- $1,240 medium interval (Pro) →
- Mortgage (P&I)
- −$734
- Tax from tax record
- −$110 /mo · $1,318/yr
- Insurance
- −$58
- HOA
- −$0
- Vacancy / Maint / Mgmt
- −$260
- Net cashflow
- $78
Break-even live
Sensitivity live
| Price | -10% $157 | -5% $118 | +0% $78 | +5% $38 | +10% $-1 |
|---|---|---|---|---|---|
| Rent | -10% $-20 | -5% $29 | +0% $78 | +5% $127 | +10% $176 |
| Rate | -1.0pp $148 | -0.5pp $114 | base $78 | +0.5pp $42 | +1.0pp $5 |
UW: 25.0% down · 7.5% · 30yr · 1.5% tax · 5.0% vac · 8.0% maint · 8.0% mgmt
Financing live
Cash to close
- Down payment
- $34,975
- Closing costs
- $4,197
- Reserves months
- —
- Total cash needed
- —
Loan-product check · same deal, 3 products live
Conventional
25% down · 7.5% · 30yr
- Down + closing
- —
- Monthly P&I
- —
- Monthly cashflow
- —
- DSCR
- —
- Eligible?
- —
Personal DTI + credit; lowest rate.
DSCR
20% down · 8.5% · 30yr
- Down + closing
- —
- Monthly P&I
- —
- Monthly cashflow
- —
- DSCR
- —
- Eligible?
- —
No personal income docs; deal must DSCR.
Hard money
10% down · 12.0% · 12mo
- Down + closing
- —
- Monthly P&I
- —
- Monthly cashflow
- —
- DSCR
- —
- Eligible?
- —
Short-term bridge; refi at stabilization.
Listing history 19 events
-
2026-06-22days on market $139,900 Active 109 DOM
-
2026-06-21days on market $139,900 Active 108 DOM
-
2026-06-19days on market $139,900 Active 106 DOM
-
2026-06-18days on market $139,900 Active 105 DOM
-
2026-06-17days on market $139,900 Active 104 DOM
-
2026-06-16days on market $139,900 Active 103 DOM
-
2026-06-15days on market $139,900 Active 102 DOM
-
2026-06-14days on market $139,900 Active 100 DOM
-
2026-06-12days on market $139,900 Active 99 DOM
-
2026-06-09days on market $139,900 Active 96 DOM
-
2026-06-08days on market $139,900 Active 95 DOM
-
2026-06-07days on market $139,900 Active 94 DOM
-
2026-06-03days on market $139,900 Active 90 DOM
-
2026-06-02days on market $139,900 Active 89 DOM
-
2026-06-01days on market $139,900 Active 88 DOM
-
2026-05-31days on market $139,900 Active 87 DOM
-
2026-05-31days on market $139,900 Active 86 DOM
-
2026-03-05$139,900 Active
-
2005-09-08soldstatus
ⓘ Source: listings_history table (triggers on properties + properties_extension) + one-shot
backfill from property_details.listing_events for pre-trigger history.
Tax reassessment forecast TX · Resets to sale price
- Current annual tax
- $1,318 · $110/mo
- Projected year-2 tax
- $2,560 · $213/mo
- Expected delta
- +$1,242/yr (+$103/mo · 94.2%)
ⓘ Screening estimate from a state-policy table — verify with the county assessor before closing.
Climate risk First Street
- Flood 1/10 Low FEMA zone X (unshaded) · 0% chance over 30 yrs
- Wildfire 7/10 Severe
- Heat 7/10 Severe 7 d/yr ≥111°F today · 22 d/yr by 30 yrs out
- Wind 4/10 Moderate 22% chance of damaging wind over 30 yrs
- Air quality 2/10 Low 0 unhealthy d/yr today · 1 by 30 yrs out
Nearby sold comps map
Loading sold comps map…
Walkable amenities ~0.75 mi
Loading nearby amenities…
Taxation est. · year 1
- Rental income
- $14,883
- − Mortgage interest
- −$7,837
- − Property taxes
- −$1,318
- − Insurance
- −$700
- − Repairs & maintenance
- −$1,191
- − Management
- −$1,191
- − Depreciation
- −$4,070
- Taxable loss
- −$1,423
- Est. tax savings @ 24.0%
- +$341
- After-tax cash flow
- $1,277/yr
For passive investors: Depreciation is non-cash, so a rental often shows a tax loss while cash-flowing — sheltering income. Rental losses are passive: they offset passive income freely, and up to $25,000/yr can offset ordinary (W-2) income if you actively participate and your MAGI is under $100k (phasing out to $0 by $150k); unused losses carry forward. On sale, claimed depreciation is recaptured at up to 25%, and gains may owe capital-gains tax (a 1031 exchange can defer both). Figures are a year-1 estimate at your 24.0% rate — not tax advice; consult a CPA.
Schools (NCES district)
- District
- Paris ISD
- NCES district ID
- 4834290
- Math proficiency
- 36% ▼ -11.00%
- Reading proficiency
- 37% ▼ -1.00%
- Median HH income
- $31,515
- Composite
- 29.83/100
- National rank
- #6419
- State rank
- #521 of 826 in TX
Livability — Paris
- Score
- 61/100
- State rank
- #984
- US rank
- #17535
Category grades
Schools grade is shown separately in the Schools card above.
Census & demographics
- Census place
- Paris, TX
- County
- Lamar County · 23,426 people
- City population
- 23,426
- Metro
- Paris, TX
- Population (ZIP)
- 23,426
- Household income
- $46,473
- Rent vs Own
- Severe rent burden
- 1355.0
Population outlook (Lamar County) Hauer SSP2
- Today (2025)
- 48,319 people
- By 2030
- 47,160 · -2.4%
- By 2040
- 44,621 · -7.7%
- By 2050
- 42,024 · -13.0%
- By 2075
- 36,577 · -24.3%
- By 2100
- 30,580 · -36.7%
Race, ethnicity, and origin ACS 2023
- Neighborhood character
- Diverse neighborhood (Simpson 0.60)
- Race & ethnicity
- White 58% Black 22% Hispanic / Latino 13% Two or more races 8%
- Hispanic origin (detail)
- Mexican 12%
- Common ancestry
- Lithuanian 1% Slovak 1% Italian 1%
- Foreign-born
- 3% · Canada, China
- Languages at home
- 92% English-only · Spanish 7%
Political lean MEDSL · Lamar
- 2024 margin
- Solid R (+61.0) · D 19.2% · R 80.3%
- 2008→2024 swing
- -19.1pp toward R · 2008: -42.0pp · 2024: -61.0pp
- All cycles
- 2024: R+61.0 2020: R+57.4 2016: R+59.2 2012: R+50.3 2008: R+42.0
Not yet ingested
- Civics
- —
Market trends
- HPI YoY
- ▼ -201.50%
- Current HPI
- 145.3511
- Rent YoY
- —
- Metro
- Paris, TX
- State GDP YoY
- ▲ 3.95%
- F500 in state
- 110
Industry mix (Fortune 500 HQ in TX)
| Industry | F500 HQs | Revenue |
|---|---|---|
| Energy | 16 | $1,198B |
|
||
| Technology | 5 | $198B |
|
||
| Engineering / Construction | 4 | $72B |
|
||
| Energy Services | 3 | $60B |
|
||
| Utilities | 3 | $41B |
|
||
| Healthcare | 2 | $330B |
|
||
Price history
2 events — show timeline
- 2026-03-05 Listed $139,900 NTREIS
- 2005-09-08 Sold (Public Records) — Public Records
Property tax history
+2.3%/yrLatest (2025): $1,318 · +11.4% YoY. Source: county tax records.
Cash-flow waterfall
monthlySold comps — $/sqft
last 12 mo · ≤1 miLoading sold comps…