 Duplex
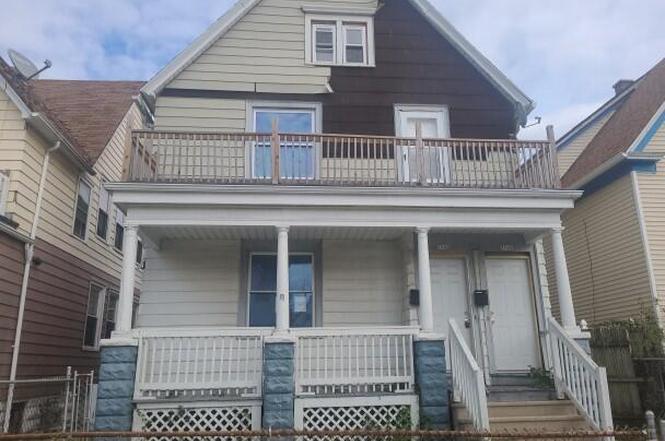
2940 N Holton St #2942 · Milwaukee, WI
Flood risk 1/10 · Minimal
- FEMA flood zone
- X (unshaded)
- Chance of flooding over 30 yrs
- 0.0%
- Est. flood insurance / yr
- $473 – $860
Fire risk 1/10 · Minimal
- Est. fire insurance / yr
- $636 – $1,182
Heat risk 2/10 · Minimal
- Hot days now (above 98°F)
- 7 days/yr
- Hot days in 30 yrs
- 13 days/yr
Wind risk 2/10 · Minimal
- Chance of severe wind over 30 yrs
- —
Air-quality risk 3/10 · Minor
- Unhealthy air days now
- 3 days/yr
- Unhealthy air days in 30 yrs
- 4 days/yr
Risk factors via First Street. Map © Google.
Why this score? — see what drove the C+ grade
The composite is a weighted blend of 9 inputs, each scored 0–100. Each bar is that input's sub-score; the figure is the points it added to the 100-point composite (weight × sub-score).
- Cash flow +27.1/30.0
- DSCR +9.4/10.0
- 1% rule +7.3/10.0
- ARV discount +6.4/15.0
- Livability +4.0/5.0
- Rent growth +3.8/5.0
- Condition / age +2.5/5.0
- Schools +1.2/10.0
- Appreciation +0.0/10.0
$200,000
🖨 Deal sheet 📄 Offer letter ✓ Due diligence
Multi-family units
County records classify this as Multi-Family (2-4 Unit). Listing-text estimate: 2 units. confirmed
Listing remarks
Two units, 2bed/1bath each with a range stove and refrigerator in both units. Move in ready with great opportunity for rental income.
Key facts
- 3,920 sq ft lot
- 2 garage spots
- Built 1907
Property features AI
Exterior
- Parking: Detached 2-car garage; Total of 2 garage parking spaces
- Utilities: Municipal water; 2 electric meters; 2 gas meters
- Home design: 2-story duplex; Multi-family property; Zoning: RT4
- Construction: Information source: Assessor/Public Record
- Exterior features: Vinyl exterior; Acreage less than 1/2
Interior
- Kitchen: Unit 2 kitchen located on upper level
- Bedrooms: Unit 1: 2 bedrooms; Unit 2: 2 bedrooms (master on upper level)
- Bathrooms: Unit 1: 1 full bathroom; Unit 2: 1 full bathroom
- Interior features: Full basement
- Laundry & utility: Separate electric and gas meters (2 electric meters, 2 gas meters)
Neighborhood map
What this means for you Summary
Snapshot
- This is a 2 × 2-bed/1.0-bath units multifamily listed at $200k.
Deal economics
- At list price, monthly cash flow is $568 ($7k/yr) — positive. Per door: $284/mo.
- The deal already cash-flows at list — no discount required.
- Meets the 1% rule at list price ($2k rent vs $200k).
- Recommended offer: $176k (12.0% below list) — sets the bar for market timing.
- Cap rate 9.7% vs local median 5.1% in Milwaukee — top-decile yield for the area; either an underpriced asset or a hidden risk that comps aren't pricing in. Stress-test before assuming the spread holds.
Location & tenants
- Location reads 81/100 on livability (#55 in WI, #1,534 nationally) — a professional / high-income tenant draw. Strengths: amenities A+, commute A+, cost of living A+; Watch: employment D+, schools F, crime F.
- Milwaukee School District (urban): math 10% / reading 18% proficiency, ranked #337 of 342 in WI (top 98%) — low school quality limits family demand, transient renter base, plan for 1-2y turnover; 77% free/reduced lunch — lower-income household profile, screen leases tightly.
- Market conditions: Rents rising fast (+5.0%/yr); 129 active listings in the ZIP; 31 comparable units currently listed for rent nearby; rentals at typical pace (median 17d on market — plan ~3-4 weeks tenant-placement turnaround); 1,017 units permitted in Milwaukee County in 2024 (803 in 5+ unit buildings).
- At $2,468/mo this rent would consume 63% of the median local household income ($47k/yr) (locally 2397% of renters already pay >50% of income on rent) — very limited rent-growth headroom before tenants either downsize or default.
Forward outlook
- Local home prices are declining (-3.0%/yr); year-one equity from $1k of loan paydown is wiped out by about $6k of value loss. Plan a longer hold.
- Milwaukee County population projected at +4% by 2050 — modest demand growth; plan on rents tracking national, not racing it.
- At projected returns (-3.0% appreciation + 5.0% rent growth), your $56k cash investment doubles in ~8 years — after that, you're playing with house money.
Negotiation context
- It's been on market 151 days — a 12% lower offer ($176k) is reasonable based on typical stale-listing flexibility.
- 2 sale attempts; this cycle's ask has dropped $30k (13%) from the opening price — seller is motivated, your offer sets the floor, not the list.
Risks & watch-outs
- Watch-outs: built in 1907 — expect roof / HVAC / electrical / plumbing capex.
Questions for the listing agent
- It's been on market 151 days. Have you received any prior offers? Is the seller open to a 12% concession, seller financing, or rate buy-down credit?
- Can we see the unit-by-unit rent roll, current vacancy, and any below-market leases? What's the average tenancy length?
- What capital expenditures (roof, boiler, parking lot, exteriors) have been made in the last 5 years, and what's planned in the next 2?
- Built in 1907 — when were the roof, HVAC, electrical panel, plumbing, and water heater last replaced?
- Why hasn't it sold? Are there any deal-killer items the seller is aware of (foundation, flood, title, zoning, code violations)?
- Is there a deadline driving the sale (1031 exchange, divorce, estate, relocation)? That informs how much negotiation room exists.
- Schools are F-rated, which usually means shorter tenancies and higher turnover. Who's the typical renter profile here, and what's been the actual vacancy rate?
- Crime grade is F in this area — have there been break-ins, vandalism, or insurance claims at this property in the last 3 years? What carrier currently insures it and at what premium?
- What's the average days-on-market for RENTAL listings here right now (not sales)? A rising rental-DOM trend means longer vacancies and softer asking-rent achievability than the comps imply.
- What's the recent tenant-quality profile in this submarket — average credit score on applications, eviction rate, late-payment / NSF rate, and stable-employment percentage? A property-management company in the area should have these aggregated.
- How much new apartment / multifamily construction is in the pipeline within 1–3 miles? Heavy new supply (>2% of stock underway) typically softens rents 12–24 months out; light construction supports rent growth.
Investment metrics
- 1% rule
- 1.23% ✓
- Cap rate
- 9.70%
- Cash-on-cash
- 12.16%
- DSCR
- 1.54
- GRM
- 6.8
CMA / ARV
- ARV (on-the-fly)
- $195,072
- Comps found
- 12
Show comp detail 12 sales within ~0.75 mi
| Address | Dist | Beds/Ba | Sqft | Sold | Price | $/sf | Match |
|---|---|---|---|---|---|---|---|
| 2940 N Holton St #2942 | 0.00mi | 4/2.0 | 2,032 (0%) | 0mo | $195,000 | $96 | 100 |
| 2813 N Humboldt Blvd #2815 | 0.39mi | 4/2.0 | 2,152 (+6%) | 2mo | $276,000 | $128 | 71 |
| 600 E Burleigh St | 0.21mi | 4/2.0 | 1,787 (-12%) | 1mo | $180,000 | $101 | 69 |
| 2768 N Palmer St #2770 | 0.30mi | 4/2.0 | 2,211 (+9%) | 3mo | $174,415 | $79 | 69 |
| 220 E Clarke St | 0.47mi | 3/2.0 (-1) | 2,077 (+2%) | 3mo | $180,000 | $87 | 67 |
| 2812 N Fratney St #2814 | 0.25mi | 4/2.0 | 2,314 (+14%) | 2mo | $300,000 | $130 | 64 |
| 2438 N Pierce St | 0.65mi | 5/3.0 (+1) | 2,032 (0%) | 0mo | $265,000 | $130 | 60 |
| 3358 N Richards St #3364 | 0.54mi | 4/2.0 | 1,858 (-9%) | 1mo | $95,000 | $51 | 59 |
| 2514 N Holton St #2516 | 0.54mi | 4/2.0 | 2,246 (+10%) | 1mo | $215,000 | $96 | 56 |
| 608 W Burleigh St #610 | 0.74mi | 4/2.0 | 2,174 (+7%) | 3mo | $112,000 | $52 | 52 |
| 3452 N 1st St Unit 3452A | 0.70mi | 5/2.0 (+1) | 1,908 (-6%) | 1mo | $130,000 | $68 | 51 |
| 3341 N 3rd St #3343 | 0.70mi | 4/2.0 | 2,292 (+13%) | 4mo | $109,000 | $48 | 43 |
Match score weights: distance 35% · size 25% · config 20% · recency 20%. Top-matched comps best support the ARV.
Projected returns pro-forma
-3.0% appreciation · 5.0% rent growth · sell at horizon
- IRR
- 4.0%
- Equity multiple
- 1.16×
- Total profit
- $8,842
- Equity at exit
- $29,821
- IRR
- 15.3%
- Equity multiple
- 2.36×
- Total profit
- $76,052
- Equity at exit
- $17,292
Cash invested: $56,000 (down + closing). Projections, not guarantees.
Landlord ↔ Tenant lean methodology
- Overall (STATE)
- 73 Landlord-Friendly
- State Wisconsin
- 73 Landlord-Friendly · R+2
- County
- — inherits STATE
- City
- — inherits STATE
ZIP-level market 53212
- Rents YoY
- 5.0%
- Active inventory
- 129
- Price-to-rent
- 13.5×
Monthly cashflow live
- Estimated rent
- $2,468 high interval (Pro) →
- Mortgage (P&I)
- −$1,049
- Tax est. 1.5%
- −$250 /mo · $3,000/yr
- Insurance
- −$83
- HOA
- −$0
- Vacancy / Maint / Mgmt
- −$518
- Net cashflow
- $568
Break-even live
2-unit breakdown (identical units grouped — click to expand)
| Units | Beds | Baths | Est. rent |
|---|---|---|---|
| 2× units | 2 | 1 | $2,468 |
| #1 | 2 | 1 | $1,234 |
| #2 | 2 | 1 | $1,234 |
| Total (2 units) | $2,468 | ||
UW: 25.0% down · 7.5% · 30yr · 1.5% tax · 5.0% vac · 8.0% maint · 8.0% mgmt
Financing live
Cash to close
- Down payment
- $50,000
- Closing costs
- $6,000
- Reserves months
- —
- Total cash needed
- —
Loan-product check · same deal, 3 products live
Conventional
25% down · 7.5% · 30yr
- Down + closing
- —
- Monthly P&I
- —
- Monthly cashflow
- —
- DSCR
- —
- Eligible?
- —
Personal DTI + credit; lowest rate.
DSCR
20% down · 8.5% · 30yr
- Down + closing
- —
- Monthly P&I
- —
- Monthly cashflow
- —
- DSCR
- —
- Eligible?
- —
No personal income docs; deal must DSCR.
Hard money
10% down · 12.0% · 12mo
- Down + closing
- —
- Monthly P&I
- —
- Monthly cashflow
- —
- DSCR
- —
- Eligible?
- —
Short-term bridge; refi at stabilization.
Rent comps 31 comps
| Address | Beds | Baths | Sqft | Rent | $/sqft | DOM | Units | Dist |
|---|---|---|---|---|---|---|---|---|
| 3042 N Palmer St #5 Milwaukee, WI | 3.0 | 1.0 | 1718 | $1,050 | $0.61 | 23d | 1 | 0.25mi |
| 2772 N Bremen St #2774 Milwaukee, WI | 3.0 | 1.0 | 1500 | $1,795 | $1.20 | 43d | 1 | 0.32mi |
| 2634 N Doctor M.L.K. Jr Dr Milwaukee, WI | 5.0 | 2.5 | 2512 | $3,700 | $1.47 | 43d | 1 | 0.58mi |
| 312 E Townsend St Unit 312 Milwaukee, WI | 3.0 | 1.0 | 1400 | $1,250 | $0.89 | 23d | 1 | 0.59mi |
| 400 E Meinecke Ave #402 Milwaukee, WI | 3.0 | 1.0 | 1700 | $1,800 | $1.06 | 16d | 1 | 0.68mi |
| 3420 N Vel R. Phillips Ave Unit 3422 Milwaukee, WI | 3.0 | 1.0 | 2756 | $1,195 | $0.43 | 43d | 1 | 0.79mi |
| 3420-22 N Vel R Phillips Ave Milwaukee, WI | 3.0 | 1.0 | 2756 | $1,195 | $0.43 | 43d | 1 | 0.80mi |
| 3131 N Bartlett Ave Unit 1 Milwaukee, WI | 4.0 | 1.0 | 1600 | $1,750 | $1.09 | 43d | 1 | 0.82mi |
| 1814 E Linnwood Ave Milwaukee, WI | 4.0 | 2.0 | 1800 | $3,100 | $1.72 | 43d | 1 | 0.90mi |
| 1902 E Linnwood Ave Unit 1902 05 Milwaukee, WI | 4.0 | 1.5 | 1599 | $2,400 | $1.50 | 4d | 1 | 0.94mi |
| 1902 E Linnwood Ave Unit 1902 04 Milwaukee, WI | 4.0 | 1.5 | 1599 | $2,400 | $1.50 | 17d | 1 | 0.94mi |
| 2959 N Murray Ave Milwaukee, WI | 3.0 | 1.0 | 1500 | $1,800 | $1.20 | 16d | 1 | 0.98mi |
| 2937 N Frederick Ave Milwaukee, WI | 4.0 | 1.0 | 1700 | $1,925 | $1.13 | 4d | 1 | 1.03mi |
| 2012 N Buffum St Milwaukee, WI | 3.0 | 2.5 | 2200 | $2,695 | $1.23 | 43d | 1 | 1.05mi |
| 2974 N Frederick Ave Milwaukee, WI | 4.0 | 2.0 | 1626 | $2,600 | $1.60 | 43d | 1 | 1.07mi |
| 2706 N Frederick Ave Milwaukee, WI | 3.0 | 2.0 | 1500 | $2,000 | $1.33 | 17d | 1 | 1.11mi |
| 2579 N Frederick Ave Milwaukee, WI | 4.0 | 2.0 | 2400 | $2,095 | $0.87 | 4d | 1 | 1.12mi |
| 2830 N Maryland Ave Unit 2828 Milwaukee, WI | 3.0 | 1.0 | 1675 | $1,995 | $1.19 | 17d | 1 | 1.14mi |
| 2609 N Maryland Ave Milwaukee, WI | 4.0 | 2.5 | 1700 | $2,050 | $1.21 | 4d | 1 | 1.16mi |
| 1014 E Land Pl Milwaukee, WI | 3.0 | 2.0 | 1900 | $2,000 | $1.05 | 4d | 1 | 1.19mi |
| 1025 E Land Pl Milwaukee, WI | 3.0 | 1.0 | 1560 | $1,750 | $1.12 | 23d | 1 | 1.22mi |
| 922 E Hamilton St Unit Lower Milwaukee, WI | 3.0 | 1.0 | 1900 | $1,550 | $0.82 | 23d | 1 | 1.22mi |
| 3015 N Prospect Ave Unit 3015 Prospect Milwaukee, WI | 3.0 | 1.0 | 1570 | $1,950 | $1.24 | 17d | 1 | 1.23mi |
| 1116 E Hamilton St Milwaukee, WI | 3.0 | 2.0 | 1400 | $1,750 | $1.25 | 17d | 1 | 1.26mi |
| 1703 N Astor St Milwaukee, WI | 4.0 | 2.0 | 1800 | $2,200 | $1.22 | 43d | 1 | 1.33mi |
| 2511 N Prospect Ave Unit 2511 19 Milwaukee, WI | 3.0 | 1.0 | 1658 | $1,980 | $1.19 | 17d | 1 | 1.34mi |
| 2534 N Prospect Ave Milwaukee, WI | 3.0 | 1.0 | 1500 | $2,095 | $1.40 | 43d | 1 | 1.34mi |
| 2935 N Downer Ave Milwaukee, WI | 3.0 | 1.0 | 1500 | $1,695 | $1.13 | 4d | 1 | 1.35mi |
| 2745 N Downer Ave #2747 Milwaukee, WI | 3.0 | 2.0 | 1800 | $2,400 | $1.33 | 10d | 1 | 1.37mi |
| 2245 N Lake Dr Unit 2247 Milwaukee, WI | 3.0 | 1.0 | 2197 | $2,495 | $1.14 | 43d | 1 | 1.48mi |
| 1551 N Water St Milwaukee, WI | 3.0 | 1.0–2.0 | 1074 | $3,395 | $3.16 | 2d | 52 | 1.49mi |
Listing history 6 events
-
2026-04-28status Pending
-
2026-03-17price $200,000
-
2026-01-20price $220,000
-
2026-01-20status Active
-
2026-01-06historical
-
2025-11-06$230,000 Active
ⓘ Source: listings_history table (triggers on properties + properties_extension) + one-shot
backfill from property_details.listing_events for pre-trigger history.
Climate risk First Street
- Flood 1/10 Low FEMA zone X (unshaded) · 0% chance over 30 yrs
- Wildfire 1/10 Low
- Heat 2/10 Low 7 d/yr ≥98°F today · 13 d/yr by 30 yrs out
- Wind 2/10 Low
- Air quality 3/10 Moderate 3 unhealthy d/yr today · 4 by 30 yrs out
Nearby sold comps map
Loading sold comps map…
Walkable amenities ~0.75 mi
Loading nearby amenities…
Taxation est. · year 1
- Rental income
- $29,616
- − Mortgage interest
- −$11,203
- − Property taxes
- −$3,000
- − Insurance
- −$1,000
- − Repairs & maintenance
- −$2,369
- − Management
- −$2,369
- − Depreciation
- −$5,818
- Taxable income
- $3,856
- Est. tax owed @ 24.0%
- −$925
- After-tax cash flow
- $5,885/yr
For passive investors: Depreciation is non-cash, so a rental often shows a tax loss while cash-flowing — sheltering income. Rental losses are passive: they offset passive income freely, and up to $25,000/yr can offset ordinary (W-2) income if you actively participate and your MAGI is under $100k (phasing out to $0 by $150k); unused losses carry forward. On sale, claimed depreciation is recaptured at up to 25%, and gains may owe capital-gains tax (a 1031 exchange can defer both). Figures are a year-1 estimate at your 24.0% rate — not tax advice; consult a CPA.
Schools (NCES district)
- District
- Milwaukee School District
- NCES district ID
- 5509600
- Math proficiency
- 10% ▼ -5.00%
- Reading proficiency
- 18% ▬ 0.00%
- Median HH income
- $36,339
- Composite
- 11.61/100
- National rank
- #9696
- State rank
- #337 of 342 in WI
Livability — Milwaukee
- Score
- 81/100
- State rank
- #55
- US rank
- #1534
Category grades
Schools grade is shown separately in the Schools card above.
Census & demographics
- Census place
- Milwaukee, WI
- County
- Milwaukee County · 926,379 people
- City population
- 573,768
- Metro
- Milwaukee-Waukesha, WI
- Population (ZIP)
- 28,938
- Household income
- $47,298
- Rent vs Own
- Severe rent burden
- 2397.0
Population outlook (Milwaukee County) Hauer SSP2
- Today (2025)
- 995,758 people
- By 2030
- 1,009,124 · +1.3%
- By 2040
- 1,028,128 · +3.3%
- By 2050
- 1,040,066 · +4.4%
- By 2075
- 1,057,849 · +6.2%
- By 2100
- 1,039,774 · +4.4%
Race, ethnicity, and origin ACS 2023
- Neighborhood character
- Diverse neighborhood (Simpson 0.64)
- Race & ethnicity
- Black 48% White 35% Hispanic / Latino 12% Two or more races 9%
- Hispanic origin (detail)
- Mexican 4% Puerto Rican 6%
- Common ancestry
- Romanian 4% Portuguese 2% Italian 2%
- Foreign-born
- 2% · Canada
- Languages at home
- 92% English-only · Spanish 6%
Political lean MEDSL · Milwaukee
- 2024 margin
- Solid D (+38.5) · D 68.3% · R 29.8% · Other 1.8%
- 2008→2024 swing
- +2.7pp toward D · 2008: 35.9pp · 2024: 38.5pp
- All cycles
- 2024: D+38.5 2020: D+39.9 2016: D+37.5 2012: D+34.6 2008: D+35.9
Not yet ingested
- Civics
- —
Market trends
- HPI YoY
- ▼ -216.73%
- Current HPI
- 385.8225
- Rent YoY
- ▲ 5.00%
- Metro
- Milwaukee-Waukesha, WI
- State GDP YoY
- ▲ 2.10%
- F500 in state
- 20
Industry mix (Fortune 500 HQ in WI)
| Industry | F500 HQs | Revenue |
|---|---|---|
| Industrial Machinery | 4 | $23B |
|
||
| Industrial Technology | 2 | $36B |
|
||
| Insurance | 1 | $36B |
|
||
| Professional Services | 1 | $19B |
|
||
| Utilities | 1 | $9B |
|
||
| Consumer Goods | 1 | $3B |
|
||
Price history
-13.0% since first listed6 events — show timeline
- 2026-04-28 Pending — METROMLS
- 2026-03-17 Price Changed $200,000 METROMLS
- 2026-01-20 Price Changed $220,000 METROMLS
- 2026-01-20 Relisted — METROMLS
- 2026-01-06 Listing Removed — METROMLS
- 2025-11-06 Listed $230,000 METROMLS
Cash-flow waterfall
monthlySold comps — $/sqft
last 12 mo · ≤1 miLoading sold comps…