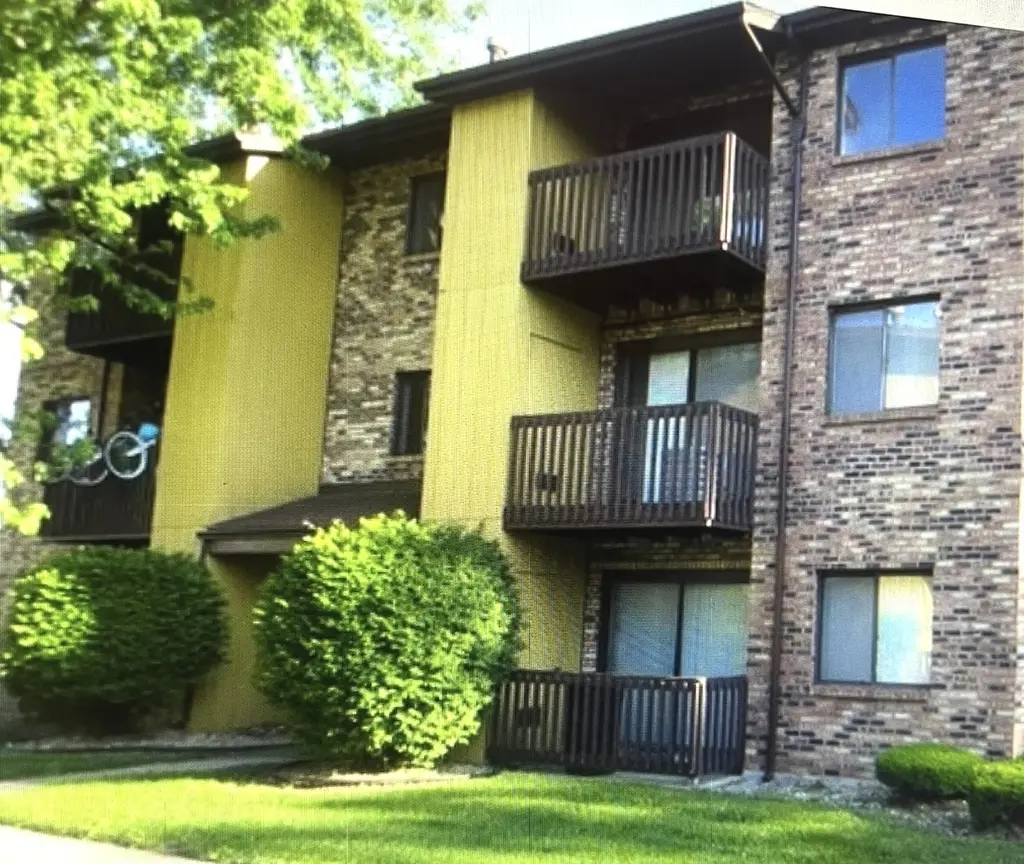
1249 Cunningham Dr Unit 3E · Calumet City, IL
Flood risk 1/10 · Minimal
- FEMA flood zone
- X (unshaded)
- Chance of flooding over 30 yrs
- 0.0%
- Est. flood insurance / yr
- $473 – $860
Fire risk 1/10 · Minimal
- Est. fire insurance / yr
- $804 – $1,492
Heat risk 3/10 · Minor
- Hot days now (above 102°F)
- 7 days/yr
- Hot days in 30 yrs
- 15 days/yr
Wind risk 2/10 · Minimal
- Chance of severe wind over 30 yrs
- —
Air-quality risk 4/10 · Minor
- Unhealthy air days now
- 4 days/yr
- Unhealthy air days in 30 yrs
- 5 days/yr
Risk factors via First Street. Map © Google.
Why this score? — see what drove the B- grade
The composite is a weighted blend of 9 inputs, each scored 0–100. Each bar is that input's sub-score; the figure is the points it added to the 100-point composite (weight × sub-score).
- Cash flow +29.0/30.0
- 1% rule +10.0/10.0
- DSCR +10.0/10.0
- ARV discount +7.5/15.0
- Rent growth +4.0/5.0
- Livability +3.6/5.0
- Condition / age +2.5/5.0
- Schools +1.0/10.0
- Appreciation +0.0/10.0
$75,000
🖨 Deal sheet (PDF) 📄 Offer letter ✓ Due diligence
Listing remarks
Welcome to this fantastic condo, offering the ideal blend of comfort, space, and investment potential! With its spacious layout, cozy atmosphere, and prime location, this property is perfect for rental income or as a primary residence. 2 large bedrooms master bedroom with half bath cozy kitchen with small table space spacious living room and dining room. Add value through minor upgrades and cosmetic touches. Some TLC this condo can be transformed into a stunning rental or primary residence. Investors, first-time buyers make it yours today. Seller motivated!
Key facts
- $315 HOA
- Parking
- Built 1982
Property features AI
Finance
- Other: Parcel number available; Association master fee not required
- HOA & community: Condo association fee $315 monthly; HOA covers exterior maintenance, lawn care and snow removal; Pets not allowed
Exterior
- Parking: Assigned parking (1 space)
- Utilities: Water: Lake Michigan; Sewer: Public sewer; Electric/gas available (natural gas heating noted)
- Home design: Attached single (Condo) in a condo/duplex building; Entry on level 3; Building contains 6 units; Built of brick; Age approximately 41–50 years; Commuter-friendly location with bus, train and interstate access
- Construction: Brick construction
- Exterior features: Balcony; Zero lot line
Interior
- Kitchen: Kitchen with eating area/table space (11 x 10)
- Bedrooms: Master bedroom on main level (16 x 14); Second bedroom on main level (13 x 12); Additional bedrooms listed
- Flooring: Laminate/Wood laminate flooring in living and dining areas
- Bathrooms: 1 full bath; 1 half bath
- Heating & cooling: Natural gas heating; Central air conditioning
- Interior features: Dining area combined with living room; Total of 5 rooms; Laminate flooring throughout main living areas
- Laundry & utility: Laundry room
Neighborhood map
What this means for you Summary
Snapshot
- This is a 2-bed/1.5-bath condo listed at $75k.
Deal economics
- At list price, monthly cash flow is $256 ($3k/yr) — positive.
- The deal already cash-flows at list — no discount required.
- Meets the 1% rule at list price ($2k rent vs $75k).
- Recommended offer: $68k (9.0% below list) — sets the bar for market timing.
- Cap rate 10.4% vs local median 8.3% in Calumet City — meaningfully above typical; check what's discounted (condition, days-on-market, listing class) to confirm the premium yield is real.
Location & tenants
- Location reads 71/100 on livability (#330 in IL) — a middle-class / working-renter tenant base. Strengths: commute A+, cost of living A+, housing A+; Watch: employment C-, crime D-, amenities F.
- Thornton Fractional Twp Hsd 215 (suburban): math 9% / reading 13% proficiency, ranked #563 of 620 in IL (top 91%) — low school quality limits family demand, transient renter base, plan for 1-2y turnover.
- Zoned schools: Hoover Elem School (556 students, 0% FRL); Schrum Memorial School (math 24% / reading 24%, grade F, #332 of 665 statewide, top 55%, 277 students, 0% FRL); Thornton Fractnl No High School (math 6% / reading 10%, grade F, #587 of 693 statewide, top 85%, 1,383 students, 0% FRL).
- Market conditions: Rents rising fast (+6.2%/yr); 196 active listings in the ZIP; 14 comparable units currently listed for rent nearby; rentals at typical pace (median 14d on market — plan ~3-4 weeks tenant-placement turnaround); 6,272 units permitted in Cook County in 2024 (4,658 in 5+ unit buildings).
- This rent runs 35% of the median local income ($55k/yr) — at the standard rent-burdened threshold; future hikes will face affordability resistance.
Forward outlook
- Local home prices are declining (-3.0%/yr); year-one equity from $519 of loan paydown is wiped out by about $2k of value loss. Plan a longer hold.
- At projected returns (-3.0% appreciation + 6.2% rent growth), your $21k cash investment doubles in ~6 years — after that, you're playing with house money.
Negotiation context
- It's been on market 95 days — a 9% lower offer ($68k) is reasonable based on typical stale-listing flexibility.
- 9 sale attempts since 15y ago with the ask held roughly flat each time — persistent listings suggest the price (not the market) is what's stuck; bring a comps-based counter.
- Current owner paid $15k; list at $75k implies a 400% gain — meaningful room to come down on a strong offer.
Risks & watch-outs
- Watch-outs: property tax is 4.4% of price.
Questions for the listing agent
- It's been on market 95 days. Have you received any prior offers? Is the seller open to a 9% concession, seller financing, or rate buy-down credit?
- Property tax is high relative to price — has the assessment been appealed recently, and will the sale trigger a re-assessment?
- What does the HOA fee cover, when was the last increase, and are there any pending special assessments or reserve-fund shortfalls?
- Any open or pending special assessments — roof, HVAC, plumbing, elevator, façade? What's the per-unit balance and payoff schedule, and is the seller paying it off at close or rolling it to the buyer?
- Why hasn't it sold? Are there any deal-killer items the seller is aware of (foundation, flood, title, zoning, code violations)?
- Is there a deadline driving the sale (1031 exchange, divorce, estate, relocation)? That informs how much negotiation room exists.
- Schools are F-rated, which usually means shorter tenancies and higher turnover. Who's the typical renter profile here, and what's been the actual vacancy rate?
- Crime grade is D in this area — have there been break-ins, vandalism, or insurance claims at this property in the last 3 years? What carrier currently insures it and at what premium?
- What's the average days-on-market for RENTAL listings here right now (not sales)? A rising rental-DOM trend means longer vacancies and softer asking-rent achievability than the comps imply.
- What's the recent tenant-quality profile in this submarket — average credit score on applications, eviction rate, late-payment / NSF rate, and stable-employment percentage? A property-management company in the area should have these aggregated.
- How much new apartment / multifamily construction is in the pipeline within 1–3 miles? Heavy new supply (>2% of stock underway) typically softens rents 12–24 months out; light construction supports rent growth.
Investment metrics
- 1% rule
- 2.14% ✓
- Cap rate
- 10.38%
- Cash-on-cash
- 14.61%
- DSCR
- 1.65
- GRM
- 3.9
CMA / ARV
No comps found within radius.
Projected returns pro-forma
-3.0% appreciation · 6.17% rent growth · sell at horizon
- IRR
- 11.0%
- Equity multiple
- 1.46×
- Total profit
- $9,744
- Equity at exit
- $11,183
- IRR
- 23.8%
- Equity multiple
- 3.57×
- Total profit
- $53,949
- Equity at exit
- $6,485
Cash invested: $21,000 (down + closing). Projections, not guarantees.
Landlord ↔ Tenant lean methodology
- Overall (STATE)
- 43 Moderately Tenant-Leaning
- State Illinois
- 43 Moderately Tenant-Leaning · D+7
- County
- — inherits STATE
- City
- — inherits STATE
ZIP-level market 60409
- Home prices YoY
- -27.6%
- Rents YoY
- 6.2%
- Active inventory
- 196
- Price-to-rent
- 3.9×
Monthly cashflow live
- Estimated rent
- $1,607 high interval (Pro) →
- Mortgage (P&I)
- −$393
- Tax from tax record
- −$275 /mo · $3,296/yr
- Insurance
- −$31
- HOA
- −$315
- Vacancy / Maint / Mgmt
- −$338
- Net cashflow
- $256
Break-even live
Sensitivity live
| Price | -10% $298 | -5% $277 | +0% $256 | +5% $234 | +10% $213 |
|---|---|---|---|---|---|
| Rent | -10% $129 | -5% $192 | +0% $256 | +5% $319 | +10% $383 |
| Rate | -1.0pp $293 | -0.5pp $275 | base $256 | +0.5pp $236 | +1.0pp $216 |
UW: 25.0% down · 7.5% · 30yr · 1.5% tax · 5.0% vac · 8.0% maint · 8.0% mgmt
Financing live
Cash to close
- Down payment
- $18,750
- Closing costs
- $2,250
- Reserves months
- —
- Total cash needed
- —
Loan-product check · same deal, 3 products live
Conventional
25% down · 7.5% · 30yr
- Down + closing
- —
- Monthly P&I
- —
- Monthly cashflow
- —
- DSCR
- —
- Eligible?
- —
Personal DTI + credit; lowest rate.
DSCR
20% down · 8.5% · 30yr
- Down + closing
- —
- Monthly P&I
- —
- Monthly cashflow
- —
- DSCR
- —
- Eligible?
- —
No personal income docs; deal must DSCR.
Hard money
10% down · 12.0% · 12mo
- Down + closing
- —
- Monthly P&I
- —
- Monthly cashflow
- —
- DSCR
- —
- Eligible?
- —
Short-term bridge; refi at stabilization.
Rent comps 14 comps
| Address | Beds | Baths | Sqft | Rent | $/sqft | DOM | Units | Dist |
|---|---|---|---|---|---|---|---|---|
| 1312 Gordon Ave Calumet City, IL | 2.0 | 1.0 | 1134 | $1,600 | $1.41 | 9d | 1 | 0.80mi |
| 1338 Wentworth Ave Unit 1338 Calumet City, IL | 2.0 | 1.0 | 800 | $1,430 | $1.79 | 26d | 1 | 1.11mi |
| 331 157th St Calumet City, IL | 1.0 | 1.0 | 900 | $1,100 | $1.22 | 26d | 1 | 1.12mi |
| 671 Saginaw Ave Calumet City, IL | 3.0 | 2.0 | 1250 | $2,276 | $1.82 | 12d | 1 | 1.17mi |
| 34 Elizabeth St Calumet City, IL | 3.0 | 1.0 | 1246 | $2,400 | $1.93 | 0d | 1 | 1.30mi |
| 1539 Wentworth Ave Unit 3W Calumet City, IL | 3.0 | 1.0 | 1100 | $1,700 | $1.55 | 14d | 1 | 1.36mi |
| 115 157th St Unit 3 Calumet City, IL | 3.0 | 1.0 | 800 | $1,350 | $1.69 | 26d | 1 | 1.37mi |
| 3 Waltham St Hammond, IN | 3.0 | 1.0 | 1200 | $1,095 | $0.91 | 26d | 1 | 1.41mi |
| 5 Ruth St Unit 2W Hammond, IN | 2.0 | 1.0 | 900 | $1,250 | $1.39 | 14d | 1 | 1.43mi |
| 3 Ruth St Hammond, IN | 2.0 | 1.0 | 900 | $1,250 | $1.39 | 26d | 1 | 1.43mi |
| 659 Paxton Ave Calumet City, IL | 3.0 | 2.0 | 1255 | $2,461 | $1.96 | 12d | 1 | 1.45mi |
| 3007 Bernice Rd Unit 3007 1S Lansing, IL | 2.0 | 1.0 | 850 | $1,400 | $1.65 | 0d | 1 | 1.50mi |
| 3023 Bernice Rd Apt 2S Lansing, IL | 3.0 | 1.0 | 1000 | $1,600 | $1.60 | 0d | 1 | 1.50mi |
| 3023 Bernice Rd Unit 3030 3N Lansing, IL | 3.0 | 1.0 | 1000 | $1,400 | $1.40 | 0d | 1 | 1.50mi |
HOA detail condo
- Monthly dues
- $315 · $3,780/yr
- Assessments
- None detected in remarks — confirm with the listing agent.
Listing history 50 events
-
2026-06-21days on market $75,000 Active 95 DOM
-
2026-06-18days on market $75,000 Active 92 DOM
-
2026-06-17days on market $75,000 Active 91 DOM
-
2026-06-16days on market $75,000 Active 90 DOM
-
2026-06-15days on market $75,000 Active 89 DOM
-
2026-06-13days on market $75,000 Active 87 DOM
-
2026-06-09days on market $75,000 Active 83 DOM
-
2026-06-08days on market $75,000 Active 82 DOM
-
2026-06-07days on market $75,000 Active 81 DOM
-
2026-06-04days on market $75,000 Active 78 DOM
-
2026-06-03days on market $75,000 Active 77 DOM
-
2026-06-02days on market $75,000 Active 76 DOM
-
2026-06-01days on market $75,000 Active 75 DOM
-
2026-05-31days on market $75,000 Active 74 DOM
-
2026-03-18$75,000 Active
-
2025-05-31status Pending
-
2025-05-30historical
-
2025-04-22price
-
2025-02-19status Active
-
2025-02-19price
-
2024-12-18status Pending
-
2024-10-23Active
-
2020-09-21status Contingent (Do Not Show)
-
2020-09-21historical
-
2020-08-14New
-
2016-05-11soldstatus $15,000 Closed Sale
-
2016-03-14price $16,000
-
2016-03-14status Pending
-
2016-03-09price $16,500
-
2016-03-01price $17,700
-
2016-01-05status Reactivated
-
2015-10-23status Pending
-
2015-09-23price $18,000
-
2015-09-14price $18,500
-
2015-09-08price $19,250
-
2015-09-03price $19,500
-
2015-08-28price $21,500
-
2015-08-20price $22,500
-
2015-08-13price $24,500
-
2015-08-03price $27,500
-
2015-07-27price $28,500
-
2015-07-20price $29,500
-
2015-07-15price $30,500
-
2015-07-02status Reactivated
-
2015-06-21status Pending
-
2015-06-16price $31,500
-
2015-06-05$34,500 New
-
2013-02-23historical
-
2012-10-20price Price Change
-
2012-08-31price Reactivated
ⓘ Source: listings_history table (triggers on properties + properties_extension) + one-shot
backfill from property_details.listing_events for pre-trigger history.
Tax reassessment forecast IL · Partial reset (capped growth)
- Current annual tax
- $3,296 · $275/mo
- Projected year-2 tax
- $3,296 · $275/mo
- Expected delta
- $0/yr ($0/mo · 0.0%)
ⓘ Screening estimate from a state-policy table — verify with the county assessor before closing.
Climate risk First Street
- Flood 1/10 Low FEMA zone X (unshaded) · 0% chance over 30 yrs
- Wildfire 1/10 Low
- Heat 3/10 Moderate 7 d/yr ≥102°F today · 15 d/yr by 30 yrs out
- Wind 2/10 Low
- Air quality 4/10 Moderate 4 unhealthy d/yr today · 5 by 30 yrs out
Nearby sold comps map
Loading sold comps map…
Walkable amenities ~0.75 mi
Loading nearby amenities…
Taxation est. · year 1
- Rental income
- $19,288
- − Mortgage interest
- −$4,201
- − Property taxes
- −$3,296
- − Insurance
- −$375
- − Repairs & maintenance
- −$1,543
- − Management
- −$1,543
- − HOA
- −$3,780
- − Depreciation
- −$2,182
- Taxable income
- $2,368
- Est. tax owed @ 24.0%
- −$568
- After-tax cash flow
- $2,499/yr
For passive investors: Depreciation is non-cash, so a rental often shows a tax loss while cash-flowing — sheltering income. Rental losses are passive: they offset passive income freely, and up to $25,000/yr can offset ordinary (W-2) income if you actively participate and your MAGI is under $100k (phasing out to $0 by $150k); unused losses carry forward. On sale, claimed depreciation is recaptured at up to 25%, and gains may owe capital-gains tax (a 1031 exchange can defer both). Figures are a year-1 estimate at your 24.0% rate — not tax advice; consult a CPA.
Schools (NCES district)
- District
- Thornton Fractional Twp Hsd 215
- NCES district ID
- 1738940
- Math proficiency
- 9% ▼ -3.00%
- Reading proficiency
- 13% ▼ -3.00%
- Median HH income
- $48,207
- Composite
- 10.27/100
- National rank
- #9793
- State rank
- #563 of 620 in IL
Livability — Calumet City
- Score
- 71/100
- State rank
- #330
- US rank
- #6552
Category grades
Schools grade is shown separately in the Schools card above.
Census & demographics
- Census place
- Calumet City, IL
- County
- Cook County · 4,486,803 people
- City population
- 35,100
- Metro
- Chicago-Naperville-Elgin, IL-IN-WI
- Population (ZIP)
- 35,100
- Household income
- $55,369
- Rent vs Own
- Severe rent burden
- 2415.0
Population outlook (Cook County) Hauer SSP2
- Today (2025)
- 5,347,519 people
- By 2030
- 5,357,703 · +0.2%
- By 2040
- 5,324,924 · -0.4%
- By 2050
- 5,230,762 · -2.2%
- By 2075
- 4,785,735 · -10.5%
- By 2100
- 4,188,836 · -21.7%
Race, ethnicity, and origin ACS 2023
- Neighborhood character
- Predominantly Black (74%)
- Race & ethnicity
- Black 74% Hispanic / Latino 15% White 7% Two or more races 4%
- Hispanic origin (detail)
- Mexican 14%
- Common ancestry
- Romanian 2%
- Foreign-born
- 9% · Canada
- Languages at home
- 83% English-only · Spanish 14%
Political lean MEDSL · Cook
- 2024 margin
- Solid D (+42.0) · D 70.4% · R 28.4% · Other 1.2%
- 2008→2024 swing
- -11.4pp toward R · 2008: 53.4pp · 2024: 42.0pp
- All cycles
- 2024: D+42.0 2020: D+50.3 2016: D+53.0 2012: D+49.4 2008: D+53.4
Not yet ingested
- Civics
- —
Market trends
- HPI YoY
- ▼ -75.01%
- Current HPI
- 197.2137
- Rent YoY
- ▲ 6.17%
- Metro
- Chicago-Naperville-Elgin, IL-IN-WI
- State GDP YoY
- ▲ 1.59%
- F500 in state
- 60
Industry mix (Fortune 500 HQ in IL)
| Industry | F500 HQs | Revenue |
|---|---|---|
| Insurance | 4 | $201B |
|
||
| Consumer Goods | 4 | $87B |
|
||
| Industrial Machinery | 3 | $64B |
|
||
| Healthcare | 2 | $55B |
|
||
| Retail / Pharmacy | 1 | $148B |
|
||
| Agriculture / Food | 1 | $86B |
|
||
Price history
+82.9% since first listed47 events — show timeline
- 2026-03-18 Listed $75,000 MRED as Distributed by MLS Grid
- 2025-05-31 Pending — MRED as Distributed by MLS Grid
- 2025-05-30 Listing Removed — MRED as Distributed by MLS Grid
- 2025-04-22 Price Changed — MRED as Distributed by MLS Grid
- 2025-02-19 Relisted — MRED as Distributed by MLS Grid
- 2025-02-19 Price Changed — MRED as Distributed by MLS Grid
- 2024-12-18 Pending — MRED as Distributed by MLS Grid
- 2024-10-23 Listed — MRED as Distributed by MLS Grid
- 2020-09-21 Pending — MRED as Distributed by MLS Grid
- 2020-09-21 Listing Removed — MRED as Distributed by MLS Grid
- 2020-08-14 Listed — MRED as Distributed by MLS Grid
- 2016-05-11 Sold (MLS) $15,000 MRED as Distributed by MLS Grid
- 2016-03-14 Price Changed $16,000 MRED as Distributed by MLS Grid
- 2016-03-14 Pending — MRED as Distributed by MLS Grid
- 2016-03-09 Price Changed $16,500 MRED as Distributed by MLS Grid
- 2016-03-01 Price Changed $17,700 MRED as Distributed by MLS Grid
- 2016-01-05 Relisted — MRED as Distributed by MLS Grid
- 2015-10-23 Pending — MRED as Distributed by MLS Grid
- 2015-09-23 Price Changed $18,000 MRED as Distributed by MLS Grid
- 2015-09-14 Price Changed $18,500 MRED as Distributed by MLS Grid
- 2015-09-08 Price Changed $19,250 MRED as Distributed by MLS Grid
- 2015-09-03 Price Changed $19,500 MRED as Distributed by MLS Grid
- 2015-08-28 Price Changed $21,500 MRED as Distributed by MLS Grid
- 2015-08-20 Price Changed $22,500 MRED as Distributed by MLS Grid
- 2015-08-13 Price Changed $24,500 MRED as Distributed by MLS Grid
- 2015-08-03 Price Changed $27,500 MRED as Distributed by MLS Grid
- 2015-07-27 Price Changed $28,500 MRED as Distributed by MLS Grid
- 2015-07-20 Price Changed $29,500 MRED as Distributed by MLS Grid
- 2015-07-15 Price Changed $30,500 MRED as Distributed by MLS Grid
- 2015-07-02 Relisted — MRED as Distributed by MLS Grid
- 2015-06-21 Pending — MRED as Distributed by MLS Grid
- 2015-06-16 Price Changed $31,500 MRED as Distributed by MLS Grid
- 2015-06-05 Listed $34,500 MRED as Distributed by MLS Grid
- 2013-02-23 Listing Removed — MRED as Distributed by MLS Grid
- 2012-10-20 Price Changed — MRED as Distributed by MLS Grid
- 2012-08-31 Relisted — MRED as Distributed by MLS Grid
- 2012-08-31 Price Changed — MRED as Distributed by MLS Grid
- 2012-08-27 Pending — MRED as Distributed by MLS Grid
- 2012-08-16 Contingent — MRED as Distributed by MLS Grid
- 2012-04-29 Price Changed — MRED as Distributed by MLS Grid
- 2012-04-03 Price Changed — MRED as Distributed by MLS Grid
- 2012-03-10 Price Changed — MRED as Distributed by MLS Grid
- 2012-01-28 Price Changed — MRED as Distributed by MLS Grid
- 2011-10-28 Price Changed — MRED as Distributed by MLS Grid
- 2011-09-27 Listed — MRED as Distributed by MLS Grid
- 1998-07-08 Sold (Public Records) $69,000 Public Records
- 1990-06-28 Sold (Public Records) $41,000 Public Records
Property tax history
+5.5%/yrLatest (2023): $3,296 · +28.3% YoY. Source: county tax records.
Cash-flow waterfall
monthlySold comps — $/sqft
last 12 mo · ≤1 miLoading sold comps…