 Multi-family
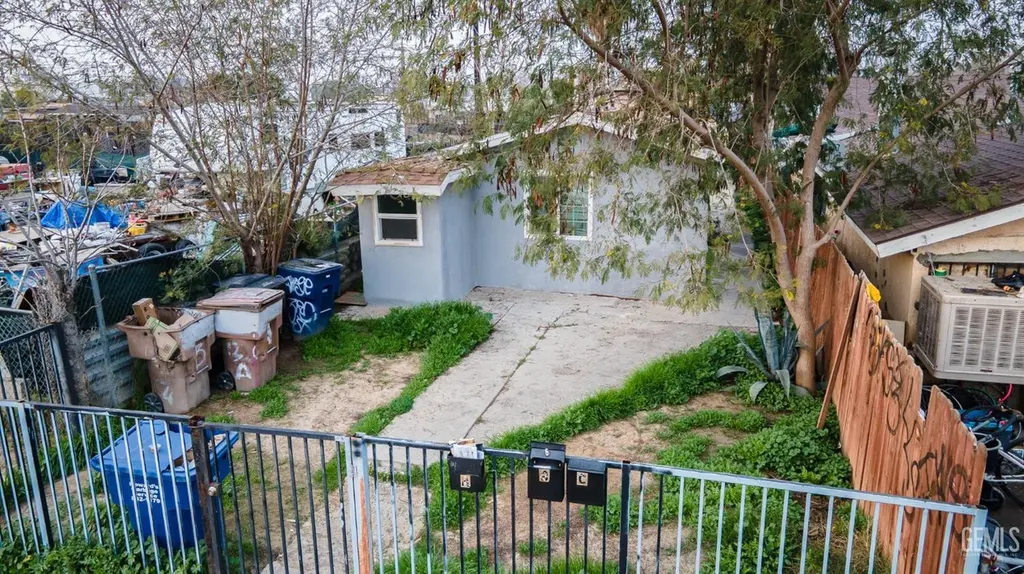
1324 Murdock St · Bakersfield, CA
Flood risk 1/10 · Minimal
- FEMA flood zone
- X (unshaded)
- Chance of flooding over 30 yrs
- 0.0%
- Est. flood insurance / yr
- $507 – $1,088
Fire risk 5/10 · Moderate
- Est. fire insurance / yr
- $659 – $1,223
Heat risk 8/10 · Major
- Hot days now (above 105°F)
- 7 days/yr
- Hot days in 30 yrs
- 19 days/yr
Wind risk 1/10 · Minimal
- Chance of severe wind over 30 yrs
- —
Air-quality risk 10/10 · Severe
- Unhealthy air days now
- 39 days/yr
- Unhealthy air days in 30 yrs
- 45 days/yr
Risk factors via First Street. Map © Google.
Why this score? — see what drove the B grade
The composite is a weighted blend of 9 inputs, each scored 0–100. Each bar is that input's sub-score; the figure is the points it added to the 100-point composite (weight × sub-score).
- Cash flow +30.0/30.0
- 1% rule +10.0/10.0
- DSCR +10.0/10.0
- ARV discount +8.0/15.0
- Rent growth +3.9/5.0
- Schools +3.4/10.0
- Livability +2.9/5.0
- Condition / age +2.5/5.0
- Appreciation +0.0/10.0
$239,900
🖨 Deal sheet 📄 Offer letter ✓ Due diligence
Multi-family units
County records classify this as Multi-Family (2-4 Unit). Listing-text estimate: 1 unit. estimate disagrees with records
Listing remarks MLS
great opportunity to purchase 3 units on one lot for awesome cashflow!
Key facts
- 3,484 sq ft lot
- Built 1945
- Listed 124 days
Neighborhood map
What this means for you Summary
Snapshot
- This is a 2-bed/3.0-bath multifamily listed at $240k.
Deal economics
- At list price, monthly cash flow is $1k ($17k/yr) — positive.
- The deal already cash-flows at list — no discount required.
- Meets the 1% rule at list price ($4k rent vs $240k).
- Recommended offer: $211k (12.0% below list) — sets the bar for market timing.
- Cap rate 13.4% vs local median 3.6% in Bakersfield — top-decile yield for the area; either an underpriced asset or a hidden risk that comps aren't pricing in. Stress-test before assuming the spread holds.
Location & tenants
- Location reads 58/100 on livability (#716 in CA) — a working-class tenant base; expect higher turnover. Strengths: housing A+; Watch: health & safety D, schools D-, crime F.
- Kern High (urban): math 21% / reading 51% proficiency, ranked #860 of 1,400 in CA (top 61%) — families likely to look elsewhere, expect single-tenant / working-renter base with shorter leases.
- Market conditions: Rents rising fast (+5.7%/yr); 311 active listings in the ZIP; 9 comparable units currently listed for rent nearby; rentals leasing fast (median 3d on market — plan ~1-2 weeks tenant-placement turnaround); 3,244 units permitted in Kern County in 2024 (73 in 5+ unit buildings).
- At $3,932/mo this rent would consume 84% of the median local household income ($56k/yr) (locally 3246% of renters already pay >50% of income on rent) — very limited rent-growth headroom before tenants either downsize or default.
Forward outlook
- Local home prices are declining (-3.0%/yr); year-one equity from $2k of loan paydown is wiped out by about $7k of value loss. Plan a longer hold.
- Kern County population projected at +17% by 2050 — long-run rental-demand tailwind backs the buy-and-hold thesis.
- At projected returns (-3.0% appreciation + 5.7% rent growth), your $67k cash investment doubles in ~5 years — after that, you're playing with house money.
Negotiation context
- It's been on market 124 days — a 12% lower offer ($211k) is reasonable based on typical stale-listing flexibility.
- 26 sale attempts since 20y ago with the ask held roughly flat each time — persistent listings suggest the price (not the market) is what's stuck; bring a comps-based counter.
Risks & watch-outs
- Watch-outs: built in 1945 — expect roof / HVAC / electrical / plumbing capex.
- Climate carrying-cost: moderate wildfire risk; extreme-heat days projected 7→19/yr by 2055 (HVAC capex compounding) — expect insurance premiums to compound above CPI over the hold.
Questions for the listing agent
- It's been on market 124 days. Have you received any prior offers? Is the seller open to a 12% concession, seller financing, or rate buy-down credit?
- Built in 1945 — when were the roof, HVAC, electrical panel, plumbing, and water heater last replaced?
- Why hasn't it sold? Are there any deal-killer items the seller is aware of (foundation, flood, title, zoning, code violations)?
- Is there a deadline driving the sale (1031 exchange, divorce, estate, relocation)? That informs how much negotiation room exists.
- Schools are D-rated, which usually means shorter tenancies and higher turnover. Who's the typical renter profile here, and what's been the actual vacancy rate?
- Crime grade is F in this area — have there been break-ins, vandalism, or insurance claims at this property in the last 3 years? What carrier currently insures it and at what premium?
- What's the average days-on-market for RENTAL listings here right now (not sales)? A rising rental-DOM trend means longer vacancies and softer asking-rent achievability than the comps imply.
- What's the recent tenant-quality profile in this submarket — average credit score on applications, eviction rate, late-payment / NSF rate, and stable-employment percentage? A property-management company in the area should have these aggregated.
- How much new apartment / multifamily construction is in the pipeline within 1–3 miles? Heavy new supply (>2% of stock underway) typically softens rents 12–24 months out; light construction supports rent growth.
Investment metrics
- 1% rule
- 1.64% ✓
- Cap rate
- 13.39%
- Cash-on-cash
- 25.35%
- DSCR
- 2.13
- GRM
- 5.1
CMA / ARV
- ARV (median comp)
- $242,815
- List price
- $239,900
- Delta
- -1.20%
- Verdict
- FAIR
- Comps
- 11 within 1.0 mi
Projected returns pro-forma
-3.0% appreciation · 5.71% rent growth · sell at horizon
- IRR
- 22.0%
- Equity multiple
- 1.93×
- Total profit
- $62,603
- Equity at exit
- $35,770
- IRR
- 31.8%
- Equity multiple
- 4.26×
- Total profit
- $218,986
- Equity at exit
- $20,742
Cash invested: $67,172 (down + closing). Projections, not guarantees.
Landlord ↔ Tenant lean methodology
- Overall (STATE)
- 18 Strongly Tenant-Friendly
- State California
- 18 Strongly Tenant-Friendly · D+13
- County
- — inherits STATE
- City
- — inherits STATE
ZIP-level market 93307
- Rents YoY
- 5.7%
- Active inventory
- 311
- Price-to-rent
- 15.3×
Monthly cashflow live
- Estimated rent
- $3,932 high interval (Pro) →
- Mortgage (P&I)
- −$1,258
- Tax from tax record
- −$329 /mo · $3,949/yr
- Insurance
- −$100
- HOA
- −$0
- Vacancy / Maint / Mgmt
- −$826
- Net cashflow
- $1,419
Break-even live
3-unit breakdown (identical units grouped — click to expand)
| Units | Beds | Baths | Est. rent |
|---|---|---|---|
| 3× units | 2 | 1 | $3,933 |
| #1 | 2 | 1 | $1,311 |
| #2 | 2 | 1 | $1,311 |
| #3 | 2 | 1 | $1,311 |
| Total (3 units) | $3,932 | ||
UW: 25.0% down · 7.5% · 30yr · 1.5% tax · 5.0% vac · 8.0% maint · 8.0% mgmt
Financing live
Cash to close
- Down payment
- $59,975
- Closing costs
- $7,197
- Reserves months
- —
- Total cash needed
- —
Loan-product check · same deal, 3 products live
Conventional
25% down · 7.5% · 30yr
- Down + closing
- —
- Monthly P&I
- —
- Monthly cashflow
- —
- DSCR
- —
- Eligible?
- —
Personal DTI + credit; lowest rate.
DSCR
20% down · 8.5% · 30yr
- Down + closing
- —
- Monthly P&I
- —
- Monthly cashflow
- —
- DSCR
- —
- Eligible?
- —
No personal income docs; deal must DSCR.
Hard money
10% down · 12.0% · 12mo
- Down + closing
- —
- Monthly P&I
- —
- Monthly cashflow
- —
- DSCR
- —
- Eligible?
- —
Short-term bridge; refi at stabilization.
Rent comps 9 comps
| Address | Beds | Baths | Sqft | Rent | $/sqft | DOM | Units | Dist |
|---|---|---|---|---|---|---|---|---|
| 345 Doctor Martin Luther King Junior Blvd Apt A Bakersfield, CA | 2.0 | 1.0 | 750 | $1,050 | $1.40 | 2d | 1 | 0.19mi |
| 113 Bliss St Bakersfield, CA | 1.0 | 1.0 | 500 | $1,000 | $2.00 | 2d | 1 | 0.73mi |
| 201 Truxtun Ave Unit B Bakersfield, CA | 2.0 | 1.0 | 640 | $1,100 | $1.72 | 2d | 1 | 1.18mi |
| 200 Truxtun Ave Unit C Bakersfield, CA | 1.0 | 1.0 | 643 | $975 | $1.52 | 2d | 1 | 1.21mi |
| 2006 Kentucky St Unit 25 Bakersfield, CA | 1.0 | 1.0 | 650 | $975 | $1.50 | 2d | 1 | 1.27mi |
| 1417 Oregon St Unit B Bakersfield, CA | 2.0 | 1.0 | 744 | $1,475 | $1.98 | 2d | 1 | 1.34mi |
| 1813 Oregon St Unit 1815-3 Bakersfield, CA | 2.0 | 1.0 | 700 | $1,050 | $1.50 | 2d | 1 | 1.41mi |
| 515 Niles St Unit C Bakersfield, CA | 1.0 | 1.0 | 624 | $1,000 | $1.60 | 2d | 1 | 1.43mi |
| 2190 Monterey St Unit 9 Bakersfield, CA | 2.0 | 1.0 | 700 | $1,050 | $1.50 | 10d | 1 | 1.48mi |
Listing history 50 events
-
2026-06-18days on market $239,900 Active 124 DOM
-
2026-06-17days on market $239,900 Active 123 DOM
-
2026-06-16days on market $239,900 Active 122 DOM
-
2026-06-15days on market $239,900 Active 121 DOM
-
2026-06-14pricedays on market $239,900 Active 119 DOM
-
2026-06-10days on market $250,000 Active 116 DOM
-
2026-06-09days on market $250,000 Active 115 DOM
-
2026-06-08days on market $250,000 Active 114 DOM
-
2026-06-07days on market $250,000 Active 113 DOM
-
2026-06-05days on market $250,000 Active 110 DOM
-
2026-06-03days on market $250,000 Active 109 DOM
-
2026-06-03days on market $250,000 Active 108 DOM
-
2026-06-01days on market $250,000 Active 107 DOM
-
2026-05-31days on market $250,000 Active 106 DOM
-
2026-03-30status Active 70-char remark
Show marketing remark (70 chars)
great opportunity to purchase 3 units on one lot for awesome cashflow!
-
2026-03-05status Pending 70-char remark
Show marketing remark (70 chars)
great opportunity to purchase 3 units on one lot for awesome cashflow!
-
2026-01-20$250,000 Active 70-char remark
Show marketing remark (70 chars)
great opportunity to purchase 3 units on one lot for awesome cashflow!
-
2025-12-19historical
-
2025-09-03status Active
-
2025-08-22historical Active Under Contract
-
2025-06-03status Active
-
2025-05-20historical Active Under Contract
-
2025-05-09$268,000 Active
-
2025-01-13$324,999 Active
-
2024-06-28status Pending Sale
-
2024-06-28soldstatus $224,500 Closed Sale
-
2024-06-28soldstatus $224,500 Sold
-
2024-06-28soldstatus $224,500
-
2024-06-27status Pending
-
2024-06-27price $224,500
-
2024-05-28historical Active Under Contract
-
2024-05-28historical Active - Contingent
-
2024-04-26$229,000 Active
-
2024-04-26$229,000 Active
-
2013-02-08soldstatus $37,000
-
2013-02-08soldstatus $37,000
-
2013-01-30historical
-
2013-01-30price $39,900
-
2013-01-11$37,000
-
2013-01-08soldstatus $28,000
-
2012-12-28historical
-
2012-12-11$21,000
-
2007-07-30historical
-
2007-07-01historical
-
2007-06-22$175,000
-
2007-05-17$190,000
-
2007-05-16historical
-
2007-03-27$200,000
-
2007-03-20historical
-
2007-03-16historical
ⓘ Source: listings_history table (triggers on properties + properties_extension) + one-shot
backfill from property_details.listing_events for pre-trigger history.
Tax reassessment forecast CA · Resets to sale price
- Current annual tax
- $3,949 · $329/mo
- Projected year-2 tax
- $3,949 · $329/mo
- Expected delta
- $0/yr ($0/mo · 0.0%)
ⓘ Screening estimate from a state-policy table — verify with the county assessor before closing.
Climate risk First Street
- Flood 1/10 Low FEMA zone X (unshaded) · 0% chance over 30 yrs
- Wildfire 5/10 Major
- Heat 8/10 Severe 7 d/yr ≥105°F today · 19 d/yr by 30 yrs out
- Wind 1/10 Low
- Air quality 10/10 Extreme 39 unhealthy d/yr today · 45 by 30 yrs out
Nearby sold comps map
Loading sold comps map…
Walkable amenities ~0.75 mi
Loading nearby amenities…
Taxation est. · year 1
- Rental income
- $47,184
- − Mortgage interest
- −$13,438
- − Property taxes
- −$3,949
- − Insurance
- −$1,200
- − Repairs & maintenance
- −$3,775
- − Management
- −$3,775
- − Depreciation
- −$6,979
- Taxable income
- $14,069
- Est. tax owed @ 24.0%
- −$3,377
- After-tax cash flow
- $13,654/yr
For passive investors: Depreciation is non-cash, so a rental often shows a tax loss while cash-flowing — sheltering income. Rental losses are passive: they offset passive income freely, and up to $25,000/yr can offset ordinary (W-2) income if you actively participate and your MAGI is under $100k (phasing out to $0 by $150k); unused losses carry forward. On sale, claimed depreciation is recaptured at up to 25%, and gains may owe capital-gains tax (a 1031 exchange can defer both). Figures are a year-1 estimate at your 24.0% rate — not tax advice; consult a CPA.
Schools (NCES district)
- District
- Kern High
- NCES district ID
- 0619540
- Math proficiency
- 21% ▬ 0.00%
- Reading proficiency
- 51% ▲ 2.00%
- Median HH income
- $49,686
- Composite
- 33.68/100
- National rank
- #10443
- State rank
- #860 of 1400 in CA
Livability — Bakersfield
- Score
- 58/100
- State rank
- #716
- US rank
- #21355
Category grades
Schools grade is shown separately in the Schools card above.
Census & demographics
- Census place
- Bakersfield, CA
- County
- Kern County · 710,371 people
- City population
- 499,124
- Metro
- Bakersfield, CA
- Population (ZIP)
- 85,945
- Household income
- $56,446
- Rent vs Own
- Severe rent burden
- 3246.0
Population outlook (Kern County) Hauer SSP2
- Today (2025)
- 947,286 people
- By 2030
- 978,984 · +3.3%
- By 2040
- 1,045,018 · +10.3%
- By 2050
- 1,105,232 · +16.7%
- By 2075
- 1,229,538 · +29.8%
- By 2100
- 1,238,059 · +30.7%
Race, ethnicity, and origin ACS 2023
- Neighborhood character
- Predominantly Hispanic (80%)
- Race & ethnicity
- Hispanic / Latino 80% Two or more races 12% White 10% Black 6% Asian 3% Native American 1%
- Hispanic origin (detail)
- Mexican 73%
- Common ancestry
- Lithuanian 0%
- Foreign-born
- 31% · Canada
- Languages at home
- 28% English-only · Spanish 69% Other Indo-European 1% Arabic 1%
Political lean MEDSL · Kern
- 2024 margin
- Strong R (+21.1) · D 38.2% · R 59.3% · Other 2.5%
- 2008→2024 swing
- -3.3pp toward R · 2008: -17.8pp · 2024: -21.1pp
- All cycles
- 2024: R+21.1 2020: R+10.2 2016: R+15.0 2012: R+20.9 2008: R+17.8
Not yet ingested
- Civics
- —
Market trends
- HPI YoY
- ▼ -263.59%
- Current HPI
- 447.1746
- Rent YoY
- ▲ 5.71%
- Metro
- Bakersfield, CA
- State GDP YoY
- ▲ 3.21%
- F500 in state
- 116
Industry mix (Fortune 500 HQ in CA)
| Industry | F500 HQs | Revenue |
|---|---|---|
| Technology | 27 | $1,492B |
|
||
| Financial Services | 3 | $174B |
|
||
| Retail | 3 | $44B |
|
||
| Insurance | 3 | $26B |
|
||
| Media / Entertainment | 2 | $115B |
|
||
| Pharmaceuticals / Biotech | 2 | $62B |
|
||
Price history
+63.9% since first listed63 events — show timeline
- 2026-03-30 Relisted — GEMLS
- 2026-03-05 Pending — GEMLS
- 2026-01-20 Listed $250,000 GEMLS
- 2025-12-19 Listing Removed — CRMLS
- 2025-09-03 Relisted — CRMLS
- 2025-08-22 Contingent — CRMLS
- 2025-06-03 Relisted — CRMLS
- 2025-05-20 Contingent — CRMLS
- 2025-05-09 Listed $268,000 CRMLS
- 2025-01-13 Listed $324,999 GEMLS
- 2024-06-28 Pending — CRMLS
- 2024-06-28 Sold (Public Records) $224,500 Public Records
- 2024-06-28 Sold (MLS) $224,500 GEMLS
- 2024-06-28 Sold (MLS) $224,500 CRMLS
- 2024-06-27 Pending — GEMLS
- 2024-06-27 Price Changed $224,500 GEMLS
- 2024-05-28 Contingent — CRMLS
- 2024-05-28 Contingent — GEMLS
- 2024-04-26 Listed $229,000 GEMLS
- 2024-04-26 Listed $229,000 CRMLS
- 2013-02-08 Sold (Public Records) $37,000 Public Records
- 2013-02-08 Sold (MLS) $37,000 GEMLS
- 2013-01-30 Price Changed $39,900 GEMLS
- 2013-01-30 Delisted — GEMLS
- 2013-01-11 Listed $37,000 GEMLS
- 2013-01-08 Sold (MLS) $28,000 CRMLS
- 2012-12-28 Listing Removed — CRMLS
- 2012-12-11 Listed $21,000 CRMLS
- 2007-07-30 Listing Removed — CRMLS
- 2007-07-01 Listing Removed — CRMLS
- 2007-06-22 Listed $175,000 CRMLS
- 2007-05-17 Listed $190,000 CRMLS
- 2007-05-16 Listing Removed — CRMLS
- 2007-03-27 Listed $200,000 CRMLS
- 2007-03-20 Listing Removed — CRMLS
- 2007-03-16 Listing Removed — CRMLS
- 2007-02-02 Listed $200,000 CRMLS
- 2007-01-06 Listing Removed — CRMLS
- 2007-01-03 Listed $199,999 CRMLS
- 2006-12-31 Listing Removed — CRMLS
- 2006-12-02 Listing Removed — CRMLS
- 2006-12-02 Listed $175,000 CRMLS
- 2006-12-02 Listed $190,000 CRMLS
- 2006-12-01 Listing Removed — CRMLS
- 2006-11-11 Listed $190,000 CRMLS
- 2006-11-11 Listed $195,000 CRMLS
- 2006-11-01 Listing Removed — CRMLS
- 2006-09-28 Listed $205,000 CRMLS
- 2006-09-19 Listing Removed — CRMLS
- 2006-09-18 Listing Removed — CRMLS
- 2006-07-19 Listed $200,000 CRMLS
- 2006-07-18 Listed $215,000 CRMLS
- 2006-07-01 Listing Removed — CRMLS
- 2006-06-30 Listing Removed — CRMLS
- 2006-06-02 Listed $220,000 CRMLS
- 2006-06-01 Listed $250,000 CRMLS
- 2006-05-25 Listing Removed — CRMLS
- 2006-04-26 Price Changed $149,900 GEMLS
- 2006-04-24 Listed $250,000 CRMLS
- 2006-04-21 Sold (Public Records) $152,500 Public Records
- 2006-04-21 Sold (MLS) $152,500 GEMLS
- 2006-01-26 Delisted — GEMLS
- 2006-01-13 Listed $152,500 GEMLS
Property tax history
+7.8%/yrLatest (2025): $3,949 · +101.7% YoY. Source: county tax records.
Cash-flow waterfall
monthlySold comps — $/sqft
last 12 mo · ≤1 miLoading sold comps…