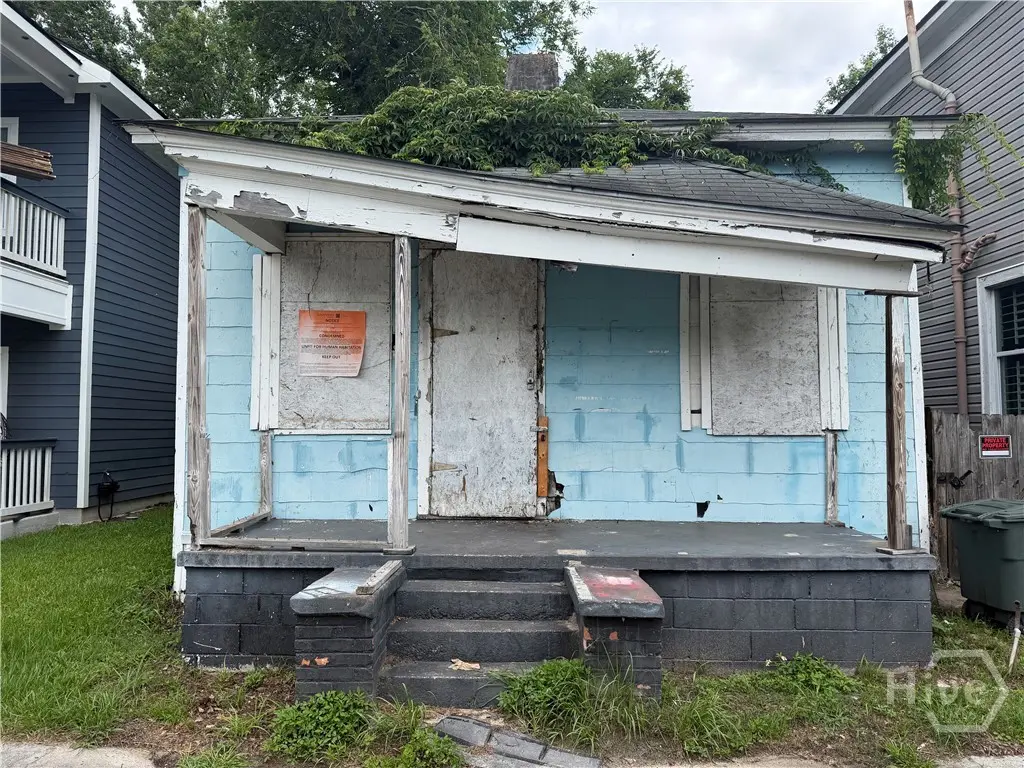
1010 E 38th St · Savannah, GA
Flood risk 1/10 · Minimal
- FEMA flood zone
- X (unshaded)
- Chance of flooding over 30 yrs
- 0.0%
- Est. flood insurance / yr
- $507 – $1,088
Fire risk 1/10 · Minimal
- Est. fire insurance / yr
- $963 – $1,789
Heat risk 10/10 · Severe
- Hot days now (above 107°F)
- 7 days/yr
- Hot days in 30 yrs
- 18 days/yr
Wind risk 9/10 · Severe
- Chance of severe wind over 30 yrs
- 99.0%
Air-quality risk 5/10 · Moderate
- Unhealthy air days now
- 7 days/yr
- Unhealthy air days in 30 yrs
- 8 days/yr
Risk factors via First Street. Map © Google.
Why this score? — see what drove the B- grade
The composite is a weighted blend of 9 inputs, each scored 0–100. Each bar is that input's sub-score; the figure is the points it added to the 100-point composite (weight × sub-score).
- Cash flow +30.0/30.0
- 1% rule +10.0/10.0
- DSCR +10.0/10.0
- ARV discount +7.5/15.0
- Livability +4.3/5.0
- Rent growth +3.2/5.0
- Condition / age +2.5/5.0
- Schools +2.0/10.0
- Appreciation +0.0/10.0
$80,000
🖨 Deal sheet 📄 Offer letter ✓ Due diligence
Listing remarks
Investor Special. Looking to buy and invest in an area that HOT HOT HOT right now. This home has potential and is ready for your imagination to run wild. Quiet Title has been completed. Being sold AS-IS with no Disclosure or warranties. Bring a flash light and walk carefully.
Key facts
- 2,579 sq ft lot
- Built 1921
- Listed 5 days
Property features AI
Exterior
- Utilities: Public water; Public sewer; Cable service not available
- Home design: Single-family residence; One story
- Construction: Asbestos construction material
- Exterior features: Lot in R4 zoning
Interior
- Bathrooms: 1 full bathroom
- Heating & cooling: No heating; No cooling
- Interior features: One full bathroom
- Laundry & utility: No laundry features listed
Neighborhood map
What this means for you Summary
Snapshot
- This is a 2-bed/1.0-bath single-family listed at $80k.
Deal economics
- At list price, monthly cash flow is $763 ($9k/yr) — positive.
- The deal already cash-flows at list — no discount required.
- Meets the 1% rule at list price ($2k rent vs $80k).
- Cap rate 17.7% vs local median 4.0% in Savannah — top-decile yield for the area; either an underpriced asset or a hidden risk that comps aren't pricing in. Stress-test before assuming the spread holds.
Location & tenants
- Location reads 86/100 on livability (#1 in GA, #397 nationally) — a professional / high-income tenant draw. Strengths: crime A+, amenities A+, commute A+; Watch: employment D, schools F.
- Savannah-Chatham County (urban): math 20% / reading 26% proficiency, ranked #134 of 174 in GA (top 77%) — low school quality limits family demand, transient renter base, plan for 1-2y turnover.
- Market conditions: Rents rising (+3.0%/yr); 333 active listings in the ZIP; 40 comparable units currently listed for rent nearby; rentals lingering (median 44d on market — plan ~5-8 weeks vacancy on turnover, expect pricing pressure); 50% of comp listings sitting > 30 days — soft ceiling on asking rent; 2,694 units permitted in Chatham County in 2024 (973 in 5+ unit buildings).
- This rent runs 41% of the median local income ($53k/yr) — at the standard rent-burdened threshold; future hikes will face affordability resistance.
Forward outlook
- Local home prices are declining (-3.0%/yr); year-one equity from $553 of loan paydown is wiped out by about $2k of value loss. Plan a longer hold.
- Chatham County population projected at +33% by 2050 — long-run rental-demand tailwind backs the buy-and-hold thesis.
- At projected returns (-3.0% appreciation + 3.0% rent growth), your $22k cash investment doubles in ~3 years — after that, you're playing with house money.
Negotiation context
- Only 5 days on market — expect competitive offers; lowballing is unlikely to land.
- 5 sale attempts since 4y ago with the ask held roughly flat each time — persistent listings suggest the price (not the market) is what's stuck; bring a comps-based counter.
Risks & watch-outs
- Watch-outs: property tax is 3.0% of price; built in 1921 — expect roof / HVAC / electrical / plumbing capex.
- Climate carrying-cost: severe wind risk, 99% chance of damaging wind over 30y; extreme-heat days projected 7→18/yr by 2055 (HVAC capex compounding) — expect insurance premiums to compound above CPI over the hold.
Questions for the listing agent
- Built in 1921 — when were the roof, HVAC, electrical panel, plumbing, and water heater last replaced?
- Property tax is high relative to price — has the assessment been appealed recently, and will the sale trigger a re-assessment?
- Is there a deadline driving the sale (1031 exchange, divorce, estate, relocation)? That informs how much negotiation room exists.
- Schools are F-rated, which usually means shorter tenancies and higher turnover. Who's the typical renter profile here, and what's been the actual vacancy rate?
- What's the average days-on-market for RENTAL listings here right now (not sales)? A rising rental-DOM trend means longer vacancies and softer asking-rent achievability than the comps imply.
- What's the recent tenant-quality profile in this submarket — average credit score on applications, eviction rate, late-payment / NSF rate, and stable-employment percentage? A property-management company in the area should have these aggregated.
- How much new for-sale + rental construction is in the pipeline within 1–3 miles? Heavy new supply typically softens prices + rents 12–24 months out; constrained supply supports both.
Investment metrics
- 1% rule
- 2.24% ✓
- Cap rate
- 17.74%
- Cash-on-cash
- 40.90%
- DSCR
- 2.82
- GRM
- 3.7
CMA / ARV
- ARV (on-the-fly)
- $243,080
- Comps found
- 12
Show comp detail 12 sales within ~0.75 mi
| Address | Dist | Beds/Ba | Sqft | Sold | Price | $/sf | Match |
|---|---|---|---|---|---|---|---|
| 1017 E 37th St | 0.07mi | 2/1.0 | 879 (+7%) | 2mo | $123,000 | $140 | 84 |
| 1308 SE 36th St | 0.33mi | 2/1.0 | 832 (+1%) | 6mo | $299,000 | $359 | 78 |
| 1315 E 38th St | 0.35mi | 2/1.0 | 854 (+4%) | 10mo | $252,000 | $295 | 70 |
| 1016 Seiler Ave | 0.05mi | 2/1.5 | 928 (+13%) | 10mo | $377,560 | $407 | 66 |
| 1323 E 42nd St | 0.41mi | 2/1.0 | 780 (-5%) | 7mo | $230,000 | $295 | 66 |
| 1331 E 42nd St | 0.44mi | 2/1.0 | 910 (+10%) | 4mo | $272,500 | $299 | 58 |
| 705 E 32nd St | 0.46mi | 2/1.0 | 726 (-12%) | 3mo | $197,000 | $271 | 56 |
| 1401 NE 36th St | 0.43mi | 2/1.0 | 940 (+14%) | 2mo | $210,000 | $223 | 54 |
| 1226 E 48th St | 0.57mi | 2/1.0 | 868 (+5%) | 13mo | $365,000 | $421 | 54 |
| 712 E Anderson St | 0.56mi | 2/1.0 | 888 (+8%) | 11mo | $155,000 | $175 | 52 |
| 1407 E 33rd St | 0.51mi | 2/1.0 | 754 (-8%) | 13mo | $245,000 | $325 | 51 |
| 830 E Park Ave | 0.67mi | 2/1.0 | 933 (+13%) | 14mo | $260,000 | $279 | 35 |
Match score weights: distance 35% · size 25% · config 20% · recency 20%. Top-matched comps best support the ARV.
Projected returns pro-forma
-3.0% appreciation · 2.95% rent growth · sell at horizon
- IRR
- 37.4%
- Equity multiple
- 2.59×
- Total profit
- $35,661
- Equity at exit
- $11,928
- IRR
- 44.0%
- Equity multiple
- 5.18×
- Total profit
- $93,660
- Equity at exit
- $6,917
Cash invested: $22,400 (down + closing). Projections, not guarantees.
Landlord ↔ Tenant lean methodology
- Overall (STATE)
- 90 Strongly Landlord-Friendly
- State Georgia
- 90 Strongly Landlord-Friendly · R+3
- County
- — inherits STATE
- City
- — inherits STATE
ZIP-level market 31401
- Rents YoY
- 3.0%
- Active inventory
- 333
- Price-to-rent
- 3.7×
Monthly cashflow live
- Estimated rent
- $1,795 high interval (Pro) →
- Mortgage (P&I)
- −$420
- Tax from tax record
- −$202 /mo · $2,422/yr
- Insurance
- −$33
- HOA
- −$0
- Vacancy / Maint / Mgmt
- −$377
- Net cashflow
- $763
Break-even live
UW: 25.0% down · 7.5% · 30yr · 1.5% tax · 5.0% vac · 8.0% maint · 8.0% mgmt
Financing live
Cash to close
- Down payment
- $20,000
- Closing costs
- $2,400
- Reserves months
- —
- Total cash needed
- —
Loan-product check · same deal, 3 products live
Conventional
25% down · 7.5% · 30yr
- Down + closing
- —
- Monthly P&I
- —
- Monthly cashflow
- —
- DSCR
- —
- Eligible?
- —
Personal DTI + credit; lowest rate.
DSCR
20% down · 8.5% · 30yr
- Down + closing
- —
- Monthly P&I
- —
- Monthly cashflow
- —
- DSCR
- —
- Eligible?
- —
No personal income docs; deal must DSCR.
Hard money
10% down · 12.0% · 12mo
- Down + closing
- —
- Monthly P&I
- —
- Monthly cashflow
- —
- DSCR
- —
- Eligible?
- —
Short-term bridge; refi at stabilization.
Rent comps 40 comps
| Address | Beds | Baths | Sqft | Rent | $/sqft | DOM | Units | Dist |
|---|---|---|---|---|---|---|---|---|
| 1205 E 38th St Savannah, GA | 2.0 | 1.0 | 1000 | $1,595 | $1.59 | 44d | 1 | 0.19mi |
| 1224 E 38th St Savannah, GA | 2.0 | 1.0 | 798 | $1,550 | $1.94 | 44d | 1 | 0.25mi |
| 914 E 34th St Unit 916 Savannah, GA | 3.0 | 1.0 | 935 | $1,995 | $2.13 | 23d | 1 | 0.26mi |
| 1220 E Victory Dr Savannah, GA | 2.0 | 1.0 | 1000 | $1,800 | $1.80 | 44d | 1 | 0.33mi |
| 701 E 41st St Savannah, GA | 1.0 | 1.0 | 850 | $1,625 | $1.91 | 44d | 1 | 0.35mi |
| 1226 E Victory Dr Apt 4 Savannah, GA | 2.0 | 1.0 | 950 | $1,675 | $1.76 | 44d | 1 | 0.35mi |
| 736 E 45th St Unit 1 Savannah, GA | 1.0 | 1.0 | 1000 | $1,499 | $1.50 | 14d | 1 | 0.35mi |
| 1326 E 38th St Savannah, GA | 2.0 | 1.0 | 800 | $1,600 | $2.00 | 14d | 1 | 0.36mi |
| 1317 E 38th St Savannah, GA | 1.0 | 1.0 | 750 | $2,000 | $2.67 | 44d | 1 | 0.36mi |
| 1303 E 33rd St Savannah, GA | 2.0 | 1.0 | 561 | $1,150 | $2.05 | 14d | 1 | 0.41mi |
| 1305 E 32nd St Savannah, GA | 2.0 | 1.0 | 832 | $2,400 | $2.88 | 14d | 1 | 0.45mi |
| 625 E 41st St Savannah, GA | 2.0 | 1.0 | 1000 | $2,500 | $2.50 | 44d | 1 | 0.47mi |
| 1418 E 42nd St Unit 4 Savannah, GA | 1.0 | 1.0 | 900 | $1,250 | $1.39 | 23d | 1 | 0.48mi |
| 704 E 32nd St Unit B Savannah, GA | 1.0 | 1.0 | 550 | $1,550 | $2.82 | 23d | 1 | 0.48mi |
| 1418 E 42nd St Unit 1 Savannah, GA | 1.0 | 1.0 | 800 | $1,100 | $1.38 | 44d | 1 | 0.48mi |
| 1418 E 42nd St Unit 2 Savannah, GA | 1.0 | 1.0 | 800 | $1,100 | $1.38 | 23d | 1 | 0.48mi |
| 1207 E Anderson St Unit B Savannah, GA | 2.0 | 1.0 | 1000 | $1,640 | $1.64 | 23d | 1 | 0.48mi |
| 1709 Le Grand St Unit 1709 Savannah, GA | 2.0 | 1.0 | 1080 | $1,595 | $1.48 | 44d | 1 | 0.49mi |
| 1401 E 33rd St Savannah, GA | 3.0 | 1.0 | 960 | $1,650 | $1.72 | 44d | 1 | 0.49mi |
| 533 E 38th St Savannah, GA | 1.0 | 1.5 | 745 | $1,500 | $2.01 | 44d | 1 | 0.52mi |
| 1203 E Henry St Savannah, GA | 2.0 | 1.0 | 916 | $1,475 | $1.61 | 44d | 1 | 0.53mi |
| 1315 E Anderson St Unit 1315 Savannah, GA | 2.0 | 2.0 | 859 | $1,500 | $1.75 | 44d | 1 | 0.55mi |
| 530 E 35th St Unit B Savannah, GA | 1.0 | 1.0 | 950 | $1,695 | $1.78 | 21d | 1 | 0.56mi |
| 1226 E Henry St Unit B Savannah, GA | 2.0 | 1.0 | 882 | $1,300 | $1.47 | 44d | 1 | 0.58mi |
| 637 E Anderson St Unit B Savannah, GA | 2.0 | 1.0 | 850 | $1,700 | $2.00 | 44d | 1 | 0.59mi |
| 637 E Anderson St Savannah, GA | 1.0 | 1.0 | 705 | $1,575 | $2.23 | 14d | 1 | 0.59mi |
| 637 E Anderson St Unit D Savannah, GA | 2.0 | 1.0 | 850 | $1,450 | $1.71 | 44d | 1 | 0.59mi |
| 637 E Anderson St Unit A Savannah, GA | 2.0 | 1.0 | 850 | $1,850 | $2.18 | 44d | 1 | 0.59mi |
| 702 E Henry St Unit B Savannah, GA | 2.0 | 1.0 | 750 | $1,800 | $2.40 | 14d | 1 | 0.61mi |
| 412 Seiler Ave Unit A Savannah, GA | 1.0 | 1.0 | 651 | $1,400 | $2.15 | 44d | 1 | 0.65mi |
| 1203 Atlantic Ave Savannah, GA | 1.0 | 1.0 | 550 | $1,200 | $2.18 | 14d | 1 | 0.65mi |
| 810 E Park Ave Unit B Savannah, GA | 3.0 | 2.0 | 1100 | $2,700 | $2.45 | 44d | 1 | 0.66mi |
| 512 E 33rd St Unit 1244808P Savannah, GA | 2.0 | 2.0 | 990 | $3,196 | $3.23 | 14d | 1 | 0.67mi |
| 1800 E 38th St Savannah, GA | 2.0 | 1.0 | 846 | $1,338 | $1.58 | 44d | 1 | 0.68mi |
| 410 E Victory Dr Savannah, GA | 1.0 | 1.0 | 588 | $2,200 | $3.74 | 23d | 1 | 0.70mi |
| 613 E Duffy Ln Unit A Savannah, GA | 2.0 | 2.0 | 1066 | $1,950 | $1.83 | 14d | 1 | 0.72mi |
| 1716 Habersham St Apt 6 Savannah, GA | 2.0 | 1.5 | 1100 | $2,200 | $2.00 | 21d | 1 | 0.73mi |
| 762 E Waldburg St Savannah, GA | 2.0 | 1.0 | 700 | $1,650 | $2.36 | 23d | 1 | 0.74mi |
| 616 E Duffy St Savannah, GA | 2.0 | 2.0 | 860 | $2,500 | $2.91 | 14d | 1 | 0.75mi |
| 614 E Duffy St Savannah, GA | 2.0 | 2.0 | 817 | $1,800 | $2.20 | 14d | 1 | 0.75mi |
Listing history 4 events
-
2026-06-07statusdays on market $80,000 Pending 5 DOM
-
2026-06-05days on market $80,000 Active 2 DOM
-
2026-06-03remarks 276-char remark
-
2026-06-03$80,000 Active 1 DOM
ⓘ Source: listings_history table (triggers on properties + properties_extension) + one-shot
backfill from property_details.listing_events for pre-trigger history.
Tax reassessment forecast GA · Resets to sale price
- Current annual tax
- $2,422 · $202/mo
- Projected year-2 tax
- $2,422 · $202/mo
- Expected delta
- $0/yr ($0/mo · 0.0%)
ⓘ Screening estimate from a state-policy table — verify with the county assessor before closing.
Climate risk First Street
- Flood 1/10 Low FEMA zone X (unshaded) · 0% chance over 30 yrs
- Wildfire 1/10 Low
- Heat 10/10 Extreme 7 d/yr ≥107°F today · 18 d/yr by 30 yrs out
- Wind 9/10 Extreme 99% chance of damaging wind over 30 yrs
- Air quality 5/10 Major 7 unhealthy d/yr today · 8 by 30 yrs out
Nearby sold comps map
Loading sold comps map…
Walkable amenities ~0.75 mi
Loading nearby amenities…
Taxation est. · year 1
- Rental income
- $21,542
- − Mortgage interest
- −$4,481
- − Property taxes
- −$2,422
- − Insurance
- −$400
- − Repairs & maintenance
- −$1,723
- − Management
- −$1,723
- − Depreciation
- −$2,327
- Taxable income
- $8,464
- Est. tax owed @ 24.0%
- −$2,031
- After-tax cash flow
- $7,130/yr
For passive investors: Depreciation is non-cash, so a rental often shows a tax loss while cash-flowing — sheltering income. Rental losses are passive: they offset passive income freely, and up to $25,000/yr can offset ordinary (W-2) income if you actively participate and your MAGI is under $100k (phasing out to $0 by $150k); unused losses carry forward. On sale, claimed depreciation is recaptured at up to 25%, and gains may owe capital-gains tax (a 1031 exchange can defer both). Figures are a year-1 estimate at your 24.0% rate — not tax advice; consult a CPA.
Schools (NCES district)
- District
- Savannah-Chatham County
- NCES district ID
- 1301020
- Math proficiency
- 20% ▼ -11.00%
- Reading proficiency
- 26% ▼ -5.00%
- Median HH income
- $47,443
- Composite
- 20.14/100
- National rank
- #8639
- State rank
- #134 of 174 in GA
Livability — Savannah
- Score
- 86/100
- State rank
- #1
- US rank
- #397
Category grades
Schools grade is shown separately in the Schools card above.
Census & demographics
- Census place
- Savannah, GA
- County
- Chatham County · 271,602 people
- City population
- 216,564
- Metro
- Savannah, GA
- Population (ZIP)
- 20,445
- Household income
- $52,509
- Rent vs Own
- Severe rent burden
- 2031.0
Population outlook (Chatham County) Hauer SSP2
- Today (2025)
- 332,584 people
- By 2030
- 355,508 · +6.9%
- By 2040
- 400,030 · +20.3%
- By 2050
- 443,019 · +33.2%
- By 2075
- 534,579 · +60.7%
- By 2100
- 583,863 · +75.6%
Race, ethnicity, and origin ACS 2023
- Neighborhood character
- Diverse neighborhood (Simpson 0.59)
- Race & ethnicity
- White 53% Black 35% Hispanic / Latino 7% Two or more races 5% Asian 3%
- Hispanic origin (detail)
- Mexican 2% Puerto Rican 2%
- Common ancestry
- Slovak 2% Lithuanian 2% Romanian 2%
- Foreign-born
- 8% · Canada, China
- Languages at home
- 90% English-only · Spanish 4% Chinese 2% Other Indo-European 1%
Political lean MEDSL · Chatham
- 2024 margin
- D (+18.0) · D 58.6% · R 40.6%
- 2008→2024 swing
- +3.6pp toward D · 2008: 14.4pp · 2024: 18.0pp
- All cycles
- 2024: D+18.0 2020: D+18.8 2016: D+14.5 2012: D+12.0 2008: D+14.4
Not yet ingested
- Civics
- —
Market trends
- HPI YoY
- ▼ -358.74%
- Current HPI
- 553.5645
- Rent YoY
- ▲ 2.95%
- Metro
- Savannah, GA
- State GDP YoY
- ▲ 2.66%
- F500 in state
- 28
Industry mix (Fortune 500 HQ in GA)
| Industry | F500 HQs | Revenue |
|---|---|---|
| Paper / Packaging | 2 | $29B |
|
||
| Retail | 1 | $160B |
|
||
| Transportation / Logistics | 1 | $91B |
|
||
| Airlines | 1 | $62B |
|
||
| Consumer Goods | 1 | $47B |
|
||
| Utilities | 1 | $25B |
|
||
Price history
+14.4% since first listed9 events — show timeline
- 2026-06-02 Listed $80,000 Hive MLS
- 2024-05-02 Listing Removed — Hive MLS
- 2024-05-02 Listing Removed — Hive MLS
- 2024-04-24 Listed $99,900 Hive MLS
- 2024-04-24 Listed $99,900 Hive MLS
- 2022-11-18 Listing Removed — Hive MLS
- 2022-11-18 Listing Removed — Hive MLS
- 2022-11-01 Listed $69,900 Hive MLS
- 2022-11-01 Listed $69,900 Hive MLS
Property tax history
+23.5%/yrLatest (2025): $2,422 · +22.8% YoY. Source: county tax records.
Cash-flow waterfall
monthlySold comps — $/sqft
last 12 mo · ≤1 miLoading sold comps…