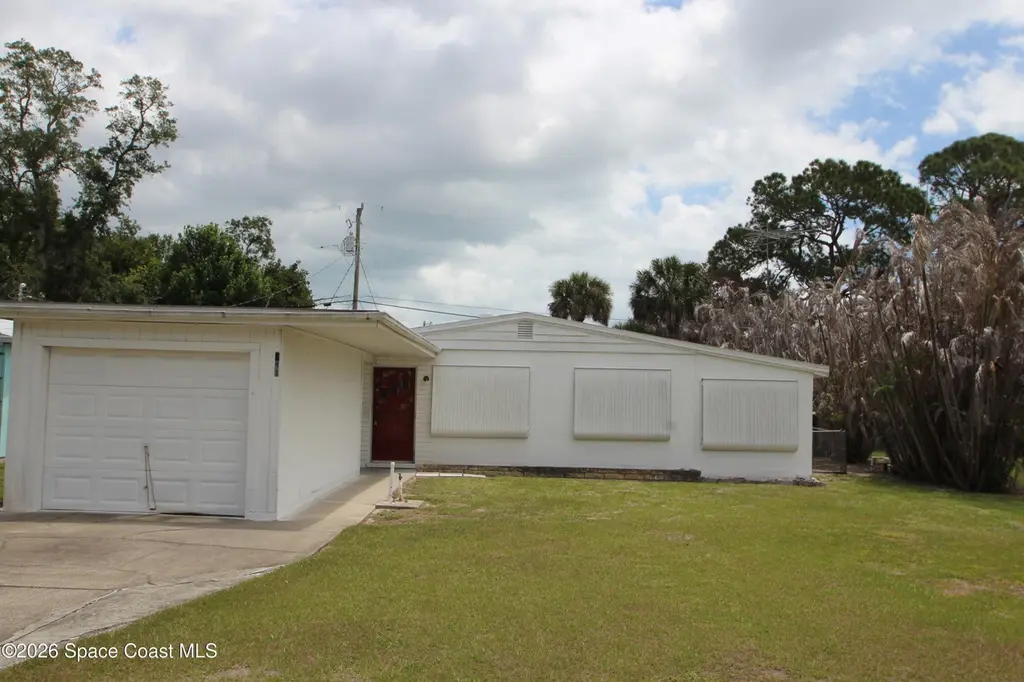
441 Bluff Dr · Melbourne, FL
Flood risk 1/10 · Minimal
- FEMA flood zone
- X (unshaded)
- Chance of flooding over 30 yrs
- 0.0%
- Est. flood insurance / yr
- $507 – $1,088
Fire risk 1/10 · Minimal
- Est. fire insurance / yr
- $947 – $1,759
Heat risk 10/10 · Severe
- Hot days now (above 105°F)
- 7 days/yr
- Hot days in 30 yrs
- 23 days/yr
Wind risk 10/10 · Severe
- Chance of severe wind over 30 yrs
- 99.0%
Air-quality risk 1/10 · Minimal
- Unhealthy air days now
- 0 days/yr
- Unhealthy air days in 30 yrs
- 0 days/yr
Risk factors via First Street. Map © Google.
Why this score? — see what drove the C grade
The composite is a weighted blend of 9 inputs, each scored 0–100. Each bar is that input's sub-score; the figure is the points it added to the 100-point composite (weight × sub-score).
- Cash flow +22.9/30.0
- ARV discount +7.5/15.0
- DSCR +7.4/10.0
- 1% rule +6.0/10.0
- Schools +4.7/10.0
- Rent growth +2.9/5.0
- Livability +2.5/5.0
- Condition / age +2.5/5.0
- Appreciation +0.0/10.0
$170,000
🖨 Deal sheet (PDF) 📄 Offer letter ✓ Due diligence
Listing remarks
Convenient location in Melbourne. Lots of potential with this 3 Bedroom, 1 1/2 Bath Concrete Block Home with 1 Car Attached Garage plus Huge Detached Garage with/Electric. Indoor Laundry, Covered Porch, Shed, & Fenced Yard. Roof 2018, A/C 2021. Needs TLC
Key facts
- Covered porch
- Fenced yard
- Indoor laundry
Tags
Property features AI
Finance
- Other: Paved road access; Back yard chain link fence; Covered rear porch and patio; Pets allowed
Exterior
- Parking: Attached garage; Detached garage; Garage (1 space)
- Utilities: Public sewer; Water connected; Sewer connected; Electricity connected; Cable available
- Home design: Single-family home; One story; Faces west
- Construction: Block and concrete construction; Shingle roof
- Exterior features: Storm shutters; Shed(s)
Interior
- Kitchen: Electric oven; Refrigerator
- Bedrooms: 3 bedrooms
- Flooring: Carpet; Tile
- Bathrooms: 2 bathrooms (1 full, 1 half)
- Heating & cooling: Electric heating; Central electric air conditioning
- Interior features: Primary bedroom on the ground floor
- Laundry & utility: Washer hookup; Electric dryer hookup
Neighborhood map
What this means for you Summary
Snapshot
- This is a 3-bed/2.0-bath single-family listed at $170k.
Deal economics
- At list price, monthly cash flow is $299 ($4k/yr) — positive.
- The deal already cash-flows at list — no discount required.
- Meets the 1% rule at list price ($2k rent vs $170k).
Location & tenants
- Location reads: area grade C — affects rentability + tenant quality, not the cash-flow math above.
- Brevard (suburban): math 53% / reading 57% proficiency, ranked #19 of 73 in FL (top 26%) — acceptable for families but not a draw, mixed tenant base, ~2y average lease.
- Zoned schools: Harbor City Elementary School (math 57% / reading 47%, grade C-, #990 of 2,144 statewide, top 48%, 403 students, 70% FRL); Herbert C. Hoover Middle School (math 67% / reading 64%, grade A-, #95 of 571 statewide, top 17%, 506 students, 38% FRL); Melbourne Senior High School (math 43% / reading 57%, grade D+, #175 of 667 statewide, top 27%, 2,249 students, 31% FRL) — zoned schools at 46% FRL track the district average.
- Market conditions: Rents rising (+1.7%/yr); 201 active listings in the ZIP; 10 comparable units currently listed for rent nearby; rentals at typical pace (median 25d on market — plan ~3-4 weeks tenant-placement turnaround); 4,602 units permitted in Brevard County in 2024 (702 in 5+ unit buildings).
- This rent runs 41% of the median local income ($55k/yr) — at the standard rent-burdened threshold; future hikes will face affordability resistance.
Forward outlook
- Local home prices are declining (-3.0%/yr); year-one equity from $1k of loan paydown is wiped out by about $5k of value loss. Plan a longer hold.
- Brevard County population projected at +15% by 2050 — modest demand growth; plan on rents tracking national, not racing it.
Negotiation context
- Only 6 days on market — expect competitive offers; lowballing is unlikely to land.
- Current owner paid $46k; list at $170k implies a 270% gain — meaningful room to come down on a strong offer.
Risks & watch-outs
- Watch-outs: built in 1956 — expect roof / HVAC / electrical / plumbing capex.
- Climate carrying-cost: severe wind risk, 99% chance of damaging wind over 30y; extreme-heat days projected 7→23/yr by 2055 (HVAC capex compounding) — expect insurance premiums to compound above CPI over the hold.
Questions for the listing agent
- Built in 1956 — when were the roof, HVAC, electrical panel, plumbing, and water heater last replaced?
- Is there a deadline driving the sale (1031 exchange, divorce, estate, relocation)? That informs how much negotiation room exists.
- What's the average days-on-market for RENTAL listings here right now (not sales)? A rising rental-DOM trend means longer vacancies and softer asking-rent achievability than the comps imply.
- What's the recent tenant-quality profile in this submarket — average credit score on applications, eviction rate, late-payment / NSF rate, and stable-employment percentage? A property-management company in the area should have these aggregated.
- How much new for-sale + rental construction is in the pipeline within 1–3 miles? Heavy new supply typically softens prices + rents 12–24 months out; constrained supply supports both.
Investment metrics
- 1% rule
- 1.10% ✓
- Cap rate
- 8.40%
- Cash-on-cash
- 7.53%
- DSCR
- 1.34
- GRM
- 7.6
CMA / ARV
No comps found within radius.
Projected returns pro-forma
-3.0% appreciation · 1.7% rent growth · sell at horizon
- IRR
- -6.3%
- Equity multiple
- 0.77×
- Total profit
- $-10,897
- Equity at exit
- $25,348
- IRR
- 1.7%
- Equity multiple
- 1.12×
- Total profit
- $5,501
- Equity at exit
- $14,698
Cash invested: $47,600 (down + closing). Projections, not guarantees.
Landlord ↔ Tenant lean methodology
- Overall (STATE)
- 87 Strongly Landlord-Friendly
- State Florida
- 87 Strongly Landlord-Friendly · R+3
- County
- — inherits STATE
- City
- — inherits STATE
ZIP-level market 32901
- Home prices YoY
- -31.0%
- Rents YoY
- 1.7%
- Active inventory
- 201
- Price-to-rent
- 7.6×
Monthly cashflow live
- Estimated rent
- $1,865 high interval (Pro) →
- Mortgage (P&I)
- −$891
- Tax est. 1.5%
- −$212 /mo · $2,550/yr
- Insurance
- −$71
- HOA
- −$0
- Vacancy / Maint / Mgmt
- −$392
- Net cashflow
- $299
Break-even live
Sensitivity live
| Price | -10% $416 | -5% $358 | +0% $299 | +5% $240 | +10% $181 |
|---|---|---|---|---|---|
| Rent | -10% $151 | -5% $225 | +0% $299 | +5% $372 | +10% $446 |
| Rate | -1.0pp $384 | -0.5pp $342 | base $299 | +0.5pp $255 | +1.0pp $210 |
UW: 25.0% down · 7.5% · 30yr · 1.5% tax · 5.0% vac · 8.0% maint · 8.0% mgmt
Financing live
Cash to close
- Down payment
- $42,500
- Closing costs
- $5,100
- Reserves months
- —
- Total cash needed
- —
Loan-product check · same deal, 3 products live
Conventional
25% down · 7.5% · 30yr
- Down + closing
- —
- Monthly P&I
- —
- Monthly cashflow
- —
- DSCR
- —
- Eligible?
- —
Personal DTI + credit; lowest rate.
DSCR
20% down · 8.5% · 30yr
- Down + closing
- —
- Monthly P&I
- —
- Monthly cashflow
- —
- DSCR
- —
- Eligible?
- —
No personal income docs; deal must DSCR.
Hard money
10% down · 12.0% · 12mo
- Down + closing
- —
- Monthly P&I
- —
- Monthly cashflow
- —
- DSCR
- —
- Eligible?
- —
Short-term bridge; refi at stabilization.
Rent comps 10 comps
| Address | Beds | Baths | Sqft | Rent | $/sqft | DOM | Units | Dist |
|---|---|---|---|---|---|---|---|---|
| 600 Hickory St Melbourne, FL | 2.0 | 1.0 | 912 | $1,695 | $1.86 | 22d | 1 | 0.20mi |
| 108 E Avenue D Melbourne, FL | 2.0 | 2.0 | 1087 | $1,800 | $1.66 | 25d | 1 | 0.27mi |
| 20 East Avenue B Apt 1 Melbourne, FL | 2.0 | 1.0 | 900 | $1,200 | $1.33 | 25d | 1 | 0.44mi |
| 1023 Gull Ln Melbourne, FL | 1.0–3.0 | 1.0–2.0 | 1072 | $2,249 | $2.10 | 16d | 31 | 0.69mi |
| 20 Elton St Unit 20C Melbourne, FL | 2.0 | 1.0 | 744 | $1,100 | $1.48 | 25d | 1 | 0.77mi |
| 484 Poinciana Dr Melbourne, FL | 2.0 | 1.0 | 780 | $1,600 | $2.05 | 20d | 1 | 1.15mi |
| 208 Seminole Ave W Unit 1 Melbourne, FL | 2.0 | 1.0 | 966 | $2,900 | $3.00 | 25d | 1 | 1.32mi |
| 533 E Lincoln Ave Melbourne, FL | 2.0 | 1.0 | 796 | $1,800 | $2.26 | 25d | 1 | 1.42mi |
| 512 E Strawbridge Ave Melbourne, FL | 3.0 | 1.0 | 1487 | $2,400 | $1.61 | 22d | 1 | 1.48mi |
| 1810 Elizabeth St Melbourne, FL | 4.0 | 2.0 | 900 | $3,997 | $4.44 | 25d | 1 | 1.49mi |
Listing history 3 events
-
2026-05-13status Pending
-
2026-05-07$170,000 Active
-
1986-10-01soldstatus $45,900
ⓘ Source: listings_history table (triggers on properties + properties_extension) + one-shot
backfill from property_details.listing_events for pre-trigger history.
Climate risk First Street
- Flood 1/10 Low FEMA zone X (unshaded) · 0% chance over 30 yrs
- Wildfire 1/10 Low
- Heat 10/10 Extreme 7 d/yr ≥105°F today · 23 d/yr by 30 yrs out
- Wind 10/10 Extreme 99% chance of damaging wind over 30 yrs
- Air quality 1/10 Low 0 unhealthy d/yr today · 0 by 30 yrs out
Nearby sold comps map
Loading sold comps map…
Walkable amenities ~0.75 mi
Loading nearby amenities…
Taxation est. · year 1
- Rental income
- $22,384
- − Mortgage interest
- −$9,523
- − Property taxes
- −$2,550
- − Insurance
- −$850
- − Repairs & maintenance
- −$1,791
- − Management
- −$1,791
- − Depreciation
- −$4,945
- Taxable income
- $935
- Est. tax owed @ 24.0%
- −$224
- After-tax cash flow
- $3,361/yr
For passive investors: Depreciation is non-cash, so a rental often shows a tax loss while cash-flowing — sheltering income. Rental losses are passive: they offset passive income freely, and up to $25,000/yr can offset ordinary (W-2) income if you actively participate and your MAGI is under $100k (phasing out to $0 by $150k); unused losses carry forward. On sale, claimed depreciation is recaptured at up to 25%, and gains may owe capital-gains tax (a 1031 exchange can defer both). Figures are a year-1 estimate at your 24.0% rate — not tax advice; consult a CPA.
Schools (NCES district)
- District
- Brevard
- NCES district ID
- 1200150
- Math proficiency
- 53% ▼ -9.00%
- Reading proficiency
- 57% ▼ -4.00%
- Median HH income
- $49,426
- Composite
- 46.86/100
- National rank
- #2370
- State rank
- #19 of 73 in FL
Livability — Melbourne
No livability data for this city. (Only ~50 U.S. cities are tracked.)
Census & demographics
- Census place
- Melbourne, FL
- County
- Brevard County · 602,871 people
- City population
- 178,420
- Metro
- Palm Bay-Melbourne-Titusville, FL
- Population (ZIP)
- 28,923
- Household income
- $54,651
- Rent vs Own
- Severe rent burden
- 2018.0
Population outlook (Brevard County) Hauer SSP2
- Today (2025)
- 623,254 people
- By 2030
- 648,420 · +4.0%
- By 2040
- 690,009 · +10.7%
- By 2050
- 715,669 · +14.8%
- By 2075
- 775,744 · +24.5%
- By 2100
- 776,687 · +24.6%
Race, ethnicity, and origin ACS 2023
- Neighborhood character
- Diverse neighborhood (Simpson 0.56)
- Race & ethnicity
- White 62% Black 18% Hispanic / Latino 11% Two or more races 8% Asian 4%
- Hispanic origin (detail)
- Mexican 2% Puerto Rican 4%
- Common ancestry
- Romanian 4% Lithuanian 3% Slovak 1%
- Foreign-born
- 14% · Canada, Vietnam, Jamaica
- Languages at home
- 85% English-only · Spanish 7% Other Indo-European 2% Vietnamese 2%
Political lean MEDSL · Brevard
- 2024 margin
- Strong R (+20.8) · D 39.1% · R 59.9% · Other 1.0%
- 2008→2024 swing
- -10.4pp toward R · 2008: -10.4pp · 2024: -20.8pp
- All cycles
- 2024: R+20.8 2020: R+16.4 2016: R+19.8 2012: R+12.7 2008: R+10.4
Not yet ingested
- Civics
- —
Market trends
- HPI YoY
- ▼ -145.13%
- Current HPI
- 322.934
- Rent YoY
- ▲ 1.70%
- Metro
- Palm Bay-Melbourne-Titusville, FL
- State GDP YoY
- ▲ 3.28%
- F500 in state
- 36
Industry mix (Fortune 500 HQ in FL)
| Industry | F500 HQs | Revenue |
|---|---|---|
| Industrial Technology | 2 | $29B |
|
||
| Insurance | 2 | $17B |
|
||
| Retail | 1 | $60B |
|
||
| Technology Distribution | 1 | $58B |
|
||
| Homebuilding | 1 | $35B |
|
||
| Technology Manufacturing | 1 | $35B |
|
||
Price history
+270.4% since first listed3 events — show timeline
- 2026-05-13 Pending — SCMLS
- 2026-05-07 Listed $170,000 SCMLS
- 1986-10-01 Sold (Public Records) $45,900 Public Records
Property tax history
-2.0%/yrLatest (2025): $258 · -8.8% YoY. Source: county tax records.
Cash-flow waterfall
monthlySold comps — $/sqft
last 12 mo · ≤1 miLoading sold comps…