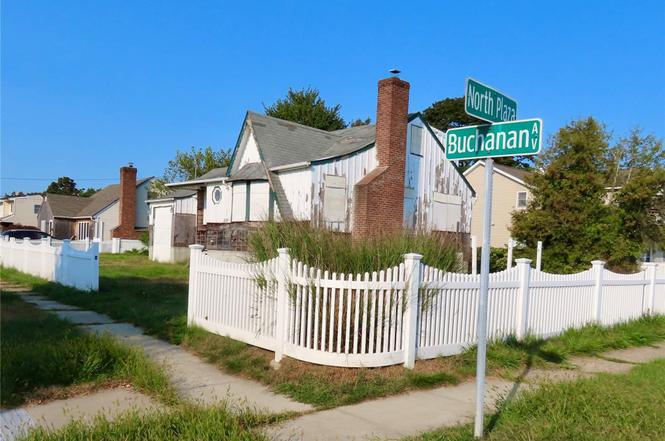
44 Buchanan Ave · Copiague, NY
Flood risk No data
- FEMA flood zone
- —
- Chance of flooding over 30 yrs
- —
- Est. flood insurance / yr
- —
Fire risk No data
- Est. fire insurance / yr
- —
Heat risk No data
- Hot days now (above threshold)
- —
- Hot days in 30 yrs
- —
Wind risk No data
- Chance of severe wind over 30 yrs
- —
Air-quality risk No data
- Unhealthy air days now
- —
- Unhealthy air days in 30 yrs
- —
Risk factors via First Street. Map © Google.
Why this score? — see what drove the B- grade
The composite is a weighted blend of 9 inputs, each scored 0–100. Each bar is that input's sub-score; the figure is the points it added to the 100-point composite (weight × sub-score).
- Cash flow +23.7/30.0
- ARV discount +15.0/15.0
- DSCR +7.6/10.0
- 1% rule +7.2/10.0
- Schools +3.5/10.0
- Livability +3.4/5.0
- Rent growth +2.5/5.0
- Condition / age +2.5/5.0
- Appreciation +0.0/10.0
$350,000
🖨 Deal sheet (PDF) 📄 Offer letter ✓ Due diligence
Listing remarks MLS
House Need To Be Lifted, Lot Of Potencial, Sold As Is With Not Warranties And Representation By Seller. No Miss This Opprtunity To Create Your Own Dream Home., Additional information: Appearance:Mint,Separate Hotwater Heater:Yes
Key facts
- Waterfront dream
- Perfectly located
- 8,400 sq ft lot
Tags
Neighborhood map
What this means for you Summary
Snapshot
- This is a 5-bed/1.0-bath single-family listed at $350k.
Deal economics
- At list price, monthly cash flow is $664 ($8k/yr) — positive.
- The deal already cash-flows at list — no discount required.
- Meets the 1% rule at list price ($4k rent vs $350k).
- Recommended offer: $329k (6.0% below list) — sets the bar for market timing.
- Cap rate 8.6% vs local median 2.8% in Copiague — top-decile yield for the area; either an underpriced asset or a hidden risk that comps aren't pricing in. Stress-test before assuming the spread holds.
Location & tenants
- Location reads 67/100 on livability (#611 in NY) — a middle-class / working-renter tenant base. Strengths: employment A+, housing A+, commute B; Watch: crime C-, amenities F, cost of living F.
- Copiague Union Free School District (suburban): math 38% / reading 39% proficiency, ranked #506 of 590 in NY (top 86%) — families likely to look elsewhere, expect single-tenant / working-renter base with shorter leases.
- Zoned schools: Copiague Middle School (math 13% / reading 38%, grade F, #597 of 729 statewide, top 82%, 1,061 students, 55% FRL); Walter G O'Connell Copiague High School (math 87% / reading 95%, grade A+, #203 of 1,100 statewide, top 20%, 1,524 students, 54% FRL) — zoned schools at 55% FRL track the district average.
- Zoned-school proficiency averages 58% at this address vs 38% district-wide (+20 pts) — the actual schools serving this property are materially stronger than the Copiague Union Free School District average implies; a family-tenant draw the district grade alone would hide.
- Market conditions: 123 active listings in the ZIP; 1 comparable units currently listed for rent nearby; high-income renter base; 1,366 units permitted in Suffolk County in 2024 (216 in 5+ unit buildings).
- This rent runs 44% of the median local income ($117k/yr) — at the standard rent-burdened threshold; future hikes will face affordability resistance.
Forward outlook
- Local home prices are declining (-3.0%/yr); year-one equity from $2k of loan paydown is wiped out by about $10k of value loss. Plan a longer hold.
- Suffolk County population projected to shrink 5% by 2050 — rents likely to lag national; underwrite the cash flow, not the appreciation.
Negotiation context
- It's been on market 61 days — a 6% lower offer ($329k) is reasonable based on typical stale-listing flexibility.
- 9 sale attempts since 13y ago; this cycle's ask has dropped $250k (42%) from the opening price — seller is motivated, your offer sets the floor, not the list.
- Current owner paid $200k; list at $350k implies a 75% gain — meaningful room to come down on a strong offer.
Risks & watch-outs
- Watch-outs: built in 1938 — expect roof / HVAC / electrical / plumbing capex.
Questions for the listing agent
- It's been on market 61 days. Have you received any prior offers? Is the seller open to a 6% concession, seller financing, or rate buy-down credit?
- Built in 1938 — when were the roof, HVAC, electrical panel, plumbing, and water heater last replaced?
- Why hasn't it sold? Are there any deal-killer items the seller is aware of (foundation, flood, title, zoning, code violations)?
- Is there a deadline driving the sale (1031 exchange, divorce, estate, relocation)? That informs how much negotiation room exists.
- What's the average days-on-market for RENTAL listings here right now (not sales)? A rising rental-DOM trend means longer vacancies and softer asking-rent achievability than the comps imply.
- What's the recent tenant-quality profile in this submarket — average credit score on applications, eviction rate, late-payment / NSF rate, and stable-employment percentage? A property-management company in the area should have these aggregated.
- How much new for-sale + rental construction is in the pipeline within 1–3 miles? Heavy new supply typically softens prices + rents 12–24 months out; constrained supply supports both.
Investment metrics
- 1% rule
- 1.22% ✓
- Cap rate
- 8.57%
- Cash-on-cash
- 8.13%
- DSCR
- 1.36
- GRM
- 6.8
CMA / ARV
- ARV (on-the-fly)
- $602,076
- Comps found
- 11
Show comp detail 11 sales within ~0.75 mi
| Address | Dist | Beds/Ba | Sqft | Sold | Price | $/sf | Match |
|---|---|---|---|---|---|---|---|
| 55 Dawes Ave | 0.07mi | 4/2.0 (-1) | 1,600 (+2%) | 22mo | $560,000 | $350 | 67 |
| 2 Perkins Ave | 0.46mi | 4/2.0 (-1) | 1,575 (+0%) | 8mo | $648,000 | $411 | 63 |
| 37 New Point Pl | 0.34mi | 4/2.0 (-1) | 1,656 (+5%) | 6mo | $635,000 | $383 | 61 |
| 65 S Bayview Ave | 0.44mi | 4/3.0 (-1) | 1,602 (+2%) | 14mo | $740,000 | $462 | 51 |
| 32 George Brown Plz | 0.15mi | 4/3.0 (-1) | 1,748 (+11%) | 14mo | $600,000 | $343 | 50 |
| 16 Guilette Pl | 0.42mi | 4/2.0 (-1) | 1,694 (+8%) | 12mo | $605,000 | $357 | 49 |
| 22 Manor Ln | 0.75mi | 4/2.0 (-1) | 1,607 (+2%) | 7mo | $650,000 | $404 | 47 |
| 255 Rose St | 0.63mi | 5/2.0 | 1,734 (+10%) | 8mo | $660,000 | $381 | 43 |
| 330 East Dr | 0.65mi | 4/2.0 (-1) | 1,697 (+8%) | 7mo | $560,000 | $330 | 41 |
| 149 Warwick Ave | 0.59mi | 4/2.0 (-1) | 1,788 (+14%) | 8mo | $827,500 | $463 | 33 |
| 4 Coles Ave | 0.73mi | 4/1.5 (-1) | 1,755 (+12%) | 11mo | $755,000 | $430 | 30 |
Match score weights: distance 35% · size 25% · config 20% · recency 20%. Top-matched comps best support the ARV.
Projected returns pro-forma
-3.0% appreciation · 3.0% rent growth · sell at horizon
- IRR
- -3.9%
- Equity multiple
- 0.86×
- Total profit
- $-14,162
- Equity at exit
- $52,186
- IRR
- 5.9%
- Equity multiple
- 1.44×
- Total profit
- $43,137
- Equity at exit
- $30,262
Cash invested: $98,000 (down + closing). Projections, not guarantees.
Landlord ↔ Tenant lean methodology
- Overall (STATE)
- 15 Strongly Tenant-Friendly
- State New York
- 15 Strongly Tenant-Friendly · D+10
- County
- — inherits STATE
- City
- — inherits STATE
ZIP-level market 11701
- Active inventory
- 123
- Price-to-rent
- 6.8×
Monthly cashflow live
- Estimated rent
- $4,271 medium interval (Pro) →
- Mortgage (P&I)
- −$1,835
- Tax from tax record
- −$729 /mo · $8,746/yr
- Insurance
- −$146
- HOA
- −$0
- Vacancy / Maint / Mgmt
- −$897
- Net cashflow
- $664
Break-even live
Sensitivity live
| Price | -10% $862 | -5% $763 | +0% $664 | +5% $565 | +10% $466 |
|---|---|---|---|---|---|
| Rent | -10% $327 | -5% $496 | +0% $664 | +5% $833 | +10% $1,002 |
| Rate | -1.0pp $841 | -0.5pp $753 | base $664 | +0.5pp $574 | +1.0pp $481 |
UW: 25.0% down · 7.5% · 30yr · 1.5% tax · 5.0% vac · 8.0% maint · 8.0% mgmt
Financing live
Cash to close
- Down payment
- $87,500
- Closing costs
- $10,500
- Reserves months
- —
- Total cash needed
- —
Loan-product check · same deal, 3 products live
Conventional
25% down · 7.5% · 30yr
- Down + closing
- —
- Monthly P&I
- —
- Monthly cashflow
- —
- DSCR
- —
- Eligible?
- —
Personal DTI + credit; lowest rate.
DSCR
20% down · 8.5% · 30yr
- Down + closing
- —
- Monthly P&I
- —
- Monthly cashflow
- —
- DSCR
- —
- Eligible?
- —
No personal income docs; deal must DSCR.
Hard money
10% down · 12.0% · 12mo
- Down + closing
- —
- Monthly P&I
- —
- Monthly cashflow
- —
- DSCR
- —
- Eligible?
- —
Short-term bridge; refi at stabilization.
Rent comps 1 comps
| Address | Beds | Baths | Sqft | Rent | $/sqft | DOM | Units | Dist |
|---|---|---|---|---|---|---|---|---|
| 286 Beachview St Copiague, NY | 4.0 | 3.0 | 2000 | $5,500 | $2.75 | 44d | 1 | 0.85mi |
Listing history 25 events
-
2024-12-13status Pending
-
2024-11-23status Active
-
2024-11-13status Active
-
2024-11-01status Active
-
2024-10-28status Active
-
2024-10-24price $350,000
-
2024-10-02price $525,000
-
2024-09-13$599,999 Active
-
2017-10-26soldstatus $200,000
-
2017-09-29soldstatus $200,000 Closed 228-char remark
Show marketing remark (228 chars)
House Need To Be Lifted, Lot Of Potencial, Sold As Is With Not Warranties And Representation By Seller. No Miss This Opprtunity To Create Your Own Dream Home., Additional information: Appearance:Mint,Separate Hotwater Heater:Yes
-
2017-09-02status Under Contract 228-char remark
Show marketing remark (228 chars)
House Need To Be Lifted, Lot Of Potencial, Sold As Is With Not Warranties And Representation By Seller. No Miss This Opprtunity To Create Your Own Dream Home., Additional information: Appearance:Mint,Separate Hotwater Heater:Yes
-
2017-08-22$265,000 New 228-char remark
Show marketing remark (228 chars)
House Need To Be Lifted, Lot Of Potencial, Sold As Is With Not Warranties And Representation By Seller. No Miss This Opprtunity To Create Your Own Dream Home., Additional information: Appearance:Mint,Separate Hotwater Heater:Yes
-
2017-08-01historical
-
2017-01-27$265,000 New
-
2016-08-24soldstatus $153,700
-
2016-02-03soldstatus $425,000
-
2014-05-31historical
-
2014-04-10$275,000
-
2014-03-21historical
-
2013-03-21$210,000
-
2011-04-21soldstatus $422,500
-
2005-08-02soldstatus $515,000
-
2001-01-04soldstatus $250,000
-
1990-02-08soldstatus $147,000
-
1989-07-21soldstatus $154,000
ⓘ Source: listings_history table (triggers on properties + properties_extension) + one-shot
backfill from property_details.listing_events for pre-trigger history.
Tax reassessment forecast NY · Partial reset (capped growth)
- Current annual tax
- $8,746 · $729/mo
- Projected year-2 tax
- $8,746 · $729/mo
- Expected delta
- $0/yr ($0/mo · 0.0%)
ⓘ Screening estimate from a state-policy table — verify with the county assessor before closing.
Nearby sold comps map
Loading sold comps map…
Walkable amenities ~0.75 mi
Loading nearby amenities…
Taxation est. · year 1
- Rental income
- $51,257
- − Mortgage interest
- −$19,605
- − Property taxes
- −$8,746
- − Insurance
- −$1,750
- − Repairs & maintenance
- −$4,101
- − Management
- −$4,101
- − Depreciation
- −$10,182
- Taxable income
- $2,772
- Est. tax owed @ 24.0%
- −$665
- After-tax cash flow
- $7,306/yr
For passive investors: Depreciation is non-cash, so a rental often shows a tax loss while cash-flowing — sheltering income. Rental losses are passive: they offset passive income freely, and up to $25,000/yr can offset ordinary (W-2) income if you actively participate and your MAGI is under $100k (phasing out to $0 by $150k); unused losses carry forward. On sale, claimed depreciation is recaptured at up to 25%, and gains may owe capital-gains tax (a 1031 exchange can defer both). Figures are a year-1 estimate at your 24.0% rate — not tax advice; consult a CPA.
Schools (NCES district)
- District
- Copiague Union Free School District
- NCES district ID
- 3608310
- Math proficiency
- 38% ▼ -12.00%
- Reading proficiency
- 39% ▼ -9.00%
- Median HH income
- $69,215
- Composite
- 35.09/100
- National rank
- #5020
- State rank
- #506 of 590 in NY
Livability — Copiague
- Score
- 67/100
- State rank
- #611
- US rank
- #11032
Category grades
Schools grade is shown separately in the Schools card above.
Census & demographics
- Census place
- Copiague, NY
- County
- Suffolk County · 679,920 people
- City population
- 21,940
- Metro
- New York-Newark-Jersey City, NY-NJ-PA
- Population (ZIP)
- 29,509
- Household income
- $117,033
- Rent vs Own
- Severe rent burden
- 959.0
Population outlook (Suffolk County) Hauer SSP2
- Today (2025)
- 1,505,262 people
- By 2030
- 1,498,318 · -0.5%
- By 2040
- 1,471,101 · -2.3%
- By 2050
- 1,424,848 · -5.3%
- By 2075
- 1,337,157 · -11.2%
- By 2100
- 1,217,720 · -19.1%
Race, ethnicity, and origin ACS 2023
- Neighborhood character
- Highly diverse neighborhood (Simpson 0.70)
- Race & ethnicity
- White 37% Black 28% Hispanic / Latino 28% Two or more races 12% Asian 2%
- Hispanic origin (detail)
- Puerto Rican 2% Dominican 3%
- Common ancestry
- Hispanic 4% Romanian 2% Slovak 1%
- Foreign-born
- 24% · Canada, Jamaica, China
- Languages at home
- 71% English-only · Spanish 20% French/Haitian/Cajun 3% Other Indo-European 3%
Political lean MEDSL · Suffolk
- 2024 margin
- Lean R (+10.0) · D 45.0% · R 55.0%
- 2008→2024 swing
- -16.0pp toward R · 2008: 6.0pp · 2024: -10.0pp
- All cycles
- 2024: R+10.0 2020: R+0.0 2016: R+8.2 2012: D+2.9 2008: D+6.0
Not yet ingested
- Civics
- —
Market trends
- HPI YoY
- ▼ -345.15%
- Current HPI
- 306.4465
- Rent YoY
- —
- Metro
- New York-Newark-Jersey City, NY-NJ-PA
- State GDP YoY
- ▲ 2.60%
- F500 in state
- 92
Industry mix (Fortune 500 HQ in NY)
| Industry | F500 HQs | Revenue |
|---|---|---|
| Financial Services | 10 | $950B |
|
||
| Consumer Goods | 9 | $162B |
|
||
| Insurance | 4 | $225B |
|
||
| Telecommunications | 2 | $144B |
|
||
| Pharmaceuticals | 2 | $112B |
|
||
| Media / Entertainment | 2 | $69B |
|
||
Price history
+127.3% since first listed25 events — show timeline
- 2024-12-13 Pending — OneKey® MLS as Distributed by MLS Grid
- 2024-11-23 Relisted — OneKey® MLS as Distributed by MLS Grid
- 2024-11-13 Relisted — OneKey® MLS as Distributed by MLS Grid
- 2024-11-01 Relisted — OneKey® MLS as Distributed by MLS Grid
- 2024-10-28 Relisted — OneKey® MLS as Distributed by MLS Grid
- 2024-10-24 Price Changed $350,000 OneKey® MLS as Distributed by MLS Grid
- 2024-10-02 Price Changed $525,000 OneKey® MLS as Distributed by MLS Grid
- 2024-09-13 Listed $599,999 OneKey® MLS as Distributed by MLS Grid
- 2017-10-26 Sold (Public Records) $200,000 Public Records
- 2017-09-29 Sold (MLS) $200,000 OneKey® MLS as Distributed by MLS Grid
- 2017-09-02 Pending — OneKey® MLS as Distributed by MLS Grid
- 2017-08-22 Listed $265,000 OneKey® MLS as Distributed by MLS Grid
- 2017-08-01 Listing Removed — OneKey® MLS as Distributed by MLS Grid
- 2017-01-27 Listed $265,000 OneKey® MLS as Distributed by MLS Grid
- 2016-08-24 Sold (Public Records) $153,700 Public Records
- 2016-02-03 Sold (Public Records) $425,000 Public Records
- 2014-05-31 Listing Removed — OneKey® MLS as Distributed by MLS Grid
- 2014-04-10 Listed $275,000 OneKey® MLS as Distributed by MLS Grid
- 2014-03-21 Listing Removed — OneKey® MLS as Distributed by MLS Grid
- 2013-03-21 Listed $210,000 OneKey® MLS as Distributed by MLS Grid
- 2011-04-21 Sold (Public Records) $422,500 Public Records
- 2005-08-02 Sold (Public Records) $515,000 Public Records
- 2001-01-04 Sold (Public Records) $250,000 Public Records
- 1990-02-08 Sold (Public Records) $147,000 Public Records
- 1989-07-21 Sold (Public Records) $154,000 Public Records
Property tax history
-0.6%/yrLatest (2025): $8,746 · +0.0% YoY. Source: county tax records.
Cash-flow waterfall
monthlySold comps — $/sqft
last 12 mo · ≤1 miLoading sold comps…