342 N Sioux Rd · Sand Springs, OK
Flood risk 1/10 · Minimal
- FEMA flood zone
- X (unshaded)
- Chance of flooding over 30 yrs
- 0.0%
- Est. flood insurance / yr
- $507 – $1,088
Fire risk 8/10 · Major
- Est. fire insurance / yr
- $2,463 – $4,575
Heat risk 5/10 · Moderate
- Hot days now (above 111°F)
- 7 days/yr
- Hot days in 30 yrs
- 17 days/yr
Wind risk 2/10 · Minimal
- Chance of severe wind over 30 yrs
- 4.0%
Air-quality risk 3/10 · Minor
- Unhealthy air days now
- 2 days/yr
- Unhealthy air days in 30 yrs
- 3 days/yr
Risk factors via First Street. Map © Google.
Why this score? — see what drove the B- grade
The composite is a weighted blend of 9 inputs, each scored 0–100. Each bar is that input's sub-score; the figure is the points it added to the 100-point composite (weight × sub-score).
- Cash flow +30.0/30.0
- 1% rule +10.0/10.0
- DSCR +10.0/10.0
- ARV discount +7.5/15.0
- Schools +3.7/10.0
- Livability +3.5/5.0
- Rent growth +2.8/5.0
- Condition / age +2.5/5.0
- Appreciation +0.0/10.0
$70,000
🖨 Deal sheet (PDF) 📄 Offer letter ✓ Due diligence
Listing remarks
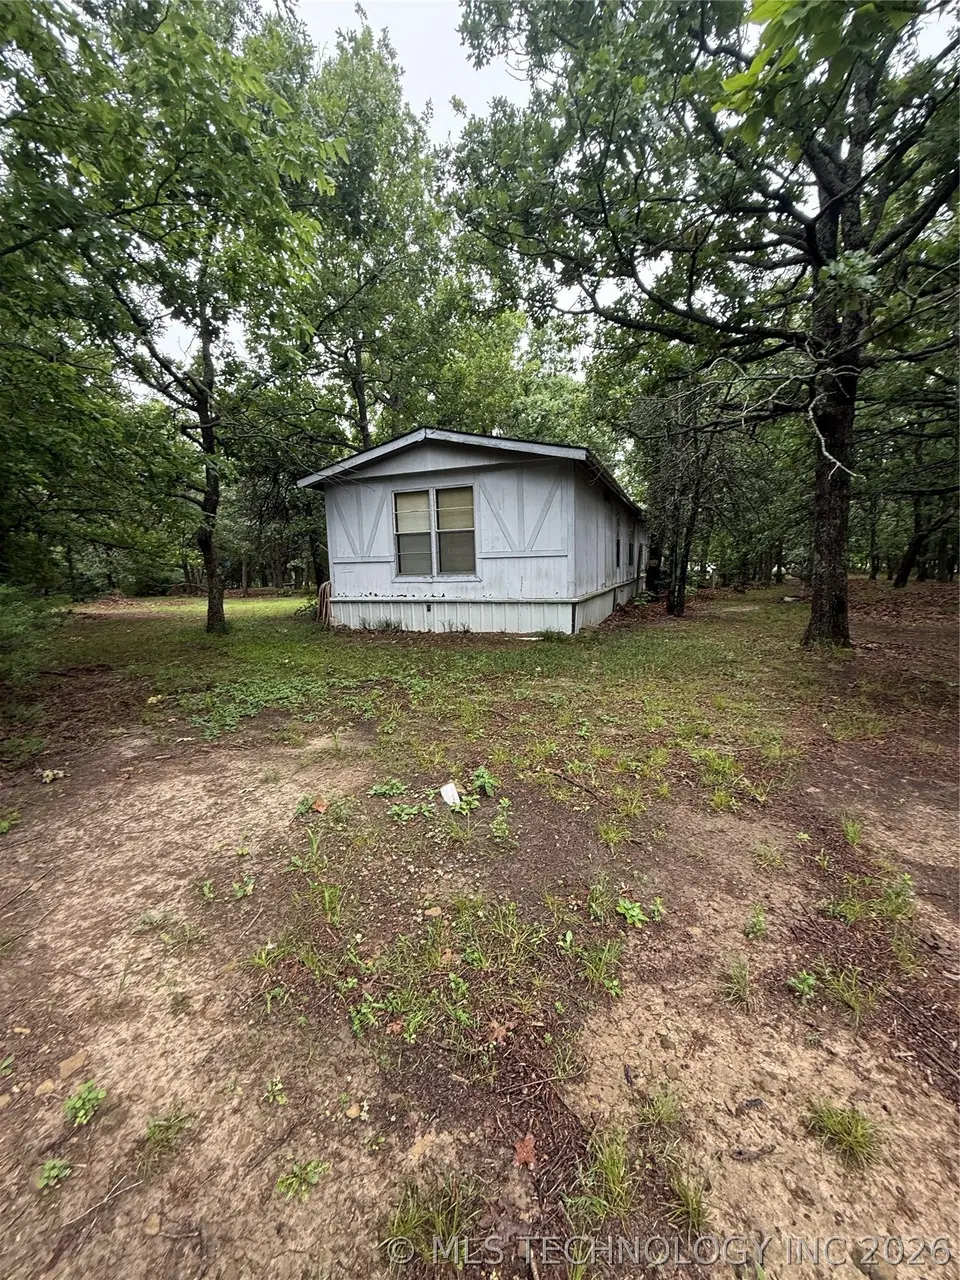
Great opportunity for 4 wooded acres close to Prue, the lake, Sand Springs and only 35 minutes to Downtown Tulsa. Come build your homestead! Electric and Septic available. Manufactured home had roof replaced a few years ago but is still needing work. No warranties or guarantees, come with your tool belt! Great opportunity for homesteading, below 100k housing and low Osage County taxes! Don't miss out on this opportunity! Cash only, Buyer to verify all information and due diligence. Pricing reflects land value & utilities have been turned off.
Key facts
- Close to the lake
- Wooded acres
- Septic available
Tags
Property features AI
Exterior
- Parking: No parking information provided
- Security: No safety shelter
- Utilities: Electricity available; Public water; Septic tank
- Home design: Single-wide manufactured home; One story; Faces west
- Construction: Aluminum siding; Asphalt/fiberglass roof
- Exterior features: Partial fencing; Corner lot; No other exterior features listed; Less than 5 miles to water (Keystone Lake nearby)
Interior
- Kitchen: Oven; Range; Stove
- Bedrooms: Master bedroom (first floor); Additional bedroom (first floor); Additional bedroom (first floor)
- Flooring: Carpet; Vinyl
- Bathrooms: Master bath (first floor); Hall bath (first floor); Total of 2 full bathrooms
- Heating & cooling: Central heating; Electric heating; Gas heating
- Interior features: Aluminum-framed windows; Laminate counters; No additional interior features listed
- Laundry & utility: Gas water heater
Neighborhood map
What this means for you Summary
Snapshot
- This is a 3-bed/2.0-bath manufactured listed at $70k.
Deal economics
- At list price, monthly cash flow is $607 ($7k/yr) — positive.
- The deal already cash-flows at list — no discount required.
- Meets the 1% rule at list price ($1k rent vs $70k).
- Cap rate 16.7% vs local median 1.0% in Sand Springs — top-decile yield for the area; either an underpriced asset or a hidden risk that comps aren't pricing in. Stress-test before assuming the spread holds.
Location & tenants
- Location reads 69/100 on livability (#54 in OK) — a middle-class / working-renter tenant base. Strengths: cost of living A+, housing A+; Watch: crime C-, commute D+, amenities F.
- Prue (rural): math 45% / reading 35% proficiency, ranked #102 of 513 in OK (top 20%) — families likely to look elsewhere, expect single-tenant / working-renter base with shorter leases; 78% free/reduced lunch — lower-income household profile, screen leases tightly.
- Zoned schools: Prue Es (math 37% / reading 22%, grade F, #255 of 845 statewide, top 35%, 211 students, 0% FRL); Prue Hs (math 10% / reading 30%, grade F, #236 of 447 statewide, top 61%, 86 students, 0% FRL) — zoned schools average 0% FRL vs 78% district-wide (78 pts lower); this property's tenant base skews higher-income than the district average.
- Zoned-school proficiency averages 25% at this address vs 40% district-wide (-15 pts) — the specific schools serving this property underperform the Prue average; the district grade overstates school quality for this exact location.
- Market conditions: Rents rising (+1.1%/yr); 94 active listings in the ZIP; 89 units permitted in Osage County in 2024 (0 in 5+ unit buildings).
Forward outlook
- Local home prices are declining (-3.0%/yr); year-one equity from $484 of loan paydown is wiped out by about $2k of value loss. Plan a longer hold.
- Osage County population projected to shrink 6% by 2050 — rents likely to lag national; underwrite the cash flow, not the appreciation.
- At projected returns (-3.0% appreciation + 1.1% rent growth), your $20k cash investment doubles in ~4 years — after that, you're playing with house money.
Negotiation context
- Only 12 days on market — expect competitive offers; lowballing is unlikely to land.
Risks & watch-outs
- Climate carrying-cost: severe wildfire risk; extreme-heat days projected 7→17/yr by 2055 (HVAC capex compounding) — expect insurance premiums to compound above CPI over the hold.
Questions for the listing agent
- Is there a deadline driving the sale (1031 exchange, divorce, estate, relocation)? That informs how much negotiation room exists.
- Schools are F-rated, which usually means shorter tenancies and higher turnover. Who's the typical renter profile here, and what's been the actual vacancy rate?
- What's the average days-on-market for RENTAL listings here right now (not sales)? A rising rental-DOM trend means longer vacancies and softer asking-rent achievability than the comps imply.
- What's the recent tenant-quality profile in this submarket — average credit score on applications, eviction rate, late-payment / NSF rate, and stable-employment percentage? A property-management company in the area should have these aggregated.
- How much new for-sale + rental construction is in the pipeline within 1–3 miles? Heavy new supply typically softens prices + rents 12–24 months out; constrained supply supports both.
Investment metrics
- 1% rule
- 1.88% ✓
- Cap rate
- 16.71%
- Cash-on-cash
- 37.19%
- DSCR
- 2.65
- GRM
- 4.4
CMA / ARV
No comps found within radius.
Projected returns pro-forma
-3.0% appreciation · 1.11% rent growth · sell at horizon
- IRR
- 31.0%
- Equity multiple
- 2.27×
- Total profit
- $24,881
- Equity at exit
- $10,437
- IRR
- 37.2%
- Equity multiple
- 4.15×
- Total profit
- $61,744
- Equity at exit
- $6,052
Cash invested: $19,600 (down + closing). Projections, not guarantees.
Landlord ↔ Tenant lean methodology
- Overall (STATE)
- 83 Strongly Landlord-Friendly
- State Oklahoma
- 83 Strongly Landlord-Friendly · R+20
- County
- — inherits STATE
- City
- — inherits STATE
ZIP-level market 74063
- Rents YoY
- 1.1%
- Active inventory
- 94
- Price-to-rent
- 4.4×
Monthly cashflow live
- Estimated rent
- $1,314 medium interval (Pro) →
- Mortgage (P&I)
- −$367
- Tax from tax record
- −$34 /mo · $409/yr
- Insurance
- −$29
- HOA
- −$0
- Vacancy / Maint / Mgmt
- −$276
- Net cashflow
- $607
Break-even live
Sensitivity live
| Price | -10% $647 | -5% $627 | +0% $607 | +5% $588 | +10% $568 |
|---|---|---|---|---|---|
| Rent | -10% $504 | -5% $556 | +0% $607 | +5% $659 | +10% $711 |
| Rate | -1.0pp $643 | -0.5pp $625 | base $607 | +0.5pp $589 | +1.0pp $571 |
UW: 25.0% down · 7.5% · 30yr · 1.5% tax · 5.0% vac · 8.0% maint · 8.0% mgmt
Financing live
Cash to close
- Down payment
- $17,500
- Closing costs
- $2,100
- Reserves months
- —
- Total cash needed
- —
Loan-product check · same deal, 3 products live
Conventional
25% down · 7.5% · 30yr
- Down + closing
- —
- Monthly P&I
- —
- Monthly cashflow
- —
- DSCR
- —
- Eligible?
- —
Personal DTI + credit; lowest rate.
DSCR
20% down · 8.5% · 30yr
- Down + closing
- —
- Monthly P&I
- —
- Monthly cashflow
- —
- DSCR
- —
- Eligible?
- —
No personal income docs; deal must DSCR.
Hard money
10% down · 12.0% · 12mo
- Down + closing
- —
- Monthly P&I
- —
- Monthly cashflow
- —
- DSCR
- —
- Eligible?
- —
Short-term bridge; refi at stabilization.
Listing history 7 events
-
2026-06-07status $70,000 Pending 12 DOM
-
2026-06-03days on market $70,000 Active 12 DOM
-
2026-06-02remarks 550-char remark
-
2026-06-02days on market $70,000 Active 11 DOM
-
2026-06-01days on market $70,000 Active 10 DOM
-
2026-05-31days on market $70,000 Active 9 DOM
-
2026-05-22$70,000 Active
ⓘ Source: listings_history table (triggers on properties + properties_extension) + one-shot
backfill from property_details.listing_events for pre-trigger history.
Tax reassessment forecast OK · Resets to sale price
- Current annual tax
- $409 · $34/mo
- Projected year-2 tax
- $630 · $52/mo
- Expected delta
- +$221/yr (+$18/mo · 54.0%)
ⓘ Screening estimate from a state-policy table — verify with the county assessor before closing.
Climate risk First Street
- Flood 1/10 Low FEMA zone X (unshaded) · 0% chance over 30 yrs
- Wildfire 8/10 Severe
- Heat 5/10 Major 7 d/yr ≥111°F today · 17 d/yr by 30 yrs out
- Wind 2/10 Low 4% chance of damaging wind over 30 yrs
- Air quality 3/10 Moderate 2 unhealthy d/yr today · 3 by 30 yrs out
Nearby sold comps map
Loading sold comps map…
Walkable amenities ~0.75 mi
Loading nearby amenities…
Taxation est. · year 1
- Rental income
- $15,764
- − Mortgage interest
- −$3,921
- − Property taxes
- −$409
- − Insurance
- −$350
- − Repairs & maintenance
- −$1,261
- − Management
- −$1,261
- − Depreciation
- −$2,036
- Taxable income
- $6,525
- Est. tax owed @ 24.0%
- −$1,566
- After-tax cash flow
- $5,723/yr
For passive investors: Depreciation is non-cash, so a rental often shows a tax loss while cash-flowing — sheltering income. Rental losses are passive: they offset passive income freely, and up to $25,000/yr can offset ordinary (W-2) income if you actively participate and your MAGI is under $100k (phasing out to $0 by $150k); unused losses carry forward. On sale, claimed depreciation is recaptured at up to 25%, and gains may owe capital-gains tax (a 1031 exchange can defer both). Figures are a year-1 estimate at your 24.0% rate — not tax advice; consult a CPA.
Schools (NCES district)
- District
- Prue
- NCES district ID
- 4025170
- Math proficiency
- 45% ▲ 15.00%
- Reading proficiency
- 35% ▲ 5.00%
- Median HH income
- $45,700
- Composite
- 36.53/100
- National rank
- #9301
- State rank
- #102 of 513 in OK
Livability — Sand Springs
- Score
- 69/100
- State rank
- #54
- US rank
- #8849
Category grades
Schools grade is shown separately in the Schools card above.
Census & demographics
- County
- Tulsa County · 640,811 people
- City population
- 31,370
- Metro
- Tulsa, OK
- Population (ZIP)
- 31,370
- Household income
- $73,842
- Rent vs Own
- Severe rent burden
- 318.0
Population outlook (Osage County) Hauer SSP2
- Today (2025)
- 48,950 people
- By 2030
- 48,936 · +-0.0%
- By 2040
- 47,826 · -2.3%
- By 2050
- 45,781 · -6.5%
- By 2075
- 41,140 · -16.0%
- By 2100
- 32,796 · -33.0%
Race, ethnicity, and origin ACS 2023
- Neighborhood character
- Predominantly White (75%)
- Race & ethnicity
- White 75% Two or more races 12% Native American 8% Hispanic / Latino 5% Black 1%
- Hispanic origin (detail)
- Mexican 3%
- Common ancestry
- Italian 3% Slovak 3% Iranian 2%
- Foreign-born
- 2% · Canada
- Languages at home
- 97% English-only · Spanish 2%
Political lean MEDSL · Osage
- 2024 margin
- Solid R (+41.4) · D 28.4% · R 69.8% · Other 1.7%
- 2008→2024 swing
- -17.7pp toward R · 2008: -23.7pp · 2024: -41.4pp
- All cycles
- 2024: R+41.4 2020: R+39.5 2016: R+36.8 2012: R+25.2 2008: R+23.7
Not yet ingested
- Civics
- —
Market trends
- HPI YoY
- ▼ -165.09%
- Current HPI
- 230.6336
- Rent YoY
- ▲ 1.11%
- Metro
- Tulsa, OK
- State GDP YoY
- ▲ 1.55%
- F500 in state
- 6
Industry mix (Fortune 500 HQ in OK)
| Industry | F500 HQs | Revenue |
|---|---|---|
| Energy | 3 | $48B |
|
||
Price history
1 event — show timeline
- 2026-05-22 Listed $70,000 MLS Technology, Inc.
Property tax history
+3.1%/yrLatest (2025): $409 · +3.3% YoY. Source: county tax records.
Cash-flow waterfall
monthlySold comps — $/sqft
last 12 mo · ≤1 miLoading sold comps…