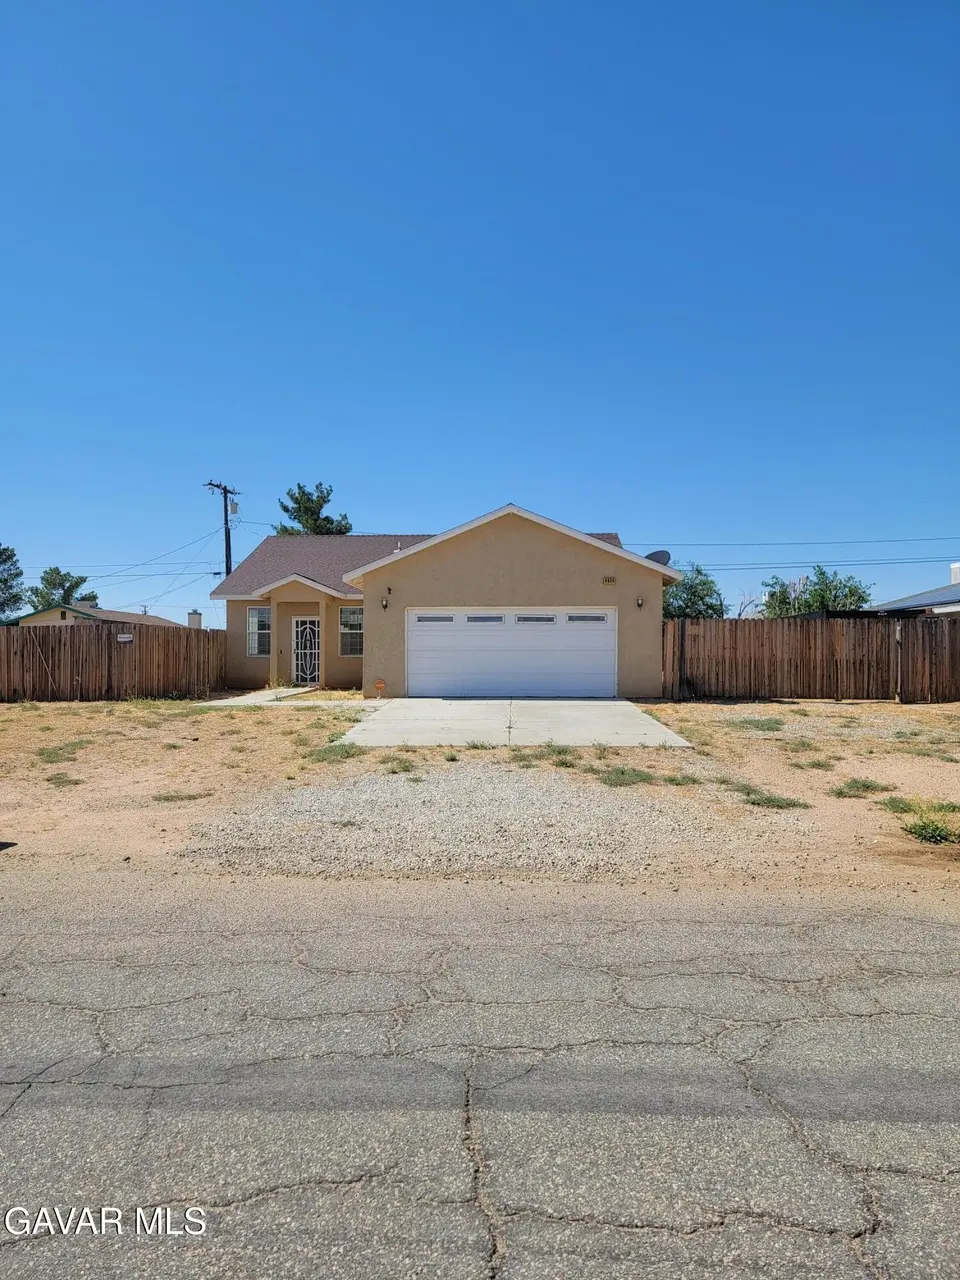
8836 Peach Ave · California City, CA
Flood risk 1/10 · Minimal
- FEMA flood zone
- X (unshaded)
- Chance of flooding over 30 yrs
- 0.0%
- Est. flood insurance / yr
- $507 – $1,088
Fire risk 1/10 · Minimal
- Est. fire insurance / yr
- $659 – $1,223
Heat risk 8/10 · Major
- Hot days now (above 101°F)
- 7 days/yr
- Hot days in 30 yrs
- 18 days/yr
Wind risk 1/10 · Minimal
- Chance of severe wind over 30 yrs
- —
Air-quality risk 7/10 · Major
- Unhealthy air days now
- 13 days/yr
- Unhealthy air days in 30 yrs
- 17 days/yr
Risk factors via First Street. Map © Google.
Why this score? — see what drove the B- grade
The composite is a weighted blend of 9 inputs, each scored 0–100. Each bar is that input's sub-score; the figure is the points it added to the 100-point composite (weight × sub-score).
- Cash flow +18.9/30.0
- ARV discount +15.0/15.0
- Appreciation +10.0/10.0
- DSCR +6.0/10.0
- 1% rule +5.7/10.0
- Rent growth +3.9/5.0
- Condition / age +2.5/5.0
- Livability +2.2/5.0
- Schools +2.1/10.0
$190,000
🖨 Deal sheet (PDF) 📄 Offer letter ✓ Due diligence
Listing remarks
* * * SHORT SALE * * * This home has 3 bedrooms with 2 baths with laminate, tile, and carpet throughout. The kitchen comes with quartz countertops with black appliances. This home plus is * * * PAID OFF SOLAR * * * and natural gas utilities. With RV access. Does need some TLC, excellent chance for buyers or investors. Priced for a quick sale, Note: terms and conditions will need final approval from lender
Key facts
- Paid off solar
- Rv access
- 9,583 sq ft lot
Tags
Property features AI
Finance
- Other: Zoning: R1; Lot is rectangular and paved/public streets; Legal tract: TRACT 2116; APN: 203-373-04-00-0; Square footage source: Assessor
Exterior
- Parking: 2-car garage
- Security: Security system (personal property included)
- Utilities: Public water; Septic system; 200+ amp electric service; 220V electric; Natural gas
- Home design: Ranch style; 1 story
- Construction: Stucco exterior; Composition shingle roof; Concrete slab foundation
- Exterior features: Back yard with wood fencing; Front zeroscape and rear zeroscape landscaping; RV access; Paid/owned solar panels
Interior
- Kitchen: Dishwasher; Refrigerator; Microwave; Gas range; Gas oven; Garbage disposal
- Flooring: Carpet; Laminate; Tile
- Bathrooms: 2 full bathrooms
- Heating & cooling: Central heating (natural gas); Central air
- Interior features: Dining in kitchen; Covered patio
- Laundry & utility: Hallway laundry location
Neighborhood map
What this means for you Summary
Snapshot
- This is a 3-bed/2.0-bath single-family listed at $190k.
Deal economics
- At list price, monthly cash flow is $196 ($2k/yr) — positive.
- The deal already cash-flows at list — no discount required.
- Meets the 1% rule at list price ($2k rent vs $190k).
- Recommended offer: $187k (1.5% below list) — sets the bar for market timing.
- Cap rate 7.5% vs local median 5.2% in California City — top-decile yield for the area; either an underpriced asset or a hidden risk that comps aren't pricing in. Stress-test before assuming the spread holds.
Location & tenants
- Location reads 44/100 on livability (#1,329 in CA) — a working-class tenant base; expect higher turnover. Strengths: housing A+; Watch: crime F, amenities F, commute F.
- Mojave Unified (town): math 25% / reading 25% proficiency, ranked #411 of 517 in CA (top 80%) — low school quality limits family demand, transient renter base, plan for 1-2y turnover; 76% free/reduced lunch — lower-income household profile, screen leases tightly.
- Zoned schools: Hacienda Elementary (528 students, 92% FRL); California City Middle (501 students, 87% FRL); California City High (655 students, 85% FRL).
- Market conditions: Rents rising fast (+5.5%/yr); 704 active listings in the ZIP; 30 comparable units currently listed for rent nearby; rentals at typical pace (median 25d on market — plan ~3-4 weeks tenant-placement turnaround); 3,244 units permitted in Kern County in 2024 (73 in 5+ unit buildings).
- This rent runs 41% of the median local income ($60k/yr) — at the standard rent-burdened threshold; future hikes will face affordability resistance.
Forward outlook
- In year one you build about $20k of equity ($1k loan paydown + $19k appreciation (10.0% local appreciation)).
- Kern County population projected at +17% by 2050 — long-run rental-demand tailwind backs the buy-and-hold thesis.
- At projected returns (10.0% appreciation + 5.5% rent growth), your $53k cash investment doubles in ~3 years — after that, you're playing with house money.
- By year 2, paydown + projected appreciation supports a ~$33k cash-out refi (75% LTV) — recoverable capital for the next deal without selling this one.
Negotiation context
- It's been on market 18 days — a 2% lower offer ($187k) is reasonable based on typical stale-listing flexibility.
- 9 sale attempts since 20y ago with the ask held roughly flat each time — persistent listings suggest the price (not the market) is what's stuck; bring a comps-based counter.
Risks & watch-outs
- Climate carrying-cost: extreme-heat days projected 7→18/yr by 2055 (HVAC capex compounding) — expect insurance premiums to compound above CPI over the hold.
Questions for the listing agent
- Is there a deadline driving the sale (1031 exchange, divorce, estate, relocation)? That informs how much negotiation room exists.
- Schools are F-rated, which usually means shorter tenancies and higher turnover. Who's the typical renter profile here, and what's been the actual vacancy rate?
- Crime grade is F in this area — have there been break-ins, vandalism, or insurance claims at this property in the last 3 years? What carrier currently insures it and at what premium?
- What's the average days-on-market for RENTAL listings here right now (not sales)? A rising rental-DOM trend means longer vacancies and softer asking-rent achievability than the comps imply.
- What's the recent tenant-quality profile in this submarket — average credit score on applications, eviction rate, late-payment / NSF rate, and stable-employment percentage? A property-management company in the area should have these aggregated.
- How much new for-sale + rental construction is in the pipeline within 1–3 miles? Heavy new supply typically softens prices + rents 12–24 months out; constrained supply supports both.
Investment metrics
- 1% rule
- 1.07% ✓
- Cap rate
- 7.53%
- Cash-on-cash
- 4.41%
- DSCR
- 1.20
- GRM
- 7.8
CMA / ARV
- ARV (on-the-fly)
- $261,900
- Comps found
- 12
Show comp detail 12 sales within ~0.75 mi
| Address | Dist | Beds/Ba | Sqft | Sold | Price | $/sf | Match |
|---|---|---|---|---|---|---|---|
| 20201 Airway Blvd | 0.20mi | 3/2.0 | 1,311 (-3%) | 4mo | $190,000 | $145 | 82 |
| 8485 Tamarack Ave | 0.42mi | 3/2.0 | 1,377 (+2%) | 0mo | $205,000 | $149 | 77 |
| 20100 87th | 0.17mi | 3/2.0 | 1,222 (-10%) | 3mo | $240,000 | $196 | 74 |
| 20024 87th | 0.17mi | 3/2.0 | 1,173 (-13%) | 2mo | $335,000 | $286 | 68 |
| 20412 90th St | 0.44mi | 3/2.0 | 1,431 (+6%) | 3mo | $250,000 | $175 | 67 |
| 9237 Peach Ave | 0.43mi | 3/2.0 | 1,465 (+8%) | 5mo | $250,000 | $171 | 62 |
| 8413 Viburnum Ave | 0.54mi | 3/2.0 | 1,437 (+6%) | 5mo | $328,570 | $229 | 60 |
| 8668 S Loop Blvd | 0.66mi | 3/2.0 | 1,277 (-5%) | 1mo | $290,000 | $227 | 59 |
| 8760 South Loop Blvd | 0.53mi | 4/2.0 (+1) | 1,429 (+6%) | 6mo | $319,900 | $224 | 56 |
| 8412 Ironwood | 0.56mi | 3/1.0 | 1,224 (-9%) | 3mo | $158,000 | $129 | 52 |
| 8348 Lime | 0.54mi | 3/2.0 | 1,537 (+14%) | 1mo | $265,150 | $173 | 51 |
| 8325 Jacarada | 0.61mi | 4/2.0 (+1) | 1,548 (+15%) | 3mo | $299,990 | $194 | 39 |
Match score weights: distance 35% · size 25% · config 20% · recency 20%. Top-matched comps best support the ARV.
Projected returns pro-forma
10.0% appreciation · 5.45% rent growth · sell at horizon
- IRR
- 28.5%
- Equity multiple
- 3.28×
- Total profit
- $121,150
- Equity at exit
- $171,167
- IRR
- 25.6%
- Equity multiple
- 7.74×
- Total profit
- $358,606
- Equity at exit
- $369,128
Cash invested: $53,200 (down + closing). Projections, not guarantees.
Landlord ↔ Tenant lean methodology
- Overall (STATE)
- 18 Strongly Tenant-Friendly
- State California
- 18 Strongly Tenant-Friendly · D+13
- County
- — inherits STATE
- City
- — inherits STATE
ZIP-level market 93505
- Home prices YoY
- 13.0%
- Rents YoY
- 5.5%
- Active inventory
- 704
- Price-to-rent
- 7.8×
Monthly cashflow live
- Estimated rent
- $2,027 high interval (Pro) →
- Mortgage (P&I)
- −$996
- Tax from tax record
- −$330 /mo · $3,957/yr
- Insurance
- −$79
- HOA
- −$0
- Vacancy / Maint / Mgmt
- −$426
- Net cashflow
- $196
Break-even live
Sensitivity live
| Price | -10% $303 | -5% $250 | +0% $196 | +5% $142 | +10% $88 |
|---|---|---|---|---|---|
| Rent | -10% $36 | -5% $116 | +0% $196 | +5% $276 | +10% $356 |
| Rate | -1.0pp $291 | -0.5pp $244 | base $196 | +0.5pp $146 | +1.0pp $96 |
UW: 25.0% down · 7.5% · 30yr · 1.5% tax · 5.0% vac · 8.0% maint · 8.0% mgmt
Financing live
Cash to close
- Down payment
- $47,500
- Closing costs
- $5,700
- Reserves months
- —
- Total cash needed
- —
Loan-product check · same deal, 3 products live
Conventional
25% down · 7.5% · 30yr
- Down + closing
- —
- Monthly P&I
- —
- Monthly cashflow
- —
- DSCR
- —
- Eligible?
- —
Personal DTI + credit; lowest rate.
DSCR
20% down · 8.5% · 30yr
- Down + closing
- —
- Monthly P&I
- —
- Monthly cashflow
- —
- DSCR
- —
- Eligible?
- —
No personal income docs; deal must DSCR.
Hard money
10% down · 12.0% · 12mo
- Down + closing
- —
- Monthly P&I
- —
- Monthly cashflow
- —
- DSCR
- —
- Eligible?
- —
Short-term bridge; refi at stabilization.
Rent comps 30 comps
| Address | Beds | Baths | Sqft | Rent | $/sqft | DOM | Units | Dist |
|---|---|---|---|---|---|---|---|---|
| 8848 Oleander Ave California City, CA | 3.0 | 2.0 | 1302 | $1,900 | $1.46 | 25d | 1 | 0.07mi |
| 20001 Airway Blvd California City, CA | 3.0 | 2.0 | 1050 | $2,400 | $2.29 | 25d | 1 | 0.17mi |
| 9000 Underwood Ave California City, CA | 3.0 | 2.0 | 1540 | $1,900 | $1.23 | 0d | 1 | 0.28mi |
| 20321 88th St California City, CA | 3.0 | 2.0 | 1176 | $2,100 | $1.79 | 25d | 1 | 0.31mi |
| 8648 Lime Ave California City, CA | 3.0 | 2.0 | 1459 | $2,400 | $1.64 | 25d | 1 | 0.32mi |
| 8560 Nipa Ave California City, CA | 3.0 | 2.0 | 1309 | $1,850 | $1.41 | 16d | 1 | 0.35mi |
| 9225 Peach Ave Unit A California City, CA | 3.0 | 2.0 | 1275 | $1,950 | $1.53 | 25d | 1 | 0.39mi |
| 8512 Tamarack Ave California City, CA | 3.0 | 2.0 | 1502 | $1,875 | $1.25 | 25d | 1 | 0.40mi |
| 20312 Dean Ct California City, CA | 3.0 | 2.0 | 1742 | $1,975 | $1.13 | 16d | 1 | 0.42mi |
| 8449 Viburnum Ave California City, CA | 3.0 | 2.0 | 1218 | $1,695 | $1.39 | 1d | 1 | 0.52mi |
| 8801 S Loop Blvd California City, CA | 3.0 | 2.0 | 1537 | $2,600 | $1.69 | 25d | 1 | 0.54mi |
| 8849 Glade Ave California City, CA | 3.0 | 2.0 | 1586 | $2,380 | $1.50 | 11d | 1 | 0.57mi |
| 8312 Tamarack Ave California City, CA | 3.0 | 2.0 | 1539 | $1,900 | $1.23 | 25d | 1 | 0.61mi |
| 9213 Holly Ave California City, CA | 3.0 | 2.0 | 1339 | $1,900 | $1.42 | 5d | 1 | 0.63mi |
| 9610 Oleander Ave Unit A California City, CA | 2.0 | 1.0 | 1300 | $1,575 | $1.21 | 25d | 1 | 0.68mi |
| 8260 Viburnum Ave California City, CA | 3.0 | 2.0 | 1338 | $2,000 | $1.49 | 4d | 1 | 0.68mi |
| 8173 Viburnum Ave California City, CA | 3.0 | 2.0 | 1482 | $2,150 | $1.45 | 4d | 1 | 0.74mi |
| 8651 S Loop Blvd California City, CA | 2.0 | 1.0 | 1050 | $1,650 | $1.57 | 5d | 1 | 0.76mi |
| 8160 Kalmia Ave California City, CA | 3.0 | 2.0 | 1277 | $1,795 | $1.41 | 25d | 1 | 0.77mi |
| 8124 Underwood Ave California City, CA | 3.0 | 2.0 | 1507 | $1,850 | $1.23 | 25d | 1 | 0.82mi |
| 20673 Medio St California City, CA | 3.0 | 2.0 | 1690 | $2,075 | $1.23 | 25d | 1 | 0.85mi |
| 8100 Fernwood Ave California City, CA | 3.0 | 2.0 | 1336 | $1,850 | $1.38 | 25d | 1 | 0.97mi |
| 8709 Xavier Ave Unit 3 California City, CA | 2.0 | 1.0 | 900 | $1,500 | $1.67 | 16d | 1 | 1.05mi |
| 20961 83rd St Unit 6 California City, CA | 2.0 | 2.0 | 1100 | $1,300 | $1.18 | 25d | 1 | 1.07mi |
| 8531 Columbine Ave Unit B California City, CA | 2.0 | 2.0 | 1000 | $1,300 | $1.30 | 16d | 1 | 1.13mi |
| 8816 Fuchsia Ave Unit PASSTHROUGH B California City, CA | 2.0 | 2.0 | 1077 | $1,550 | $1.44 | 16d | 1 | 1.19mi |
| 21231 Corwin St California City, CA | 3.0 | 2.0 | 1632 | $2,500 | $1.53 | 25d | 1 | 1.22mi |
| 8318 Dogbane Ave Unit F California City, CA | 2.0 | 1.0 | 880 | $1,350 | $1.53 | 25d | 1 | 1.27mi |
| 21032 79th St California City, CA | 4.0 | 2.0 | 1228 | $2,100 | $1.71 | 25d | 1 | 1.41mi |
| 21411 Hacienda Blvd Unit D California City, CA | 2.0 | 2.0 | 898 | $1,475 | $1.64 | 25d | 1 | 1.43mi |
Listing history 13 events
-
2026-06-22days on market $190,000 Active 18 DOM
-
2026-06-18days on market $190,000 Active 15 DOM
-
2026-06-17days on market $190,000 Active 14 DOM
-
2026-06-16days on market $190,000 Active 13 DOM
-
2026-06-15days on market $190,000 Active 12 DOM
-
2026-06-14days on market $190,000 Active 10 DOM
-
2026-06-13days on market $190,000 Active 9 DOM
-
2026-06-10days on market $190,000 Active 7 DOM
-
2026-06-09days on market $190,000 Active 6 DOM
-
2026-06-08days on market $190,000 Active 5 DOM
-
2026-06-07days on market $190,000 Active 4 DOM
-
2026-06-05remarks 421-char remark
-
2026-06-05$190,000 Active 1 DOM
ⓘ Source: listings_history table (triggers on properties + properties_extension) + one-shot
backfill from property_details.listing_events for pre-trigger history.
Tax reassessment forecast CA · Resets to sale price
- Current annual tax
- $3,957 · $330/mo
- Projected year-2 tax
- $3,957 · $330/mo
- Expected delta
- $0/yr ($0/mo · 0.0%)
ⓘ Screening estimate from a state-policy table — verify with the county assessor before closing.
Climate risk First Street
- Flood 1/10 Low FEMA zone X (unshaded) · 0% chance over 30 yrs
- Wildfire 1/10 Low
- Heat 8/10 Severe 7 d/yr ≥101°F today · 18 d/yr by 30 yrs out
- Wind 1/10 Low
- Air quality 7/10 Severe 13 unhealthy d/yr today · 17 by 30 yrs out
Nearby sold comps map
Loading sold comps map…
Walkable amenities ~0.75 mi
Loading nearby amenities…
Taxation est. · year 1
- Rental income
- $24,319
- − Mortgage interest
- −$10,643
- − Property taxes
- −$3,957
- − Insurance
- −$950
- − Repairs & maintenance
- −$1,946
- − Management
- −$1,946
- − Depreciation
- −$5,527
- Taxable loss
- −$649
- Est. tax savings @ 24.0%
- +$156
- After-tax cash flow
- $2,504/yr
For passive investors: Depreciation is non-cash, so a rental often shows a tax loss while cash-flowing — sheltering income. Rental losses are passive: they offset passive income freely, and up to $25,000/yr can offset ordinary (W-2) income if you actively participate and your MAGI is under $100k (phasing out to $0 by $150k); unused losses carry forward. On sale, claimed depreciation is recaptured at up to 25%, and gains may owe capital-gains tax (a 1031 exchange can defer both). Figures are a year-1 estimate at your 24.0% rate — not tax advice; consult a CPA.
Schools (NCES district)
- District
- Mojave Unified
- NCES district ID
- 0625230
- Math proficiency
- 25% ▲ 11.00%
- Reading proficiency
- 25% ▼ -1.00%
- Median HH income
- $43,017
- Composite
- 21.4/100
- National rank
- #8350
- State rank
- #411 of 517 in CA
Livability — California City
- Score
- 44/100
- State rank
- #1329
- US rank
- #26753
Category grades
Schools grade is shown separately in the Schools card above.
Census & demographics
- Census place
- California City, CA
- County
- Kern County · 710,371 people
- City population
- 14,353
- Metro
- Bakersfield, CA
- Population (ZIP)
- 14,353
- Household income
- $59,827
- Rent vs Own
- Severe rent burden
- 883.0
Population outlook (Kern County) Hauer SSP2
- Today (2025)
- 947,286 people
- By 2030
- 978,984 · +3.3%
- By 2040
- 1,045,018 · +10.3%
- By 2050
- 1,105,232 · +16.7%
- By 2075
- 1,229,538 · +29.8%
- By 2100
- 1,238,059 · +30.7%
Race, ethnicity, and origin ACS 2023
- Neighborhood character
- Highly diverse neighborhood (Simpson 0.70)
- Race & ethnicity
- Hispanic / Latino 40% White 30% Black 22% Two or more races 16% Native American 3% Asian 1%
- Hispanic origin (detail)
- Mexican 29%
- Common ancestry
- Italian 3% Lithuanian 1% Romanian 1%
- Foreign-born
- 13% · Canada, Dominican Republic
- Languages at home
- 68% English-only · Spanish 29%
Political lean MEDSL · Kern
- 2024 margin
- Strong R (+21.1) · D 38.2% · R 59.3% · Other 2.5%
- 2008→2024 swing
- -3.3pp toward R · 2008: -17.8pp · 2024: -21.1pp
- All cycles
- 2024: R+21.1 2020: R+10.2 2016: R+15.0 2012: R+20.9 2008: R+17.8
Not yet ingested
- Civics
- —
Market trends
- HPI YoY
- ▲ 46.32%
- Current HPI
- 402.4192
- Rent YoY
- ▲ 5.45%
- Metro
- Bakersfield, CA
- State GDP YoY
- ▲ 3.21%
- F500 in state
- 116
Industry mix (Fortune 500 HQ in CA)
| Industry | F500 HQs | Revenue |
|---|---|---|
| Technology | 27 | $1,492B |
|
||
| Financial Services | 3 | $174B |
|
||
| Retail | 3 | $44B |
|
||
| Insurance | 3 | $26B |
|
||
| Media / Entertainment | 2 | $115B |
|
||
| Pharmaceuticals / Biotech | 2 | $62B |
|
||
Price history
+744.4% since first listed21 events — show timeline
- 2026-06-03 Listed $190,000 AVMLS
- 2024-10-31 Listing Removed — CRMLS
- 2024-04-11 Listed $315,000 CRMLS
- 2023-10-06 Listing Removed — CRMLS
- 2023-07-15 Listed $312,000 CRMLS
- 2022-08-05 Sold (MLS) $300,000 CRMLS
- 2022-08-05 Sold (MLS) $300,000 AVMLS
- 2022-08-04 Sold (Public Records) $300,000 Public Records
- 2022-07-10 Pending — CRMLS
- 2022-07-10 Pending — AVMLS
- 2022-07-05 Listed $285,000 CRMLS
- 2022-07-02 Listed $285,000 AVMLS
- 2015-03-18 Listing Removed — AVMLS
- 2015-03-17 Listing Removed — AVMLS
- 2008-09-05 Sold (MLS) $111,500 AVMLS
- 2008-04-11 Listed $104,900 AVMLS
- 2008-02-22 Listed $129,000 AVMLS
- 2007-05-08 Listed $148,500 AVMLS
- 2006-10-31 Sold (MLS) $230,000 AVMLS
- 2006-03-28 Listed $219,900 AVMLS
- 2006-01-05 Sold (Public Records) $22,500 Public Records
Property tax history
+13.9%/yrLatest (2025): $3,957 · -5.4% YoY. Source: county tax records.
Cash-flow waterfall
monthlySold comps — $/sqft
last 12 mo · ≤1 miLoading sold comps…