 🏷️ Likely Rental
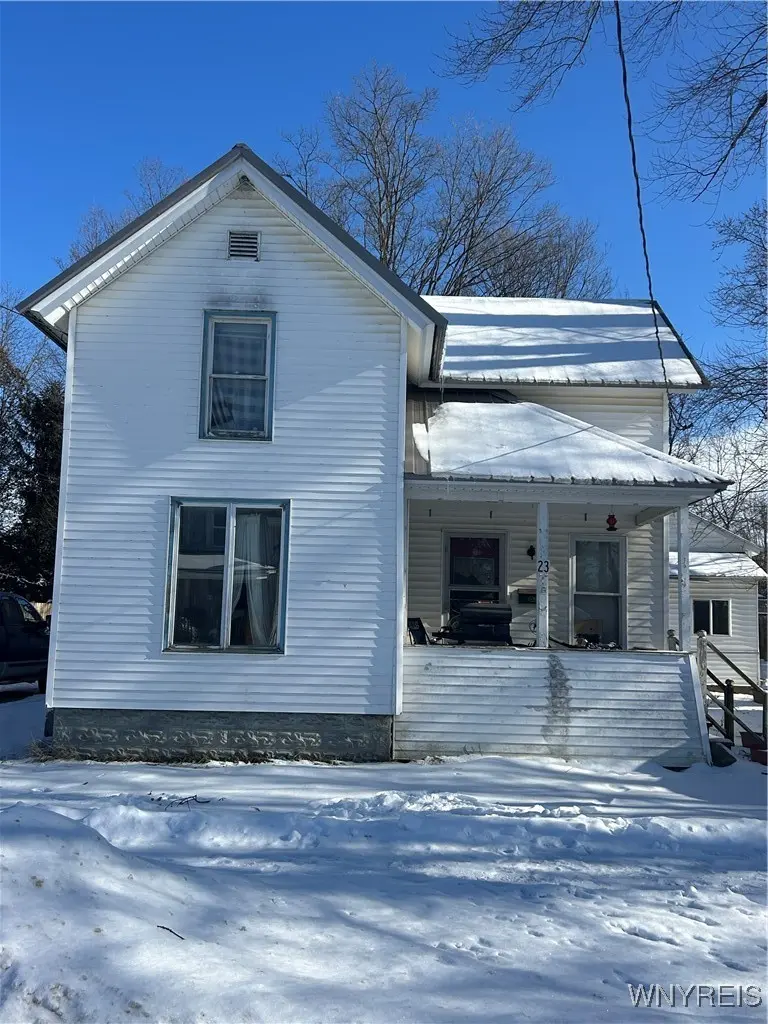
23 Church St · Franklinville, NY
Flood risk 6/10 · Moderate
- FEMA flood zone
- X
- Chance of flooding over 30 yrs
- 0.69%
- Est. flood insurance / yr
- $473 – $860
Fire risk 1/10 · Minimal
- Est. fire insurance / yr
- $691 – $1,283
Heat risk 2/10 · Minimal
- Hot days now (above 88°F)
- 8 days/yr
- Hot days in 30 yrs
- 18 days/yr
Wind risk 1/10 · Minimal
- Chance of severe wind over 30 yrs
- —
Air-quality risk 2/10 · Minimal
- Unhealthy air days now
- 0 days/yr
- Unhealthy air days in 30 yrs
- 1 days/yr
Risk factors via First Street. Map © Google.
Why this score? — see what drove the A grade
The composite is a weighted blend of 9 inputs, each scored 0–100. Each bar is that input's sub-score; the figure is the points it added to the 100-point composite (weight × sub-score).
- Cash flow +30.0/30.0
- ARV discount +15.0/15.0
- 1% rule +10.0/10.0
- DSCR +10.0/10.0
- Appreciation +8.0/10.0
- Schools +4.9/10.0
- Livability +3.1/5.0
- Rent growth +2.5/5.0
- Condition / age +2.5/5.0
$69,900
🖨 Deal sheet (PDF) 📄 Offer letter ✓ Due diligence
Listing remarks MLS
Income-producing opportunity featuring two single-family homes on one . 20-acre lot! The property includes a 4-bedroom, 1-bath main house with a first-floor bedroom and a NEW high-efficiency furnace. Main house is occupied by a long-term, paying tenant who would prefer to stay. With a few renovations, the 1-bedroom, 1-bath house in back could be ideal for rental or in-law use. When fully occupied, the property delivers gross annual rental income of $16,200, offering immediate cash-flow potential. Updated metal roofs on both homes reduce long-term maintenance costs. NEW water meter was installed last year. Located close to village services, shops and the new multi-million dollar cheese factory in Franklinville, this property is well-positioned for rental demand growth and long-term appreciation. This versatile asset is suited for long term rentals, house-hacking or multi-generational occupancy. Property sold "as-is". Seller desires a quick sale, CASH buyers only please!
Key facts
- First-floor bedroom
- New water meter
- Village location
Tags
Neighborhood map
What this means for you Summary
Snapshot
- This is a 4-bed/1.0-bath single-family listed at $70k.
Deal economics
- At list price, monthly cash flow is $317 ($4k/yr) — positive.
- The deal already cash-flows at list — no discount required.
- Meets the 1% rule at list price ($1k rent vs $70k).
- Recommended offer: $62k (12.0% below list) — sets the bar for market timing.
Location & tenants
- Location reads 62/100 on livability (#856 in NY) — a middle-class / working-renter tenant base. Strengths: cost of living A+, housing A+, crime A-; Watch: employment C-, schools D+, amenities F.
- Franklinville Central School District (rural): math 60% / reading 57% proficiency, ranked #281 of 590 in NY (top 48%) — acceptable for families but not a draw, mixed tenant base, ~2y average lease.
- Market conditions: 33 active listings in the ZIP; 128 units permitted in Cattaraugus County in 2024 (21 in 5+ unit buildings).
Forward outlook
- In year one you build about $5k of equity ($483 loan paydown + $4k appreciation (5.9% local appreciation)).
- Cattaraugus County population projected at -28% by 2050 — secular population decline; favor cash flow + early exit over multi-decade hold.
- At projected returns (5.9% appreciation + 3.0% rent growth), your $20k cash investment doubles in ~3 years — after that, you're playing with house money.
- By year 7, paydown + projected appreciation supports a ~$30k cash-out refi (75% LTV) — recoverable capital for the next deal without selling this one.
Negotiation context
- It's been on market 156 days — a 12% lower offer ($62k) is reasonable based on typical stale-listing flexibility.
- 6 sale attempts since 3y ago; this cycle's ask has dropped $5k (7%) from the opening price — seller is motivated, your offer sets the floor, not the list.
- Current owner paid $25k; list at $70k implies a 180% gain — meaningful room to come down on a strong offer.
Risks & watch-outs
- Watch-outs: property tax is 5.0% of price; built in 1900 — expect roof / HVAC / electrical / plumbing capex.
- Climate carrying-cost: major flood risk — expect insurance premiums to compound above CPI over the hold.
Questions for the listing agent
- It's been on market 156 days. Have you received any prior offers? Is the seller open to a 12% concession, seller financing, or rate buy-down credit?
- Built in 1900 — when were the roof, HVAC, electrical panel, plumbing, and water heater last replaced?
- Property tax is high relative to price — has the assessment been appealed recently, and will the sale trigger a re-assessment?
- Why hasn't it sold? Are there any deal-killer items the seller is aware of (foundation, flood, title, zoning, code violations)?
- Is there a deadline driving the sale (1031 exchange, divorce, estate, relocation)? That informs how much negotiation room exists.
- Schools are D-rated, which usually means shorter tenancies and higher turnover. Who's the typical renter profile here, and what's been the actual vacancy rate?
- What's the average days-on-market for RENTAL listings here right now (not sales)? A rising rental-DOM trend means longer vacancies and softer asking-rent achievability than the comps imply.
- What's the recent tenant-quality profile in this submarket — average credit score on applications, eviction rate, late-payment / NSF rate, and stable-employment percentage? A property-management company in the area should have these aggregated.
- How much new for-sale + rental construction is in the pipeline within 1–3 miles? Heavy new supply typically softens prices + rents 12–24 months out; constrained supply supports both.
Investment metrics
- 1% rule
- 1.82% ✓
- Cap rate
- 11.74%
- Cash-on-cash
- 19.44%
- DSCR
- 1.86
- GRM
- 4.6
CMA / ARV
- ARV (median comp)
- $99,684
- List price
- $69,900
- Delta
- -29.88%
- Verdict
- UNDERPRICED
- Comps
- 6 within 1.0 mi
Show comp detail 7 sales within ~0.75 mi
| Address | Dist | Beds/Ba | Sqft | Sold | Price | $/sf | Match |
|---|---|---|---|---|---|---|---|
| 19 1st Ave | 0.24mi | 4/2.0 | 1,712 (-3%) | 12mo | $215,000 | $126 | 70 |
| 14 2nd Ave | 0.27mi | 3/2.0 (-1) | 1,760 (0%) | 11mo | $185,000 | $105 | 69 |
| 65 Pine St | 0.40mi | 3/2.0 (-1) | 1,722 (-2%) | 10mo | $162,000 | $94 | 60 |
| 57 N Main St | 0.24mi | 3/1.0 (-1) | 1,624 (-8%) | 13mo | $88,000 | $54 | 60 |
| 10 Chestnut St | 0.16mi | 3/1.5 (-1) | 1,924 (+9%) | 16mo | $210,000 | $109 | 57 |
| 15 Maple Ave | 0.45mi | 4/2.0 | 1,664 (-6%) | 15mo | $184,000 | $111 | 54 |
| 59 N Main St | 0.25mi | 3/1.5 (-1) | 1,568 (-11%) | 16mo | $43,000 | $27 | 50 |
Match score weights: distance 35% · size 25% · config 20% · recency 20%. Top-matched comps best support the ARV.
Projected returns pro-forma
5.93% appreciation · 3.0% rent growth · sell at horizon
- IRR
- 31.6%
- Equity multiple
- 3.05×
- Total profit
- $40,218
- Equity at exit
- $43,625
- IRR
- 29.5%
- Equity multiple
- 6.26×
- Total profit
- $102,856
- Equity at exit
- $78,840
Cash invested: $19,572 (down + closing). Projections, not guarantees.
Landlord ↔ Tenant lean methodology
- Overall (STATE)
- 15 Strongly Tenant-Friendly
- State New York
- 15 Strongly Tenant-Friendly · D+10
- County
- — inherits STATE
- City
- — inherits STATE
ZIP-level market 14737
- Home prices YoY
- 2.0%
- Active inventory
- 33
- Price-to-rent
- 4.6×
Monthly cashflow live
- Estimated rent
- $1,270 medium interval (Pro) →
- Mortgage (P&I)
- −$367
- Tax from tax record
- −$290 /mo · $3,484/yr
- Insurance
- −$29
- HOA
- −$0
- Vacancy / Maint / Mgmt
- −$267
- Net cashflow
- $317
Break-even live
Sensitivity live
| Price | -10% $568 | -5% $544 | +0% $317 | +5% $297 | +10% $277 |
|---|---|---|---|---|---|
| Rent | -10% $217 | -5% $267 | +0% $317 | +5% $367 | +10% $417 |
| Rate | -1.0pp $352 | -0.5pp $335 | base $317 | +0.5pp $299 | +1.0pp $280 |
UW: 25.0% down · 7.5% · 30yr · 1.5% tax · 5.0% vac · 8.0% maint · 8.0% mgmt
Financing live
Cash to close
- Down payment
- $17,475
- Closing costs
- $2,097
- Reserves months
- —
- Total cash needed
- —
Loan-product check · same deal, 3 products live
Conventional
25% down · 7.5% · 30yr
- Down + closing
- —
- Monthly P&I
- —
- Monthly cashflow
- —
- DSCR
- —
- Eligible?
- —
Personal DTI + credit; lowest rate.
DSCR
20% down · 8.5% · 30yr
- Down + closing
- —
- Monthly P&I
- —
- Monthly cashflow
- —
- DSCR
- —
- Eligible?
- —
No personal income docs; deal must DSCR.
Hard money
10% down · 12.0% · 12mo
- Down + closing
- —
- Monthly P&I
- —
- Monthly cashflow
- —
- DSCR
- —
- Eligible?
- —
Short-term bridge; refi at stabilization.
Listing history 33 events
-
2026-06-21days on market $69,900 Active 156 DOM
-
2026-06-18days on market $69,900 Active 154 DOM
-
2026-06-17days on market $69,900 Active 153 DOM
-
2026-06-16days on market $69,900 Active 152 DOM
-
2026-06-15days on market $69,900 Active 151 DOM
-
2026-06-13days on market $69,900 Active 149 DOM
-
2026-06-12days on market $69,900 Active 148 DOM
-
2026-06-09days on market $69,900 Active 145 DOM
-
2026-06-08days on market $69,900 Active 144 DOM
-
2026-06-07days on market $69,900 Active 143 DOM
-
2026-06-07days on market $69,900 Active 142 DOM
-
2026-06-04days on market $69,900 Active 139 DOM
-
2026-06-02days on market $69,900 Active 138 DOM
-
2026-06-01days on market $69,900 Active 137 DOM
-
2026-05-31days on market $69,900 Active 136 DOM
-
2026-04-22price $69,900 993-char remark
Show marketing remark (993 chars)
Income-producing opportunity featuring two single-family homes on one . 20-acre lot! The property includes a 4-bedroom, 1-bath main house with a first-floor bedroom and a NEW high-efficiency furnace. Main house is occupied by a long-term, paying tenant who would prefer to stay. With a few renovations, the 1-bedroom, 1-bath house in back could be ideal for rental or in-law use. When fully occupied, the property delivers gross annual rental income of $16,200, offering immediate cash-flow potential. Updated metal roofs on both homes reduce long-term maintenance costs. NEW water meter was installed last year. Located close to village services, shops and the new multi-million dollar cheese factory in Franklinville, this property is well-positioned for rental demand growth and long-term appreciation. This versatile asset is suited for long term rentals, house-hacking or multi-generational occupancy. Property sold "as-is". Seller desires a quick sale, CASH buyers only please!
-
2026-01-14$75,000 Active 993-char remark
Show marketing remark (993 chars)
Income-producing opportunity featuring two single-family homes on one . 20-acre lot! The property includes a 4-bedroom, 1-bath main house with a first-floor bedroom and a NEW high-efficiency furnace. Main house is occupied by a long-term, paying tenant who would prefer to stay. With a few renovations, the 1-bedroom, 1-bath house in back could be ideal for rental or in-law use. When fully occupied, the property delivers gross annual rental income of $16,200, offering immediate cash-flow potential. Updated metal roofs on both homes reduce long-term maintenance costs. NEW water meter was installed last year. Located close to village services, shops and the new multi-million dollar cheese factory in Franklinville, this property is well-positioned for rental demand growth and long-term appreciation. This versatile asset is suited for long term rentals, house-hacking or multi-generational occupancy. Property sold "as-is". Seller desires a quick sale, CASH buyers only please!
-
2025-05-28status Pending
-
2025-05-28historical
-
2025-01-22price $75,000
-
2024-12-04$84,900 Active
-
2024-11-30historical
-
2024-09-20price $89,900
-
2024-06-28price $99,000
-
2024-05-31$115,000 Active
-
2024-05-23historical
-
2024-05-19status Active
-
2024-05-02status Pending
-
2024-02-20price $119,900
-
2024-01-03$134,900 Active
-
2023-12-27historical
-
2023-12-09$139,900 Active
-
2005-07-29soldstatus $25,000
ⓘ Source: listings_history table (triggers on properties + properties_extension) + one-shot
backfill from property_details.listing_events for pre-trigger history.
Tax reassessment forecast NY · Partial reset (capped growth)
- Current annual tax
- $3,484 · $290/mo
- Projected year-2 tax
- $3,484 · $290/mo
- Expected delta
- $0/yr ($0/mo · 0.0%)
ⓘ Screening estimate from a state-policy table — verify with the county assessor before closing.
Climate risk First Street
- Flood 6/10 Major FEMA zone X · 69% chance over 30 yrs
- Wildfire 1/10 Low
- Heat 2/10 Low 8 d/yr ≥88°F today · 18 d/yr by 30 yrs out
- Wind 1/10 Low
- Air quality 2/10 Low 0 unhealthy d/yr today · 1 by 30 yrs out
Nearby sold comps map
Loading sold comps map…
Walkable amenities ~0.75 mi
Loading nearby amenities…
Taxation est. · year 1
- Rental income
- $15,236
- − Mortgage interest
- −$3,915
- − Property taxes
- −$3,484
- − Insurance
- −$350
- − Repairs & maintenance
- −$1,219
- − Management
- −$1,219
- − Depreciation
- −$2,033
- Taxable income
- $3,016
- Est. tax owed @ 24.0%
- −$724
- After-tax cash flow
- $3,080/yr
For passive investors: Depreciation is non-cash, so a rental often shows a tax loss while cash-flowing — sheltering income. Rental losses are passive: they offset passive income freely, and up to $25,000/yr can offset ordinary (W-2) income if you actively participate and your MAGI is under $100k (phasing out to $0 by $150k); unused losses carry forward. On sale, claimed depreciation is recaptured at up to 25%, and gains may owe capital-gains tax (a 1031 exchange can defer both). Figures are a year-1 estimate at your 24.0% rate — not tax advice; consult a CPA.
Schools (NCES district)
- District
- Franklinville Central School District
- NCES district ID
- 3611490
- Math proficiency
- 60% ▲ 11.00%
- Reading proficiency
- 57% ▲ 16.00%
- Median HH income
- $41,110
- Composite
- 49.0/100
- National rank
- #2068
- State rank
- #281 of 590 in NY
Livability — Franklinville
- Score
- 62/100
- State rank
- #856
- US rank
- #16514
Category grades
Schools grade is shown separately in the Schools card above.
Census & demographics
- Census place
- Franklinville, NY
- Population (ZIP)
- 4,071
Population outlook (Cattaraugus County) Hauer SSP2
- Today (2025)
- 71,623 people
- By 2030
- 67,751 · -5.4%
- By 2040
- 59,488 · -16.9%
- By 2050
- 51,601 · -28.0%
- By 2075
- 35,025 · -51.1%
- By 2100
- 21,243 · -70.3%
Race, ethnicity, and origin ACS 2023
- Neighborhood character
- Predominantly White (85%)
- Race & ethnicity
- White 85% Two or more races 9% Hispanic / Latino 5% Native American 1%
- Common ancestry
- Romanian 10% Iranian 2% Lithuanian 2%
- Foreign-born
- 2% · Canada
- Languages at home
- 97% English-only · German/W. Germanic 1%
Political lean MEDSL · Cattaraugus
- 2024 margin
- Solid R (+32.8) · D 33.6% · R 66.4%
- 2008→2024 swing
- -22.2pp toward R · 2008: -10.6pp · 2024: -32.8pp
- All cycles
- 2024: R+32.8 2020: R+29.5 2016: R+34.4 2012: R+13.4 2008: R+10.6
Not yet ingested
- Civics
- —
Market trends
- HPI YoY
- ▲ 5.93%
- Current HPI
- 305.4492
- Rent YoY
- —
- Metro
- —
- State GDP YoY
- ▲ 2.60%
- F500 in state
- 92
Industry mix (Fortune 500 HQ in NY)
| Industry | F500 HQs | Revenue |
|---|---|---|
| Financial Services | 10 | $950B |
|
||
| Consumer Goods | 9 | $162B |
|
||
| Insurance | 4 | $225B |
|
||
| Telecommunications | 2 | $144B |
|
||
| Pharmaceuticals | 2 | $112B |
|
||
| Media / Entertainment | 2 | $69B |
|
||
Price history
+179.6% since first listed18 events — show timeline
- 2026-04-22 Price Changed $69,900 WNYREIS
- 2026-01-14 Listed $75,000 WNYREIS
- 2025-05-28 Pending — WNYREIS
- 2025-05-28 Listing Removed — WNYREIS
- 2025-01-22 Price Changed $75,000 WNYREIS
- 2024-12-04 Listed $84,900 WNYREIS
- 2024-11-30 Listing Removed — WNYREIS
- 2024-09-20 Price Changed $89,900 WNYREIS
- 2024-06-28 Price Changed $99,000 WNYREIS
- 2024-05-31 Listed $115,000 WNYREIS
- 2024-05-23 Listing Removed — WNYREIS
- 2024-05-19 Relisted — WNYREIS
- 2024-05-02 Pending — WNYREIS
- 2024-02-20 Price Changed $119,900 WNYREIS
- 2024-01-03 Listed $134,900 WNYREIS
- 2023-12-27 Listing Removed — WNYREIS
- 2023-12-09 Listed $139,900 WNYREIS
- 2005-07-29 Sold (Public Records) $25,000 Public Records
Property tax history
-0.1%/yrLatest (2025): $3,484 · -0.9% YoY. Source: county tax records.
Cash-flow waterfall
monthlySold comps — $/sqft
last 12 mo · ≤1 miLoading sold comps…