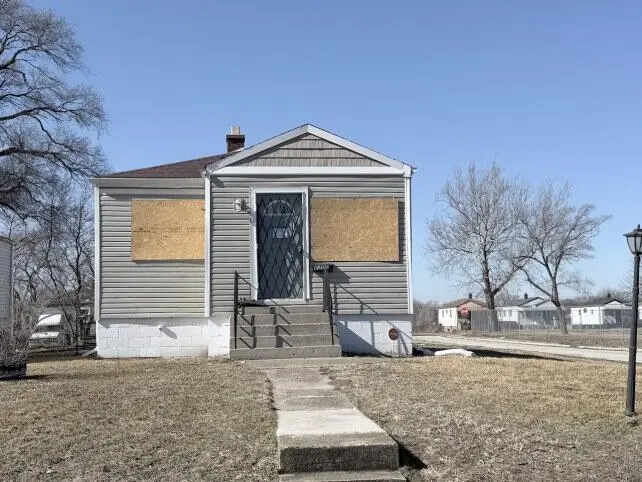
2300 Fillmore St · Gary, IN
Flood risk 1/10 · Minimal
- FEMA flood zone
- X (unshaded)
- Chance of flooding over 30 yrs
- 0.0%
- Est. flood insurance / yr
- $473 – $860
Fire risk 1/10 · Minimal
- Est. fire insurance / yr
- $717 – $1,331
Heat risk 2/10 · Minimal
- Hot days now (above 102°F)
- 7 days/yr
- Hot days in 30 yrs
- 15 days/yr
Wind risk 2/10 · Minimal
- Chance of severe wind over 30 yrs
- 0.0%
Air-quality risk 4/10 · Minor
- Unhealthy air days now
- 5 days/yr
- Unhealthy air days in 30 yrs
- 6 days/yr
Risk factors via First Street. Map © Google.
Why this score? — see what drove the B+ grade
The composite is a weighted blend of 9 inputs, each scored 0–100. Each bar is that input's sub-score; the figure is the points it added to the 100-point composite (weight × sub-score).
- Cash flow +30.0/30.0
- ARV discount +15.0/15.0
- 1% rule +10.0/10.0
- DSCR +10.0/10.0
- Appreciation +5.5/10.0
- Livability +3.7/5.0
- Rent growth +2.5/5.0
- Condition / age +2.5/5.0
- Schools +0.5/10.0
$57,500
🖨 Deal sheet (PDF) 📄 Offer letter ✓ Due diligence
Listing remarks MLS
Come see this inner-city miracle that has been completely remodeled inside and out. This home has 3 bedrooms on the main level, a remodeled bathroom and a remodeled kitchen with stainless steel appliances. It also includes a nice size living room featuring recess lighting. This remodeled home also include new windows, new sliding, and the basement also includes a wall fireplace and a custom designed wet appearance floor. The lower level also includes a 2nd bathroom with another carpeted room for maybe another bedroom. SELLER WILL PAY $1500 TOWARDS BUYER'S CLOSING EXPENSES. Call for your appointment today.
Key facts
- Eat in kitchen
- Bonus room
- Large living room
Tags
Neighborhood map
What this means for you Summary
Snapshot
- This is a 2-bed/1.5-bath single-family listed at $58k.
Deal economics
- At list price, monthly cash flow is $405 ($5k/yr) — positive.
- The deal already cash-flows at list — no discount required.
- Meets the 1% rule at list price ($1k rent vs $58k).
- Recommended offer: $57k (1.5% below list) — sets the bar for market timing.
- Cap rate 14.7% vs local median 9.1% in Gary — top-decile yield for the area; either an underpriced asset or a hidden risk that comps aren't pricing in. Stress-test before assuming the spread holds.
Location & tenants
- Location reads 73/100 on livability (#105 in IN) — a middle-class / working-renter tenant base. Strengths: commute A+, cost of living A+, housing A+; Watch: schools F, crime F, employment F.
- Gary Community School Corporation (urban): math 3% / reading 11% proficiency, ranked #299 of 301 in IN (top 99%) — low school quality limits family demand, transient renter base, plan for 1-2y turnover; 80% free/reduced lunch — lower-income household profile, screen leases tightly.
- Market conditions: 122 active listings in the ZIP; 16 comparable units currently listed for rent nearby; rentals leasing fast (median 6d on market — plan ~1-2 weeks tenant-placement turnaround); lower-income renter base — watch delinquency; 1,642 units permitted in Lake County in 2024 (14 in 5+ unit buildings).
- At $1,168/mo this rent would consume 49% of the median local household income ($29k/yr) (locally 392% of renters already pay >50% of income on rent) — very limited rent-growth headroom before tenants either downsize or default.
Forward outlook
- In year one you build about $961 of equity ($398 loan paydown + $563 appreciation (1.0% local appreciation)).
- Lake County population projected to shrink 7% by 2050 — rents likely to lag national; underwrite the cash flow, not the appreciation.
- At projected returns (1.0% appreciation + 3.0% rent growth), your $16k cash investment doubles in ~3 years — after that, you're playing with house money.
Negotiation context
- It's been on market 28 days — a 2% lower offer ($57k) is reasonable based on typical stale-listing flexibility.
- 2 sale attempts since 3y ago with the ask held roughly flat each time — persistent listings suggest the price (not the market) is what's stuck; bring a comps-based counter.
Risks & watch-outs
- Watch-outs: property tax is 4.0% of price; built in 1953 — expect roof / HVAC / electrical / plumbing capex.
Questions for the listing agent
- Built in 1953 — when were the roof, HVAC, electrical panel, plumbing, and water heater last replaced?
- Property tax is high relative to price — has the assessment been appealed recently, and will the sale trigger a re-assessment?
- Is there a deadline driving the sale (1031 exchange, divorce, estate, relocation)? That informs how much negotiation room exists.
- Schools are F-rated, which usually means shorter tenancies and higher turnover. Who's the typical renter profile here, and what's been the actual vacancy rate?
- Crime grade is F in this area — have there been break-ins, vandalism, or insurance claims at this property in the last 3 years? What carrier currently insures it and at what premium?
- What's the average days-on-market for RENTAL listings here right now (not sales)? A rising rental-DOM trend means longer vacancies and softer asking-rent achievability than the comps imply.
- What's the recent tenant-quality profile in this submarket — average credit score on applications, eviction rate, late-payment / NSF rate, and stable-employment percentage? A property-management company in the area should have these aggregated.
- How much new for-sale + rental construction is in the pipeline within 1–3 miles? Heavy new supply typically softens prices + rents 12–24 months out; constrained supply supports both.
Investment metrics
- 1% rule
- 2.03% ✓
- Cap rate
- 14.75%
- Cash-on-cash
- 30.20%
- DSCR
- 2.34
- GRM
- 4.1
CMA / ARV
- ARV (on-the-fly)
- $112,574
- Comps found
- 12
Show comp detail 12 sales within ~0.75 mi
| Address | Dist | Beds/Ba | Sqft | Sold | Price | $/sf | Match |
|---|---|---|---|---|---|---|---|
| 2370 Buchanan St | 0.15mi | 3/1.0 (+1) | 1,464 (+0%) | 13mo | $120,000 | $82 | 75 |
| 1209 W 21st Ave | 0.25mi | 3/1.0 (+1) | 1,326 (-9%) | 4mo | $55,000 | $41 | 63 |
| 2049 Monroe Ln | 0.46mi | 3/2.0 (+1) | 1,411 (-4%) | 4mo | $168,000 | $119 | 62 |
| 926 Charles Hawkins Dr | 0.43mi | 1/1.0 (-1) | 1,450 (-1%) | 13mo | $105,000 | $72 | 61 |
| 553 W 19th Ave | 0.60mi | 2/1.0 | 1,344 (-8%) | 8mo | $114,900 | $85 | 50 |
| 2374 Madison St | 0.47mi | 3/1.5 (+1) | 1,317 (-10%) | 8mo | $115,000 | $87 | 50 |
| 2701 Madison St | 0.71mi | 2/1.0 | 1,556 (+6%) | 7mo | $90,000 | $58 | 49 |
| 2691 Jackson St | 0.61mi | 3/2.0 (+1) | 1,342 (-8%) | 6mo | $103,000 | $77 | 46 |
| 2148 Cleveland St | 0.60mi | 2/1.5 | 1,248 (-15%) | 4mo | $77,600 | $62 | 44 |
| 2644 Adams St | 0.72mi | 3/2.0 (+1) | 1,412 (-3%) | 12mo | $164,000 | $116 | 44 |
| 2341 Jefferson St | 0.55mi | 2/1.0 | 1,680 (+15%) | 8mo | $17,500 | $10 | 40 |
| 1620 Tyler St | 0.67mi | 3/1.0 (+1) | 1,280 (-12%) | 9mo | $17,500 | $14 | 33 |
Match score weights: distance 35% · size 25% · config 20% · recency 20%. Top-matched comps best support the ARV.
Projected returns pro-forma
0.98% appreciation · 3.0% rent growth · sell at horizon
- IRR
- 32.6%
- Equity multiple
- 2.67×
- Total profit
- $26,915
- Equity at exit
- $19,569
- IRR
- 35.0%
- Equity multiple
- 5.21×
- Total profit
- $67,765
- Equity at exit
- $25,958
Cash invested: $16,100 (down + closing). Projections, not guarantees.
Landlord ↔ Tenant lean methodology
- Overall (STATE)
- 90 Strongly Landlord-Friendly
- State Indiana
- 90 Strongly Landlord-Friendly · R+11
- County
- — inherits STATE
- City
- — inherits STATE
ZIP-level market 46407
- Home prices YoY
- 0.4%
- Active inventory
- 122
- Price-to-rent
- 4.1×
Monthly cashflow live
- Estimated rent
- $1,168 high interval (Pro) →
- Mortgage (P&I)
- −$302
- Tax from tax record
- −$192 /mo · $2,300/yr
- Insurance
- −$24
- HOA
- −$0
- Lot rent
- −$0
- Vacancy / Maint / Mgmt
- −$245
- Net cashflow
- $405
Break-even live
Sensitivity live
| Price | -10% $438 | -5% $421 | +0% $405 | +5% $389 | +10% $373 |
|---|---|---|---|---|---|
| Rent | -10% $313 | -5% $359 | +0% $405 | +5% $451 | +10% $497 |
| Rate | -1.0pp $434 | -0.5pp $420 | base $405 | +0.5pp $390 | +1.0pp $375 |
UW: 25.0% down · 7.5% · 30yr · 1.5% tax · 5.0% vac · 8.0% maint · 8.0% mgmt
Financing live
Cash to close
- Down payment
- $14,375
- Closing costs
- $1,725
- Reserves months
- —
- Total cash needed
- —
Loan-product check · same deal, 3 products live
Conventional
25% down · 7.5% · 30yr
- Down + closing
- —
- Monthly P&I
- —
- Monthly cashflow
- —
- DSCR
- —
- Eligible?
- —
Personal DTI + credit; lowest rate.
DSCR
20% down · 8.5% · 30yr
- Down + closing
- —
- Monthly P&I
- —
- Monthly cashflow
- —
- DSCR
- —
- Eligible?
- —
No personal income docs; deal must DSCR.
Hard money
10% down · 12.0% · 12mo
- Down + closing
- —
- Monthly P&I
- —
- Monthly cashflow
- —
- DSCR
- —
- Eligible?
- —
Short-term bridge; refi at stabilization.
Rent comps 16 comps
| Address | Beds | Baths | Sqft | Rent | $/sqft | DOM | Units | Dist |
|---|---|---|---|---|---|---|---|---|
| 840 W 19th Ave Gary, IN | 2.0 | 1.0 | 1035 | $1,150 | $1.11 | 22d | 1 | 0.52mi |
| 1572 Polk St Gary, IN | 3.0 | 1.0 | 1500 | $1,250 | $0.83 | 0d | 1 | 0.65mi |
| 2022 Massachusetts St Gary, IN | 2.0 | 1.0 | 965 | $975 | $1.01 | 0d | 1 | 0.80mi |
| 2300 Maryland St Gary, IN | 2.0 | 1.0 | 900 | $1,000 | $1.11 | 22d | 1 | 0.97mi |
| 2061 Maryland St Gary, IN | 2.0 | 1.0 | 975 | $950 | $0.97 | 46d | 1 | 1.04mi |
| 2315 Industrial Blvd Gary, IN | 2.0 | 1.0 | 989 | $950 | $0.96 | 6d | 1 | 1.08mi |
| 2315 Industrial Blvd Gary, IN | 2.0 | 1.0 | 989 | $950 | $0.96 | 0d | 1 | 1.08mi |
| 2315 Industrial Blvd Unit B Gary, IN | 3.0 | 1.0 | 989 | $1,150 | $1.16 | 0d | 1 | 1.08mi |
| 2157 Marshall Pl Gary, IN | 3.0 | 1.5 | 1650 | $1,295 | $0.78 | 46d | 1 | 1.13mi |
| 2425 Prospect St Gary, IN | 3.0 | 1.0 | 1051 | $1,400 | $1.33 | 0d | 1 | 1.14mi |
| 1329 Delaware St Gary, IN | 2.0 | 1.0 | 1100 | $1,100 | $1.00 | 46d | 1 | 1.26mi |
| 2306 Vermont St Gary, IN | 3.0 | 1.5 | 1200 | $1,300 | $1.08 | 0d | 1 | 1.29mi |
| 762 Harrison St Unit SRO Gary, IN | 1.0 | 1.0 | 1075 | $700 | $0.65 | 0d | 1 | 1.38mi |
| 1531 Taney Pl Gary, IN | 2.0 | 1.0 | 900 | $1,045 | $1.16 | 3d | 1 | 1.44mi |
| 765 Garfield St Gary, IN | 3.0 | 1.0 | 1688 | $1,500 | $0.89 | 16d | 1 | 1.45mi |
| 3449 Buchanan St Gary, IN | 3.0 | 1.0 | 1301 | $1,395 | $1.07 | 46d | 1 | 1.45mi |
Listing history 15 events
-
2026-06-10status $57,500 Pending 28 DOM
-
2026-06-09days on market $57,500 Active 28 DOM
-
2026-06-08days on market $57,500 Active 27 DOM
-
2026-06-07days on market $57,500 Active 26 DOM
-
2026-06-04days on market $57,500 Active 23 DOM
-
2026-06-03days on market $57,500 Active 22 DOM
-
2026-06-02days on market $57,500 Active 21 DOM
-
2026-06-01days on market $57,500 Active 20 DOM
-
2026-05-31days on market $57,500 Active 19 DOM
-
2026-03-31status Pending
-
2026-03-16$57,500 Active
-
2024-04-19soldstatus $130,000 Closed 612-char remark
Show marketing remark (612 chars)
Come see this inner-city miracle that has been completely remodeled inside and out. This home has 3 bedrooms on the main level, a remodeled bathroom and a remodeled kitchen with stainless steel appliances. It also includes a nice size living room featuring recess lighting. This remodeled home also include new windows, new sliding, and the basement also includes a wall fireplace and a custom designed wet appearance floor. The lower level also includes a 2nd bathroom with another carpeted room for maybe another bedroom. SELLER WILL PAY $1500 TOWARDS BUYER'S CLOSING EXPENSES. Call for your appointment today.
-
2024-04-06status Pending 612-char remark
Show marketing remark (612 chars)
Come see this inner-city miracle that has been completely remodeled inside and out. This home has 3 bedrooms on the main level, a remodeled bathroom and a remodeled kitchen with stainless steel appliances. It also includes a nice size living room featuring recess lighting. This remodeled home also include new windows, new sliding, and the basement also includes a wall fireplace and a custom designed wet appearance floor. The lower level also includes a 2nd bathroom with another carpeted room for maybe another bedroom. SELLER WILL PAY $1500 TOWARDS BUYER'S CLOSING EXPENSES. Call for your appointment today.
-
2023-09-29price $129,000 612-char remark
Show marketing remark (612 chars)
Come see this inner-city miracle that has been completely remodeled inside and out. This home has 3 bedrooms on the main level, a remodeled bathroom and a remodeled kitchen with stainless steel appliances. It also includes a nice size living room featuring recess lighting. This remodeled home also include new windows, new sliding, and the basement also includes a wall fireplace and a custom designed wet appearance floor. The lower level also includes a 2nd bathroom with another carpeted room for maybe another bedroom. SELLER WILL PAY $1500 TOWARDS BUYER'S CLOSING EXPENSES. Call for your appointment today.
-
2023-07-17$139,500 Active 612-char remark
Show marketing remark (612 chars)
Come see this inner-city miracle that has been completely remodeled inside and out. This home has 3 bedrooms on the main level, a remodeled bathroom and a remodeled kitchen with stainless steel appliances. It also includes a nice size living room featuring recess lighting. This remodeled home also include new windows, new sliding, and the basement also includes a wall fireplace and a custom designed wet appearance floor. The lower level also includes a 2nd bathroom with another carpeted room for maybe another bedroom. SELLER WILL PAY $1500 TOWARDS BUYER'S CLOSING EXPENSES. Call for your appointment today.
ⓘ Source: listings_history table (triggers on properties + properties_extension) + one-shot
backfill from property_details.listing_events for pre-trigger history.
Tax reassessment forecast IN · Partial reset (capped growth)
- Current annual tax
- $2,300 · $192/mo
- Projected year-2 tax
- $2,300 · $192/mo
- Expected delta
- $0/yr ($0/mo · 0.0%)
ⓘ Screening estimate from a state-policy table — verify with the county assessor before closing.
Climate risk First Street
- Flood 1/10 Low FEMA zone X (unshaded) · 0% chance over 30 yrs
- Wildfire 1/10 Low
- Heat 2/10 Low 7 d/yr ≥102°F today · 15 d/yr by 30 yrs out
- Wind 2/10 Low 0% chance of damaging wind over 30 yrs
- Air quality 4/10 Moderate 5 unhealthy d/yr today · 6 by 30 yrs out
Nearby sold comps map
Loading sold comps map…
Walkable amenities ~0.75 mi
Loading nearby amenities…
Taxation est. · year 1
- Rental income
- $14,010
- − Mortgage interest
- −$3,221
- − Property taxes
- −$2,300
- − Insurance
- −$288
- − Repairs & maintenance
- −$1,121
- − Management
- −$1,121
- − Depreciation
- −$1,673
- Taxable income
- $4,287
- Est. tax owed @ 24.0%
- −$1,029
- After-tax cash flow
- $3,833/yr
For passive investors: Depreciation is non-cash, so a rental often shows a tax loss while cash-flowing — sheltering income. Rental losses are passive: they offset passive income freely, and up to $25,000/yr can offset ordinary (W-2) income if you actively participate and your MAGI is under $100k (phasing out to $0 by $150k); unused losses carry forward. On sale, claimed depreciation is recaptured at up to 25%, and gains may owe capital-gains tax (a 1031 exchange can defer both). Figures are a year-1 estimate at your 24.0% rate — not tax advice; consult a CPA.
Schools (NCES district)
- District
- Gary Community School Corporation
- NCES district ID
- 1803870
- Math proficiency
- 3% ▼ -10.00%
- Reading proficiency
- 11% ▼ -6.00%
- Median HH income
- $27,739
- Composite
- 4.98/100
- National rank
- #10039
- State rank
- #299 of 301 in IN
Livability — Gary
- Score
- 73/100
- State rank
- #105
- US rank
- #5592
Category grades
Schools grade is shown separately in the Schools card above.
Census & demographics
- Census place
- Gary, IN
- County
- Lake County · 422,878 people
- City population
- 63,701
- Metro
- Chicago-Naperville-Elgin, IL-IN-WI
- Population (ZIP)
- 8,577
- Household income
- $28,526
- Rent vs Own
- Severe rent burden
- 392.0
Population outlook (Lake County) Hauer SSP2
- Today (2025)
- 484,026 people
- By 2030
- 478,091 · -1.2%
- By 2040
- 462,974 · -4.3%
- By 2050
- 449,894 · -7.1%
- By 2075
- 436,169 · -9.9%
- By 2100
- 426,607 · -11.9%
Race, ethnicity, and origin ACS 2023
- Neighborhood character
- Predominantly Black (91%)
- Race & ethnicity
- Black 91% Hispanic / Latino 3% White 2% Two or more races 1%
- Common ancestry
- Romanian 1%
- Foreign-born
- 1% · Canada
- Languages at home
- 97% English-only · Spanish 1% Russian/Polish/Slavic 1% French/Haitian/Cajun 1%
Political lean MEDSL · Lake
- 2024 margin
- Lean D (+5.6) · D 52.1% · R 46.5% · Other 1.5%
- 2008→2024 swing
- -28.6pp toward R · 2008: 34.3pp · 2024: 5.6pp
- All cycles
- 2024: D+5.6 2020: D+15.1 2016: D+20.6 2012: D+31.0 2008: D+34.3
Not yet ingested
- Civics
- —
Market trends
- HPI YoY
- ▲ 0.98%
- Current HPI
- 253.2856
- Rent YoY
- —
- Metro
- Chicago-Naperville-Elgin, IL-IN-WI
- State GDP YoY
- ▲ 2.90%
- F500 in state
- 18
Industry mix (Fortune 500 HQ in IN)
| Industry | F500 HQs | Revenue |
|---|---|---|
| Industrial Machinery | 2 | $37B |
|
||
| Healthcare | 1 | $177B |
|
||
| Pharmaceuticals | 1 | $45B |
|
||
| Metals / Steel | 1 | $18B |
|
||
| Agriculture | 1 | $17B |
|
||
| Packaging | 1 | $12B |
|
||
Price history
-58.8% since first listed6 events — show timeline
- 2026-03-31 Pending — NIRA MLS as Distributed by MLS Grid
- 2026-03-16 Listed $57,500 NIRA MLS as Distributed by MLS Grid
- 2024-04-19 Sold (MLS) $130,000 NIRA MLS as Distributed by MLS Grid
- 2024-04-06 Pending — NIRA MLS as Distributed by MLS Grid
- 2023-09-29 Price Changed $129,000 NIRA MLS as Distributed by MLS Grid
- 2023-07-17 Listed $139,500 NIRA MLS as Distributed by MLS Grid
Property tax history
+0.4%/yrLatest (2024): $2,300 · +973.1% YoY. Source: county tax records.
Cash-flow waterfall
monthlySold comps — $/sqft
last 12 mo · ≤1 miLoading sold comps…