6749 Ellis Rd · Berrydale, FL
Flood risk 4/10 · Minor
- FEMA flood zone
- X (unshaded)
- Chance of flooding over 30 yrs
- 0.24%
- Est. flood insurance / yr
- $507 – $1,088
Fire risk 6/10 · Moderate
- Est. fire insurance / yr
- $947 – $1,759
Heat risk 8/10 · Major
- Hot days now (above 106°F)
- 7 days/yr
- Hot days in 30 yrs
- 20 days/yr
Wind risk 9/10 · Severe
- Chance of severe wind over 30 yrs
- 99.0%
Air-quality risk 2/10 · Minimal
- Unhealthy air days now
- 1 days/yr
- Unhealthy air days in 30 yrs
- 1 days/yr
Risk factors via First Street. Map © Google.
Why this score? — see what drove the C grade
The composite is a weighted blend of 9 inputs, each scored 0–100. Each bar is that input's sub-score; the figure is the points it added to the 100-point composite (weight × sub-score).
- Cash flow +16.7/30.0
- Appreciation +10.0/10.0
- ARV discount +7.5/15.0
- Schools +5.3/10.0
- DSCR +5.2/10.0
- 1% rule +4.2/10.0
- Rent growth +2.5/5.0
- Condition / age +2.5/5.0
- Livability +2.0/5.0
$110,000
🖨 Deal sheet (PDF) 📄 Offer letter ✓ Due diligence
Listing remarks MLS
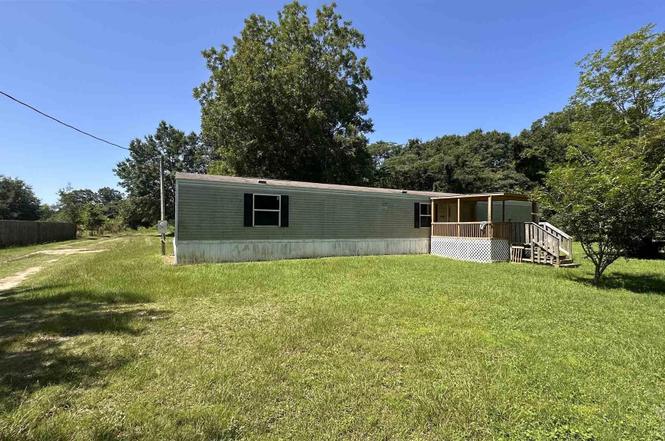
Beautiful property for those who want the perfect place to get away from the hustle and bustle of the city. Zoned AG-RR. Corn being farmed in rear of property.
Key facts
- Outdoor entertaining
- Spacious lot
- Private bathroom
Tags
Property features AI
Finance
- Other: Approximately 1 acre lot
- HOA & community: No association
Exterior
- Parking: Driveway with open parking
- Utilities: Circuit breakers and copper wiring; Septic tank; Paved road access (county maintained)
- Home design: Mobile/Manufactured or modular home; One story
- Construction: Off-grade foundation; Composition roof
- Exterior features: Covered deck; Does not allow horses; Central access to the lot
Interior
- Kitchen: Electric water heater
- Bedrooms: Master bedroom on the first floor, approximately 13.5' x 12.5'; Second bedroom on the first floor, approximately 13' x 10'; Third bedroom on the first floor, approximately 10' x 10'
- Flooring: Carpet; Simulated wood
- Bathrooms: Two full bathrooms
- Heating & cooling: Central heating; Central air conditioning
- Interior features: Carpet and simulated wood flooring; Eat-in kitchen
Neighborhood map
What this means for you Summary
Snapshot
- This is a 2-bed/2.0-bath manufactured listed at $110k.
Deal economics
- At list price, monthly cash flow is $69 ($832/yr) — positive.
- The deal already cash-flows at list — no discount required.
- To meet the 1% rule (rent ≥ 1% of price), the offer needs to be $102k (7.6% below list).
- Recommended offer: $97k (12.0% below list) — sets the bar for market timing.
Location & tenants
- Location reads 40/100 on livability (#910 in FL) — a working-class tenant base; expect higher turnover. Strengths: cost of living A+, crime A; Watch: schools F, amenities F, commute F.
- Santa Rosa (suburban): math 63% / reading 60% proficiency, ranked #8 of 73 in FL (top 11%) — acceptable for families but not a draw, mixed tenant base, ~2y average lease.
- Market conditions: 129 active listings in the ZIP; 1,983 units permitted in Santa Rosa County in 2024 (128 in 5+ unit buildings).
Forward outlook
- In year one you build about $12k of equity ($761 loan paydown + $11k appreciation (10.0% local appreciation)).
- Santa Rosa County population projected at +31% by 2050 — long-run rental-demand tailwind backs the buy-and-hold thesis.
- At projected returns (10.0% appreciation + 3.0% rent growth), your $31k cash investment doubles in ~3 years — after that, you're playing with house money.
- By year 4, paydown + projected appreciation supports a ~$42k cash-out refi (75% LTV) — recoverable capital for the next deal without selling this one.
Negotiation context
- It's been on market 307 days — a 12% lower offer ($97k) is reasonable based on typical stale-listing flexibility.
- 2 sale attempts since 8y ago; this cycle's ask has dropped $20k (15%) from the opening price — seller is motivated, your offer sets the floor, not the list.
- Current owner paid $90k; 22% above their basis — modest negotiation headroom, anchor on the comps not their cost.
Risks & watch-outs
- Climate carrying-cost: severe wind risk, 99% chance of damaging wind over 30y; major wildfire risk; extreme-heat days projected 7→20/yr by 2055 (HVAC capex compounding) — expect insurance premiums to compound above CPI over the hold.
Questions for the listing agent
- It's been on market 307 days. Have you received any prior offers? Is the seller open to a 12% concession, seller financing, or rate buy-down credit?
- Why hasn't it sold? Are there any deal-killer items the seller is aware of (foundation, flood, title, zoning, code violations)?
- Is there a deadline driving the sale (1031 exchange, divorce, estate, relocation)? That informs how much negotiation room exists.
- Schools are F-rated, which usually means shorter tenancies and higher turnover. Who's the typical renter profile here, and what's been the actual vacancy rate?
- What's the average days-on-market for RENTAL listings here right now (not sales)? A rising rental-DOM trend means longer vacancies and softer asking-rent achievability than the comps imply.
- What's the recent tenant-quality profile in this submarket — average credit score on applications, eviction rate, late-payment / NSF rate, and stable-employment percentage? A property-management company in the area should have these aggregated.
- How much new for-sale + rental construction is in the pipeline within 1–3 miles? Heavy new supply typically softens prices + rents 12–24 months out; constrained supply supports both.
Investment metrics
- 1% rule
- 0.92% ✗
- Cap rate
- 7.05%
- Cash-on-cash
- 2.70%
- DSCR
- 1.12
- GRM
- 9.0
CMA / ARV
No comps found within radius.
Projected returns pro-forma
10.0% appreciation · 3.0% rent growth · sell at horizon
- IRR
- 26.2%
- Equity multiple
- 3.09×
- Total profit
- $64,323
- Equity at exit
- $99,097
- IRR
- 23.0%
- Equity multiple
- 7.04×
- Total profit
- $185,945
- Equity at exit
- $213,706
Cash invested: $30,800 (down + closing). Projections, not guarantees.
Landlord ↔ Tenant lean methodology
- Overall (STATE)
- 87 Strongly Landlord-Friendly
- State Florida
- 87 Strongly Landlord-Friendly · R+3
- County
- — inherits STATE
- City
- — inherits STATE
ZIP-level market 32565
- Home prices YoY
- 11.4%
- Active inventory
- 129
- Price-to-rent
- 9.0×
Monthly cashflow live
- Estimated rent
- $1,016 medium interval (Pro) →
- Mortgage (P&I)
- −$577
- Tax from tax record
- −$111 /mo · $1,328/yr
- Insurance
- −$46
- HOA
- −$0
- Vacancy / Maint / Mgmt
- −$213
- Net cashflow
- $69
Break-even live
Sensitivity live
| Price | -10% $132 | -5% $100 | +0% $69 | +5% $38 | +10% $7 |
|---|---|---|---|---|---|
| Rent | -10% $-11 | -5% $29 | +0% $69 | +5% $109 | +10% $150 |
| Rate | -1.0pp $125 | -0.5pp $97 | base $69 | +0.5pp $41 | +1.0pp $12 |
UW: 25.0% down · 7.5% · 30yr · 1.5% tax · 5.0% vac · 8.0% maint · 8.0% mgmt
Financing live
Cash to close
- Down payment
- $27,500
- Closing costs
- $3,300
- Reserves months
- —
- Total cash needed
- —
Loan-product check · same deal, 3 products live
Conventional
25% down · 7.5% · 30yr
- Down + closing
- —
- Monthly P&I
- —
- Monthly cashflow
- —
- DSCR
- —
- Eligible?
- —
Personal DTI + credit; lowest rate.
DSCR
20% down · 8.5% · 30yr
- Down + closing
- —
- Monthly P&I
- —
- Monthly cashflow
- —
- DSCR
- —
- Eligible?
- —
No personal income docs; deal must DSCR.
Hard money
10% down · 12.0% · 12mo
- Down + closing
- —
- Monthly P&I
- —
- Monthly cashflow
- —
- DSCR
- —
- Eligible?
- —
Short-term bridge; refi at stabilization.
Listing history 21 events
-
2026-06-18days on market $110,000 Active 307 DOM
-
2026-06-17days on market $110,000 Active 306 DOM
-
2026-06-16days on market $110,000 Active 305 DOM
-
2026-06-15days on market $110,000 Active 304 DOM
-
2026-06-14days on market $110,000 Active 302 DOM
-
2026-06-10days on market $110,000 Active 299 DOM
-
2026-06-09days on market $110,000 Active 298 DOM
-
2026-06-08days on market $110,000 Active 297 DOM
-
2026-06-07days on market $110,000 Active 296 DOM
-
2026-06-05days on market $110,000 Active 293 DOM
-
2026-06-03days on market $110,000 Active 292 DOM
-
2026-06-02days on market $110,000 Active 291 DOM
-
2026-06-01days on market $110,000 Active 290 DOM
-
2026-05-31days on market $110,000 Active 289 DOM
-
2026-05-31days on market $110,000 Active 288 DOM
-
2026-02-06price $120,000
-
2025-08-15$130,000 Active
-
2024-07-23soldstatus $90,000
-
2018-10-30soldstatus $31,000 161-char remark
Show marketing remark (161 chars)
Beautiful property for those who want the perfect place to get away from the hustle and bustle of the city. Zoned AG-RR. Corn being farmed in rear of property.
-
2018-07-29$31,000 161-char remark
Show marketing remark (161 chars)
Beautiful property for those who want the perfect place to get away from the hustle and bustle of the city. Zoned AG-RR. Corn being farmed in rear of property.
-
2015-10-16soldstatus $9,000
ⓘ Source: listings_history table (triggers on properties + properties_extension) + one-shot
backfill from property_details.listing_events for pre-trigger history.
Tax reassessment forecast FL · Resets to sale price
- Current annual tax
- $1,328 · $111/mo
- Projected year-2 tax
- $1,328 · $111/mo
- Expected delta
- $0/yr ($0/mo · 0.0%)
ⓘ Screening estimate from a state-policy table — verify with the county assessor before closing.
Climate risk First Street
- Flood 4/10 Moderate FEMA zone X (unshaded) · 24% chance over 30 yrs
- Wildfire 6/10 Major
- Heat 8/10 Severe 7 d/yr ≥106°F today · 20 d/yr by 30 yrs out
- Wind 9/10 Extreme 99% chance of damaging wind over 30 yrs
- Air quality 2/10 Low 1 unhealthy d/yr today · 1 by 30 yrs out
Nearby sold comps map
Loading sold comps map…
Walkable amenities ~0.75 mi
Loading nearby amenities…
Taxation est. · year 1
- Rental income
- $12,193
- − Mortgage interest
- −$6,162
- − Property taxes
- −$1,328
- − Insurance
- −$550
- − Repairs & maintenance
- −$975
- − Management
- −$975
- − Depreciation
- −$3,200
- Taxable loss
- −$998
- Est. tax savings @ 24.0%
- +$240
- After-tax cash flow
- $1,071/yr
For passive investors: Depreciation is non-cash, so a rental often shows a tax loss while cash-flowing — sheltering income. Rental losses are passive: they offset passive income freely, and up to $25,000/yr can offset ordinary (W-2) income if you actively participate and your MAGI is under $100k (phasing out to $0 by $150k); unused losses carry forward. On sale, claimed depreciation is recaptured at up to 25%, and gains may owe capital-gains tax (a 1031 exchange can defer both). Figures are a year-1 estimate at your 24.0% rate — not tax advice; consult a CPA.
Schools (NCES district)
- District
- Santa Rosa
- NCES district ID
- 1201650
- Math proficiency
- 63% ▼ -6.00%
- Reading proficiency
- 60% ▼ -5.00%
- Median HH income
- $58,161
- Composite
- 53.12/100
- National rank
- #1511
- State rank
- #8 of 73 in FL
Livability — Berrydale
- Score
- 40/100
- State rank
- #910
- US rank
- #27337
Category grades
Schools grade is shown separately in the Schools card above.
Census & demographics
- Census place
- Berrydale, FL
- Population (ZIP)
- 5,653
Population outlook (Santa Rosa County) Hauer SSP2
- Today (2025)
- 195,978 people
- By 2030
- 209,782 · +7.0%
- By 2040
- 235,293 · +20.1%
- By 2050
- 256,408 · +30.8%
- By 2075
- 298,074 · +52.1%
- By 2100
- 303,216 · +54.7%
Race, ethnicity, and origin ACS 2023
- Neighborhood character
- Predominantly White (91%)
- Race & ethnicity
- White 91% Asian 5% Two or more races 3%
- Common ancestry
- Slovak 3% Lithuanian 2% Serbian 1%
- Foreign-born
- 3% · China, Vietnam
- Languages at home
- 94% English-only · Chinese 4% Spanish 1% Tagalog/Filipino 1%
Political lean MEDSL · Santa Rosa
- 2024 margin
- Solid R (+51.0) · D 24.1% · R 75.0%
- 2008→2024 swing
- -3.0pp toward R · 2008: -47.9pp · 2024: -51.0pp
- All cycles
- 2024: R+51.0 2020: R+46.5 2016: R+53.5 2012: R+52.6 2008: R+47.9
Not yet ingested
- Civics
- —
Market trends
- HPI YoY
- ▲ 33.17%
- Current HPI
- 324.7547
- Rent YoY
- —
- Metro
- —
- State GDP YoY
- ▲ 3.28%
- F500 in state
- 36
Industry mix (Fortune 500 HQ in FL)
| Industry | F500 HQs | Revenue |
|---|---|---|
| Industrial Technology | 2 | $29B |
|
||
| Insurance | 2 | $17B |
|
||
| Retail | 1 | $60B |
|
||
| Technology Distribution | 1 | $58B |
|
||
| Homebuilding | 1 | $35B |
|
||
| Technology Manufacturing | 1 | $35B |
|
||
Price history
+1233.3% since first listed6 events — show timeline
- 2026-02-06 Price Changed $120,000 PARMLS
- 2025-08-15 Listed $130,000 PARMLS
- 2024-07-23 Sold (Public Records) $90,000 Public Records
- 2018-10-30 Sold (MLS) $31,000 PARMLS
- 2018-07-29 Listed $31,000 PARMLS
- 2015-10-16 Sold (Public Records) $9,000 Public Records
Property tax history
+22.1%/yrLatest (2025): $1,328 · +11.3% YoY. Source: county tax records.
Cash-flow waterfall
monthlySold comps — $/sqft
last 12 mo · ≤1 miLoading sold comps…