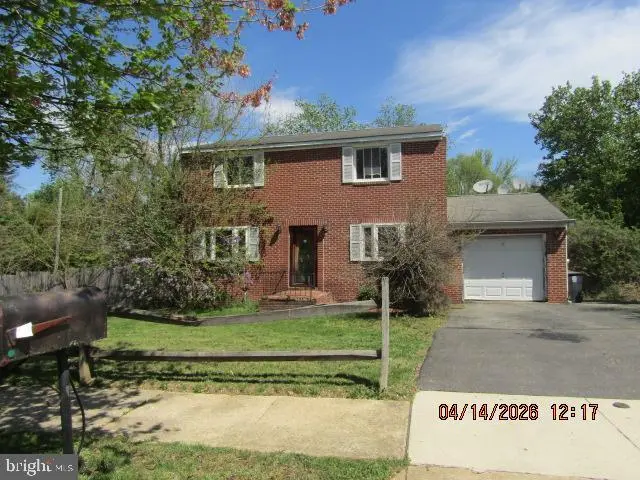
4700 Megan Dr · Clinton, MD
Flood risk 6/10 · Moderate
- FEMA flood zone
- X (unshaded)
- Chance of flooding over 30 yrs
- 0.73%
- Est. flood insurance / yr
- $473 – $860
Fire risk 3/10 · Minor
- Est. fire insurance / yr
- $755 – $1,403
Heat risk 7/10 · Major
- Hot days now (above 104°F)
- 7 days/yr
- Hot days in 30 yrs
- 16 days/yr
Wind risk 4/10 · Minor
- Chance of severe wind over 30 yrs
- 23.0%
Air-quality risk 3/10 · Minor
- Unhealthy air days now
- 2 days/yr
- Unhealthy air days in 30 yrs
- 3 days/yr
Risk factors via First Street. Map © Google.
Why this score? — see what drove the D grade
The composite is a weighted blend of 9 inputs, each scored 0–100. Each bar is that input's sub-score; the figure is the points it added to the 100-point composite (weight × sub-score).
- Cash flow +13.4/30.0
- ARV discount +9.3/15.0
- DSCR +4.0/10.0
- 1% rule +3.4/10.0
- Livability +3.2/5.0
- Rent growth +2.5/5.0
- Condition / age +2.5/5.0
- Schools +1.7/10.0
- Appreciation +0.0/10.0
$405,600
🖨 Deal sheet 📄 Offer letter ✓ Due diligence
Listing remarks MLS
This is a Bank owned property NOT a short sale Being sold in as condition Offers may be submitted anytime will NOT be reviewed until 5-5-26
Key facts
- 0.34 acre lot
- Garage
- Pool
Neighborhood map
What this means for you Summary
Snapshot
- This is a 4-bed/1.5-bath single-family listed at $406k.
Deal economics
- At list price, monthly cash flow is $10 ($117/yr) — positive.
- The deal already cash-flows at list — no discount required.
- To meet the 1% rule (rent ≥ 1% of price), the offer needs to be $342k (15.6% below list).
- Recommended offer: $342k (15.6% below list) — sets the bar for 1% rule.
Location & tenants
- Location reads 63/100 on livability (#304 in MD) — a middle-class / working-renter tenant base. Strengths: employment A+, housing A+; Watch: crime D+, schools D-, amenities F.
- Prince George'S County Public Schools (suburban): math 8% / reading 24% proficiency, ranked #21 of 24 in MD (top 88%) — low school quality limits family demand, transient renter base, plan for 1-2y turnover.
- Market conditions: 121 active listings in the ZIP; 5 comparable units currently listed for rent nearby; rentals at typical pace (median 24d on market — plan ~3-4 weeks tenant-placement turnaround); high-income renter base; 1,481 units permitted in Prince George's County in 2024 (0 in 5+ unit buildings).
- This rent runs 33% of the median local income ($126k/yr) — at the standard rent-burdened threshold; future hikes will face affordability resistance.
Forward outlook
- Local home prices are declining (-3.0%/yr); year-one equity from $3k of loan paydown is wiped out by about $12k of value loss. Plan a longer hold.
- Prince George's County population projected at +18% by 2050 — long-run rental-demand tailwind backs the buy-and-hold thesis.
Negotiation context
- It's been on market 63 days — a 6% lower offer ($381k) is reasonable based on typical stale-listing flexibility.
- Current owner paid $140k; list at $406k implies a 190% gain — meaningful room to come down on a strong offer.
Risks & watch-outs
- Climate carrying-cost: major flood risk; extreme-heat days projected 7→16/yr by 2055 (HVAC capex compounding) — expect insurance premiums to compound above CPI over the hold.
Questions for the listing agent
- It's been on market 63 days. Have you received any prior offers? Is the seller open to a 16% concession, seller financing, or rate buy-down credit?
- Built in 1978 — when were the roof, HVAC, electrical panel, plumbing, and water heater last replaced?
- Why hasn't it sold? Are there any deal-killer items the seller is aware of (foundation, flood, title, zoning, code violations)?
- Is there a deadline driving the sale (1031 exchange, divorce, estate, relocation)? That informs how much negotiation room exists.
- Schools are D-rated, which usually means shorter tenancies and higher turnover. Who's the typical renter profile here, and what's been the actual vacancy rate?
- Crime grade is D in this area — have there been break-ins, vandalism, or insurance claims at this property in the last 3 years? What carrier currently insures it and at what premium?
- The area grade is low — what's the realistic commute time and amenity access for the typical tenant pool here? Any planned neighborhood developments (good or bad) we should know about?
- What's the average days-on-market for RENTAL listings here right now (not sales)? A rising rental-DOM trend means longer vacancies and softer asking-rent achievability than the comps imply.
- What's the recent tenant-quality profile in this submarket — average credit score on applications, eviction rate, late-payment / NSF rate, and stable-employment percentage? A property-management company in the area should have these aggregated.
- How much new for-sale + rental construction is in the pipeline within 1–3 miles? Heavy new supply typically softens prices + rents 12–24 months out; constrained supply supports both.
Investment metrics
- 1% rule
- 0.84% ✗
- Cap rate
- 6.32%
- Cash-on-cash
- 0.10%
- DSCR
- 1.00
- GRM
- 9.9
CMA / ARV
- ARV (median comp)
- $422,594
- List price
- $405,600
- Delta
- -4.02%
- Verdict
- FAIR
- Comps
- 20 within 1.0 mi
Show comp detail 11 sales within ~0.75 mi
| Address | Dist | Beds/Ba | Sqft | Sold | Price | $/sf | Match |
|---|---|---|---|---|---|---|---|
| 8601 Temple Hills Rd #5 | 0.17mi | 3/2.0 (-1) | 1,560 (0%) | 4mo | $85,000 | $54 | 82 |
| 4803 Catherine Ct | 0.24mi | 3/1.5 (-1) | 1,568 (+0%) | 9mo | $450,000 | $287 | 76 |
| 5210 Vienna Dr | 0.58mi | 3/2.5 (-1) | 1,556 (-0%) | 1mo | $415,000 | $267 | 63 |
| 5105 Vienna Dr | 0.54mi | 4/2.0 | 1,532 (-2%) | 9mo | $405,000 | $264 | 62 |
| 8400 Temple Hill Rd | 0.17mi | 3/2.0 (-1) | 1,753 (+12%) | 3mo | $350,000 | $200 | 62 |
| 8710 Jeremy Ct | 0.42mi | 4/3.0 | 1,556 (-0%) | 21mo | $437,500 | $281 | 57 |
| 8601 Temple Hill Rd Lot 69 | 0.17mi | 3/2.0 (-1) | 1,344 (-14%) | 12mo | $96,000 | $71 | 52 |
| 5314 Vienna Dr | 0.67mi | 3/2.0 (-1) | 1,564 (+0%) | 13mo | $400,000 | $256 | 50 |
| 4900 Salima St | 0.72mi | 3/2.5 (-1) | 1,512 (-3%) | 23mo | $420,000 | $278 | 33 |
| 4432 Natahala Dr | 0.55mi | 4/3.0 | 1,368 (-12%) | 18mo | $480,000 | $351 | 33 |
| 5400 San Juan Dr | 0.68mi | 4/2.0 | 1,793 (+15%) | 12mo | $429,000 | $239 | 32 |
Match score weights: distance 35% · size 25% · config 20% · recency 20%. Top-matched comps best support the ARV.
Projected returns pro-forma
-3.0% appreciation · 3.0% rent growth · sell at horizon
- IRR
- -16.2%
- Equity multiple
- 0.43×
- Total profit
- $-65,121
- Equity at exit
- $60,476
- IRR
- -7.8%
- Equity multiple
- 0.51×
- Total profit
- $-55,969
- Equity at exit
- $35,069
Cash invested: $113,568 (down + closing). Projections, not guarantees.
Landlord ↔ Tenant lean methodology
- Overall (STATE)
- 27 Tenant-Leaning
- State Maryland
- 27 Tenant-Leaning · D+14
- County
- — inherits STATE
- City
- — inherits STATE
ZIP-level market 20735
- Active inventory
- 121
- Price-to-rent
- 9.9×
Monthly cashflow live
- Estimated rent
- $3,424 high interval (Pro) →
- Mortgage (P&I)
- −$2,127
- Tax from tax record
- −$399 /mo · $4,792/yr
- Insurance
- −$169
- HOA
- −$0
- Vacancy / Maint / Mgmt
- −$719
- Net cashflow
- $10
Break-even live
UW: 25.0% down · 7.5% · 30yr · 1.5% tax · 5.0% vac · 8.0% maint · 8.0% mgmt
Financing live
Cash to close
- Down payment
- $101,400
- Closing costs
- $12,168
- Reserves months
- —
- Total cash needed
- —
Loan-product check · same deal, 3 products live
Conventional
25% down · 7.5% · 30yr
- Down + closing
- —
- Monthly P&I
- —
- Monthly cashflow
- —
- DSCR
- —
- Eligible?
- —
Personal DTI + credit; lowest rate.
DSCR
20% down · 8.5% · 30yr
- Down + closing
- —
- Monthly P&I
- —
- Monthly cashflow
- —
- DSCR
- —
- Eligible?
- —
No personal income docs; deal must DSCR.
Hard money
10% down · 12.0% · 12mo
- Down + closing
- —
- Monthly P&I
- —
- Monthly cashflow
- —
- DSCR
- —
- Eligible?
- —
Short-term bridge; refi at stabilization.
Rent comps 5 comps
| Address | Beds | Baths | Sqft | Rent | $/sqft | DOM | Units | Dist |
|---|---|---|---|---|---|---|---|---|
| 5508 Spruce Dr Clinton, MD | 3.0 | 1.5 | 1125 | $2,800 | $2.49 | 43d | 1 | 0.96mi |
| 7209 Loch Raven Rd Temple Hills, MD | 5.0 | 2.0 | 1100 | $3,200 | $2.91 | 3d | 1 | 1.11mi |
| 5502 Trout Run Rd Clinton, MD | 3.0 | 2.5 | 1344 | $2,795 | $2.08 | 18d | 1 | 1.12mi |
| 6007 Bradley Ln Clinton, MD | 5.0 | 2.0 | 1248 | $2,950 | $2.36 | 24d | 1 | 1.25mi |
| 8007 Prince Georges Dr Fort Washington, MD | 5.0 | 3.0 | 1144 | $3,900 | $3.41 | 24d | 1 | 1.45mi |
Listing history 16 events
-
2026-06-18days on market $405,600 Active 63 DOM
-
2026-06-17days on market $405,600 Active 62 DOM
-
2026-06-16days on market $405,600 Active 61 DOM
-
2026-06-15days on market $405,600 Active 60 DOM
-
2026-06-13days on market $405,600 Active 58 DOM
-
2026-06-10days on market $405,600 Active 54 DOM
-
2026-06-08days on market $405,600 Active 53 DOM
-
2026-06-07days on market $405,600 Active 52 DOM
-
2026-06-04days on market $405,600 Active 49 DOM
-
2026-06-03days on market $405,600 Active 48 DOM
-
2026-06-02days on market $405,600 Active 47 DOM
-
2026-06-01days on market $405,600 Active 46 DOM
-
2026-05-31days on market $405,600 Active 45 DOM
-
2026-04-16$405,600 Active 142-char remark
Show marketing remark (142 chars)
This is a Bank owned property NOT a short sale Being sold in as condition Offers may be submitted anytime will NOT be reviewed until 5-5-26
-
1989-05-01soldstatus $140,000
-
1989-05-01soldstatus $140,000
ⓘ Source: listings_history table (triggers on properties + properties_extension) + one-shot
backfill from property_details.listing_events for pre-trigger history.
Tax reassessment forecast MD · Partial reset (capped growth)
- Current annual tax
- $4,792 · $399/mo
- Projected year-2 tax
- $4,792 · $399/mo
- Expected delta
- $0/yr ($0/mo · 0.0%)
ⓘ Screening estimate from a state-policy table — verify with the county assessor before closing.
Climate risk First Street
- Flood 6/10 Major FEMA zone X (unshaded) · 73% chance over 30 yrs
- Wildfire 3/10 Moderate
- Heat 7/10 Severe 7 d/yr ≥104°F today · 16 d/yr by 30 yrs out
- Wind 4/10 Moderate 23% chance of damaging wind over 30 yrs
- Air quality 3/10 Moderate 2 unhealthy d/yr today · 3 by 30 yrs out
Nearby sold comps map
Loading sold comps map…
Walkable amenities ~0.75 mi
Loading nearby amenities…
Taxation est. · year 1
- Rental income
- $41,089
- − Mortgage interest
- −$22,720
- − Property taxes
- −$4,792
- − Insurance
- −$2,028
- − Repairs & maintenance
- −$3,287
- − Management
- −$3,287
- − Depreciation
- −$11,799
- Taxable loss
- −$6,824
- Est. tax savings @ 24.0%
- +$1,638
- After-tax cash flow
- $1,754/yr
For passive investors: Depreciation is non-cash, so a rental often shows a tax loss while cash-flowing — sheltering income. Rental losses are passive: they offset passive income freely, and up to $25,000/yr can offset ordinary (W-2) income if you actively participate and your MAGI is under $100k (phasing out to $0 by $150k); unused losses carry forward. On sale, claimed depreciation is recaptured at up to 25%, and gains may owe capital-gains tax (a 1031 exchange can defer both). Figures are a year-1 estimate at your 24.0% rate — not tax advice; consult a CPA.
Schools (NCES district)
- District
- Prince George'S County Public Schools
- NCES district ID
- 2400510
- Math proficiency
- 8% ▼ -11.00%
- Reading proficiency
- 24% ▼ -9.00%
- Median HH income
- $73,967
- Composite
- 16.82/100
- National rank
- #9151
- State rank
- #21 of 24 in MD
Livability — Clinton
- Score
- 63/100
- State rank
- #304
- US rank
- #15951
Category grades
Schools grade is shown separately in the Schools card above.
Census & demographics
- Census place
- Clinton, MD
- County
- Prince Georges County · 919,866 people
- City population
- 37,464
- Metro
- Washington-Arlington-Alexandria, DC-VA-MD-WV
- Population (ZIP)
- 37,464
- Household income
- $126,196
- Rent vs Own
- Severe rent burden
- 334.0
Population outlook (Prince George's County) Hauer SSP2
- Today (2025)
- 1,005,426 people
- By 2030
- 1,048,416 · +4.3%
- By 2040
- 1,123,425 · +11.7%
- By 2050
- 1,183,220 · +17.7%
- By 2075
- 1,306,202 · +29.9%
- By 2100
- 1,408,179 · +40.1%
Race, ethnicity, and origin ACS 2023
- Neighborhood character
- Predominantly Black (76%)
- Race & ethnicity
- Black 76% Hispanic / Latino 10% White 7% Two or more races 5% Asian 2%
- Hispanic origin (detail)
- Mexican 1%
- Foreign-born
- 13% · Canada, Vietnam
- Languages at home
- 86% English-only · Spanish 9% Tagalog/Filipino 1% French/Haitian/Cajun 1%
Political lean MEDSL · Prince George's
- 2024 margin
- Solid D (+75.2) · D 86.3% · R 11.2% · Other 2.5%
- 2008→2024 swing
- -3.3pp toward R · 2008: 78.5pp · 2024: 75.2pp
- All cycles
- 2024: D+75.2 2020: D+80.5 2016: D+81.0 2012: D+80.9 2008: D+78.5
Not yet ingested
- Civics
- —
Market trends
- HPI YoY
- ▼ -299.23%
- Current HPI
- 251.6263
- Rent YoY
- —
- Metro
- Washington-Arlington-Alexandria, DC-VA-MD-WV
- State GDP YoY
- ▲ 2.97%
- F500 in state
- 12
Industry mix (Fortune 500 HQ in MD)
| Industry | F500 HQs | Revenue |
|---|---|---|
| Aerospace / Defense | 1 | $71B |
|
||
| Utilities | 1 | $25B |
|
||
| Hotels | 1 | $24B |
|
||
| Consumer Goods | 1 | $7B |
|
||
| Real Estate | 1 | $6B |
|
||
| Chemicals | 1 | $2B |
|
||
Price history
+189.7% since first listed3 events — show timeline
- 2026-04-16 Listed $405,600 BRIGHT MLS
- 1989-05-01 Sold (Public Records) $140,000 Public Records
- 1989-05-01 Sold (Public Records) $140,000 Public Records
Property tax history
+6.0%/yrLatest (2025): $4,792 · +3.0% YoY. Source: county tax records.
Cash-flow waterfall
monthlySold comps — $/sqft
last 12 mo · ≤1 miLoading sold comps…