2100 Glenn Rd · Southold, NY
Flood risk 1/10 · Minimal
- FEMA flood zone
- X (unshaded)
- Chance of flooding over 30 yrs
- 0.0%
- Est. flood insurance / yr
- $473 – $860
Fire risk 1/10 · Minimal
- Est. fire insurance / yr
- $691 – $1,283
Heat risk 5/10 · Moderate
- Hot days now (above 90°F)
- 7 days/yr
- Hot days in 30 yrs
- 19 days/yr
Wind risk 8/10 · Major
- Chance of severe wind over 30 yrs
- 80.0%
Air-quality risk 3/10 · Minor
- Unhealthy air days now
- 2 days/yr
- Unhealthy air days in 30 yrs
- 3 days/yr
Risk factors via First Street. Map © Google.
Why this score? — see what drove the B- grade
The composite is a weighted blend of 9 inputs, each scored 0–100. Each bar is that input's sub-score; the figure is the points it added to the 100-point composite (weight × sub-score).
- Cash flow +28.8/30.0
- DSCR +10.0/10.0
- ARV discount +7.5/15.0
- 1% rule +7.0/10.0
- Schools +4.8/10.0
- Livability +3.4/5.0
- Rent growth +2.5/5.0
- Condition / age +2.5/5.0
- Appreciation +0.0/10.0
$1,925,000
🖨 Deal sheet (PDF) 📄 Offer letter ✓ Due diligence
Listing remarks MLS
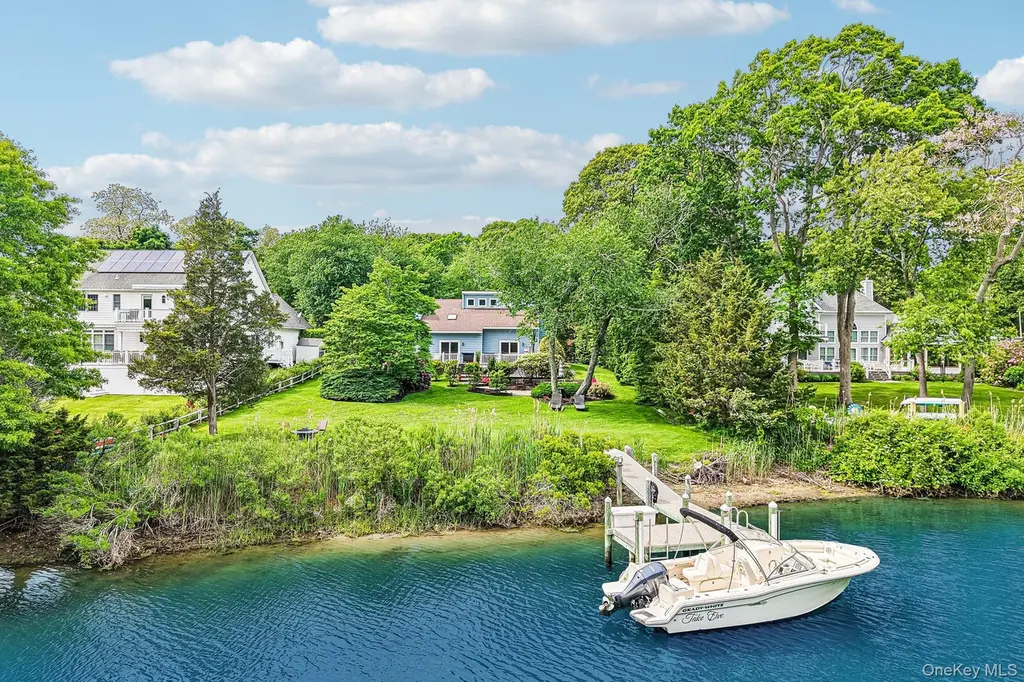
Waterfront With Dock In The Heart Of Wine Country! Extremely Low Taxes & Gorgeous Views, This Charming & Well Adorned Residence Rests Peacefully On Goose Creek. Features An Open, Airy Floor Plan. Spacious Great/Family Room w Fireplace Overlooking Sensational Landscaping & Newly Redone Waterfront Dock. Chef's Kitchen w Quartz Countertops & Thermador Appliances, Andersen Windows, Ductless AC Units, And A Tremendous Basement. This Special Southold Home Is Truly A Must See. Don't Wait, This Won't Last!, Additional information: Appearance:Diamond++,Separate Hotwater Heater:Yes
Key facts
- 0.64 acre lot
- 2 garage spots
- Built 1984
Property features AI
Exterior
- Parking: Driveway; 2-car garage
- Utilities: Electric service by PSEG; Cesspool for sewer; Other utilities — see remarks
- Home design: Single family residence; Three or more stories/levels
- Construction: HardiPlank-type exterior
- Exterior features: Dock; Waterfront property
Interior
- Kitchen: Chef's kitchen with stainless steel appliances
- Bedrooms: Includes a bedroom on the first floor
- Bathrooms: Three full bathrooms; One half bathroom
- Heating & cooling: Forced air heating (oil); Ductless cooling
- Interior features: First-floor bedroom; First-floor full bath; Cathedral ceilings; Ceiling fans; Chef's kitchen; Entrance foyer; Formal dining room; Finished full basement; 12 total rooms; Three or more levels
- Laundry & utility: Laundry located in a bathroom
Neighborhood map
What this means for you Summary
Snapshot
- This is a 4-bed/3.5-bath single-family listed at $1.93M.
Deal economics
- At list price, monthly cash flow is $6k ($78k/yr) — positive.
- The deal already cash-flows at list — no discount required.
- Meets the 1% rule at list price ($23k rent vs $1.93M).
- Cap rate 10.3% vs local median 6.9% in Southold — top-decile yield for the area; either an underpriced asset or a hidden risk that comps aren't pricing in. Stress-test before assuming the spread holds.
Location & tenants
- Location reads 67/100 on livability (#583 in NY) — a middle-class / working-renter tenant base. Strengths: crime A+, employment A+, health & safety B+; Watch: amenities F, commute F, cost of living F.
- Southold Union Free School District (town): math 46% / reading 59% proficiency, ranked #298 of 590 in NY (top 50%) — acceptable for families but not a draw, mixed tenant base, ~2y average lease; only 17% free/reduced lunch — higher-income household profile.
- Zoned schools: Southold Elementary School (math 37% / reading 62%, grade D, #1,085 of 2,108 statewide, top 56%, 317 students, 35% FRL); Southold Junior-Senior High School (math 52% / reading 52%, grade D+, #946 of 1,100 statewide, top 88%, 380 students, 40% FRL) — zoned schools average 38% FRL vs 17% district-wide (21 pts higher); higher-poverty schools than district average — tighter screening recommended.
- Market conditions: 79 active listings in the ZIP; 4 comparable units currently listed for rent nearby; rentals lingering (median 45d on market — plan ~5-8 weeks vacancy on turnover, expect pricing pressure); 50% of comp listings sitting > 30 days — soft ceiling on asking rent; 1,366 units permitted in Suffolk County in 2024 (216 in 5+ unit buildings).
Forward outlook
- Local home prices are declining (-3.0%/yr); year-one equity from $13k of loan paydown is wiped out by about $58k of value loss. Plan a longer hold.
- Suffolk County population projected to shrink 5% by 2050 — rents likely to lag national; underwrite the cash flow, not the appreciation.
- At projected returns (-3.0% appreciation + 3.0% rent growth), your $539k cash investment doubles in ~9 years — after that, you're playing with house money.
Negotiation context
- Only 9 days on market — expect competitive offers; lowballing is unlikely to land.
- 4 sale attempts since 11y ago; this cycle's ask is 34% above the opening price — seller raised mid-cycle; expect resistance to lowballs.
- Current owner paid $1.44M; 34% above their basis — modest negotiation headroom, anchor on the comps not their cost.
Risks & watch-outs
- Climate carrying-cost: severe wind risk, 80% chance of damaging wind over 30y; extreme-heat days projected 7→19/yr by 2055 (HVAC capex compounding) — expect insurance premiums to compound above CPI over the hold.
Questions for the listing agent
- Is there a deadline driving the sale (1031 exchange, divorce, estate, relocation)? That informs how much negotiation room exists.
- Schools are A-rated — typically a magnet for longer-tenancy family renters. What's the average tenant stay here, and is there a school-zone premium baked into asking?
- What's the average days-on-market for RENTAL listings here right now (not sales)? A rising rental-DOM trend means longer vacancies and softer asking-rent achievability than the comps imply.
- What's the recent tenant-quality profile in this submarket — average credit score on applications, eviction rate, late-payment / NSF rate, and stable-employment percentage? A property-management company in the area should have these aggregated.
- How much new for-sale + rental construction is in the pipeline within 1–3 miles? Heavy new supply typically softens prices + rents 12–24 months out; constrained supply supports both.
Investment metrics
- 1% rule
- 1.20% ✓
- Cap rate
- 10.32%
- Cash-on-cash
- 14.39%
- DSCR
- 1.64
- GRM
- 6.9
CMA / ARV
- ARV (on-the-fly)
- $1,271,100
- Comps found
- 5
Show comp detail 5 sales within ~0.75 mi
| Address | Dist | Beds/Ba | Sqft | Sold | Price | $/sf | Match |
|---|---|---|---|---|---|---|---|
| 5805 Main Bayview Rd | 0.32mi | 4/3.0 | 3,253 (+14%) | 5mo | $2,700,000 | $830 | 55 |
| 480 N Bayview Road Ext | 0.61mi | 3/3.0 (-1) | 2,936 (+3%) | 6mo | $1,175,000 | $400 | 54 |
| 3295 Pine Neck Rd | 0.60mi | 3/2.5 (-1) | 2,971 (+4%) | 19mo | $1,325,000 | $446 | 40 |
| 8355 Main Bayview Rd | 0.72mi | 4/3.0 | 2,662 (-7%) | 16mo | $1,800,000 | $676 | 40 |
| 1305 Cedar Dr | 0.50mi | 4/3.5 | 3,233 (+13%) | 18mo | $999,999 | $309 | 40 |
Match score weights: distance 35% · size 25% · config 20% · recency 20%. Top-matched comps best support the ARV.
Projected returns pro-forma
-3.0% appreciation · 3.0% rent growth · sell at horizon
- IRR
- 4.8%
- Equity multiple
- 1.18×
- Total profit
- $99,249
- Equity at exit
- $287,024
- IRR
- 14.2%
- Equity multiple
- 2.14×
- Total profit
- $614,347
- Equity at exit
- $166,439
Cash invested: $539,000 (down + closing). Projections, not guarantees.
Landlord ↔ Tenant lean methodology
- Overall (STATE)
- 15 Strongly Tenant-Friendly
- State New York
- 15 Strongly Tenant-Friendly · D+10
- County
- — inherits STATE
- City
- — inherits STATE
ZIP-level market 11971
- Home prices YoY
- -15.8%
- Active inventory
- 79
- Price-to-rent
- 6.9×
Monthly cashflow live
- Estimated rent
- $23,160 medium interval (Pro) →
- Mortgage (P&I)
- −$10,095
- Tax from tax record
- −$934 /mo · $11,214/yr
- Insurance
- −$802
- HOA
- −$0
- Vacancy / Maint / Mgmt
- −$4,864
- Net cashflow
- $6,465
Break-even live
Sensitivity live
| Price | -10% $7,554 | -5% $7,009 | +0% $6,465 | +5% $5,920 | +10% $5,375 |
|---|---|---|---|---|---|
| Rent | -10% $4,635 | -5% $5,550 | +0% $6,465 | +5% $7,379 | +10% $8,294 |
| Rate | -1.0pp $7,434 | -0.5pp $6,954 | base $6,465 | +0.5pp $5,966 | +1.0pp $5,458 |
UW: 25.0% down · 7.5% · 30yr · 1.5% tax · 5.0% vac · 8.0% maint · 8.0% mgmt
Financing live
Cash to close
- Down payment
- $481,250
- Closing costs
- $57,750
- Reserves months
- —
- Total cash needed
- —
Loan-product check · same deal, 3 products live
Conventional
25% down · 7.5% · 30yr
- Down + closing
- —
- Monthly P&I
- —
- Monthly cashflow
- —
- DSCR
- —
- Eligible?
- —
Personal DTI + credit; lowest rate.
DSCR
20% down · 8.5% · 30yr
- Down + closing
- —
- Monthly P&I
- —
- Monthly cashflow
- —
- DSCR
- —
- Eligible?
- —
No personal income docs; deal must DSCR.
Hard money
10% down · 12.0% · 12mo
- Down + closing
- —
- Monthly P&I
- —
- Monthly cashflow
- —
- DSCR
- —
- Eligible?
- —
Short-term bridge; refi at stabilization.
Rent comps 4 comps
| Address | Beds | Baths | Sqft | Rent | $/sqft | DOM | Units | Dist |
|---|---|---|---|---|---|---|---|---|
| 110 Sleepy Hollow Ln Southold, NY | 4.0 | 3.0 | 2900 | $25,000 | $8.62 | 44d | 1 | 0.18mi |
| 1160 Goose Creek Ln Southold, NY | 5.0 | 3.0 | 2000 | $50,000 | $25.00 | 44d | 1 | 0.67mi |
| 215 Northfield Ln Southold, NY | 4.0 | 3.0 | 2300 | $13,000 | $5.65 | 19d | 1 | 1.04mi |
| 580 Gin Ln Southold, NY | 4.0 | 4.0 | 3585 | $20,000 | $5.58 | 25d | 1 | 1.17mi |
Listing history 12 events
-
2026-06-21days on market $1,925,000 Active 9 DOM
-
2026-06-18days on market $1,925,000 Active 7 DOM
-
2026-06-17days on market $1,925,000 Active 6 DOM
-
2026-06-16days on market $1,925,000 Active 5 DOM
-
2026-06-15days on market $1,925,000 Active 4 DOM
-
2026-06-13days on market $1,925,000 Active 2 DOM
-
2026-06-12statusdays on market $1,925,000 Active 1 DOM
-
2026-06-09days on market $1,925,000 Coming Soon 4 DOM
-
2026-06-08days on market $1,925,000 Coming Soon 3 DOM
-
2026-06-07days on market $1,925,000 Coming Soon 2 DOM
-
2026-06-07remarks 699-char remark
-
2026-06-07$1,925,000 Coming Soon 1 DOM
ⓘ Source: listings_history table (triggers on properties + properties_extension) + one-shot
backfill from property_details.listing_events for pre-trigger history.
Tax reassessment forecast NY · Partial reset (capped growth)
- Current annual tax
- $11,214 · $934/mo
- Projected year-2 tax
- $21,873 · $1,823/mo
- Expected delta
- +$10,659/yr (+$888/mo · 95.1%)
ⓘ Screening estimate from a state-policy table — verify with the county assessor before closing.
Climate risk First Street
- Flood 1/10 Low FEMA zone X (unshaded) · 0% chance over 30 yrs
- Wildfire 1/10 Low
- Heat 5/10 Major 7 d/yr ≥90°F today · 19 d/yr by 30 yrs out
- Wind 8/10 Severe 80% chance of damaging wind over 30 yrs
- Air quality 3/10 Moderate 2 unhealthy d/yr today · 3 by 30 yrs out
Nearby sold comps map
Loading sold comps map…
Walkable amenities ~0.75 mi
Loading nearby amenities…
Taxation est. · year 1
- Rental income
- $277,916
- − Mortgage interest
- −$107,830
- − Property taxes
- −$11,214
- − Insurance
- −$9,625
- − Repairs & maintenance
- −$22,233
- − Management
- −$22,233
- − Depreciation
- −$56,000
- Taxable income
- $48,781
- Est. tax owed @ 24.0%
- −$11,707
- After-tax cash flow
- $65,868/yr
For passive investors: Depreciation is non-cash, so a rental often shows a tax loss while cash-flowing — sheltering income. Rental losses are passive: they offset passive income freely, and up to $25,000/yr can offset ordinary (W-2) income if you actively participate and your MAGI is under $100k (phasing out to $0 by $150k); unused losses carry forward. On sale, claimed depreciation is recaptured at up to 25%, and gains may owe capital-gains tax (a 1031 exchange can defer both). Figures are a year-1 estimate at your 24.0% rate — not tax advice; consult a CPA.
Schools (NCES district)
- District
- Southold Union Free School District
- NCES district ID
- 3627620
- Math proficiency
- 46% ▼ -10.00%
- Reading proficiency
- 59% ▲ 6.00%
- Median HH income
- $78,622
- Composite
- 47.54/100
- National rank
- #2269
- State rank
- #298 of 590 in NY
Livability — Southold
- Score
- 67/100
- State rank
- #583
- US rank
- #10545
Category grades
Schools grade is shown separately in the Schools card above.
Census & demographics
- Census place
- Southold, NY
- City population
- 6,507
- Population (ZIP)
- 6,507
Population outlook (Suffolk County) Hauer SSP2
- Today (2025)
- 1,505,262 people
- By 2030
- 1,498,318 · -0.5%
- By 2040
- 1,471,101 · -2.3%
- By 2050
- 1,424,848 · -5.3%
- By 2075
- 1,337,157 · -11.2%
- By 2100
- 1,217,720 · -19.1%
Race, ethnicity, and origin ACS 2023
- Neighborhood character
- Predominantly White (78%)
- Race & ethnicity
- White 78% Hispanic / Latino 14% Two or more races 5% Asian 4%
- Hispanic origin (detail)
- Mexican 3% Puerto Rican 1% Dominican 3%
- Common ancestry
- Romanian 6% Italian 2% Slovak 2%
- Foreign-born
- 14% · Canada, China, Dominican Republic
- Languages at home
- 83% English-only · Spanish 11% Russian/Polish/Slavic 2% Other Indo-European 2%
Political lean MEDSL · Suffolk
- 2024 margin
- Lean R (+10.0) · D 45.0% · R 55.0%
- 2008→2024 swing
- -16.0pp toward R · 2008: 6.0pp · 2024: -10.0pp
- All cycles
- 2024: R+10.0 2020: R+0.0 2016: R+8.2 2012: D+2.9 2008: D+6.0
Not yet ingested
- Civics
- —
Market trends
- HPI YoY
- ▼ -74.14%
- Current HPI
- 396.5481
- Rent YoY
- —
- Metro
- —
- State GDP YoY
- ▲ 2.60%
- F500 in state
- 92
Industry mix (Fortune 500 HQ in NY)
| Industry | F500 HQs | Revenue |
|---|---|---|
| Financial Services | 10 | $950B |
|
||
| Consumer Goods | 9 | $162B |
|
||
| Insurance | 4 | $225B |
|
||
| Telecommunications | 2 | $144B |
|
||
| Pharmaceuticals | 2 | $112B |
|
||
| Media / Entertainment | 2 | $69B |
|
||
Price history
+6109.7% since first listed16 events — show timeline
- 2026-06-05 Coming Soon $1,925,000 OneKey® MLS as Distributed by MLS Grid
- 2021-12-15 Sold (Public Records) $1,435,000 Public Records
- 2021-10-20 Sold (MLS) $1,435,000 OneKey® MLS as Distributed by MLS Grid
- 2021-09-15 Sold (Public Records) $1,350,000 Public Records
- 2021-08-23 Pending — OneKey® MLS as Distributed by MLS Grid
- 2021-08-05 Listed $1,435,000 OneKey® MLS as Distributed by MLS Grid
- 2020-12-27 Listing Removed — OneKey® MLS as Distributed by MLS Grid
- 2019-11-18 Listed $1,290,000 OneKey® MLS as Distributed by MLS Grid
- 2016-05-17 Sold (Public Records) $545,000 Public Records
- 2016-04-29 Sold (MLS) $545,000 OneKey® MLS as Distributed by MLS Grid
- 2016-04-29 Sold (MLS) $545,000 MLSLI
- 2016-03-29 Pending — MLSLI
- 2015-09-28 Price Changed $599,000 MLSLI
- 2015-06-18 Listed $650,000 MLSLI
- 2015-06-18 Listed $599,000 OneKey® MLS as Distributed by MLS Grid
- 1981-08-21 Sold (Public Records) $31,000 Public Records
Property tax history
+2.5%/yrLatest (2025): $11,214 · +0.0% YoY. Source: county tax records.
Cash-flow waterfall
monthlySold comps — $/sqft
last 12 mo · ≤1 miLoading sold comps…