35 Harvest St #1 · Rochester, NY
Flood risk 1/10 · Minimal
- FEMA flood zone
- X (unshaded)
- Chance of flooding over 30 yrs
- 0.0%
- Est. flood insurance / yr
- $473 – $860
Fire risk 1/10 · Minimal
- Est. fire insurance / yr
- $691 – $1,283
Heat risk 2/10 · Minimal
- Hot days now (above 95°F)
- 7 days/yr
- Hot days in 30 yrs
- 15 days/yr
Wind risk 1/10 · Minimal
- Chance of severe wind over 30 yrs
- —
Air-quality risk 2/10 · Minimal
- Unhealthy air days now
- 1 days/yr
- Unhealthy air days in 30 yrs
- 2 days/yr
Risk factors via First Street. Map © Google.
Why this score? — see what drove the A- grade
The composite is a weighted blend of 9 inputs, each scored 0–100. Each bar is that input's sub-score; the figure is the points it added to the 100-point composite (weight × sub-score).
- Cash flow +30.0/30.0
- ARV discount +15.0/15.0
- 1% rule +10.0/10.0
- DSCR +10.0/10.0
- Appreciation +5.4/10.0
- Livability +3.8/5.0
- Rent growth +2.5/5.0
- Condition / age +2.2/5.0
- Schools +1.9/10.0
$89,900
🖨 Deal sheet (PDF) 📄 Offer letter ✓ Due diligence
Listing remarks
Three Bedroom/ 1 Bathroom and carries over a century of history, reflecting the architectural character that makes Rochester's older neighborhoods so distinctive with a very large, detached garage with lots of storage space. Located minutes from downtown Rochester, local parks, accessible to public transportation and the hospital. This property combines historic charm with unbeatable accessibility
Key facts
- Historic charm
- Detached garage
- 3,141 sq ft lot
Tags
Property features AI
Exterior
- Parking: Detached garage; 1 garage space
- Utilities: Public water (connected); Sewer connected
- Home design: Single-story; Existing condition
- Construction: Aluminum siding; Poured foundation
- Exterior features: Blacktop driveway; Near public transit; Rectangular residential lot; City street frontage
Interior
- Kitchen: Eat-in kitchen
- Bedrooms: 2 main-level bedrooms
- Flooring: Hardwood; Laminate; Varies
- Bathrooms: 1 full bathroom (main level)
- Heating & cooling: Gas forced-air heating
- Interior features: Eat-in kitchen; Other interior features (see remarks); Full basement
- Laundry & utility: Gas water heater
Neighborhood map
What this means for you Summary
Snapshot
- This is a 3-bed/1.0-bath single-family listed at $90k. Condition is rated fair.
Deal economics
- At list price, monthly cash flow is $653 ($8k/yr) — positive.
- The deal already cash-flows at list — no discount required.
- Meets the 1% rule at list price ($2k rent vs $90k).
- Recommended offer: $89k (1.5% below list) — sets the bar for market timing.
- Cap rate 15.0% vs local median 9.3% in Rochester — top-decile yield for the area; either an underpriced asset or a hidden risk that comps aren't pricing in. Stress-test before assuming the spread holds.
Location & tenants
- Location reads 76/100 on livability (#222 in NY, #3,482 nationally) — a middle-class / working-renter tenant base. Strengths: commute A+, cost of living A+, housing A+; Watch: schools D+, crime F, employment F.
- Rochester City School District (urban): math 21% / reading 26% proficiency, ranked #589 of 590 in NY (top 100%) — low school quality limits family demand, transient renter base, plan for 1-2y turnover; 82% free/reduced lunch — lower-income household profile, screen leases tightly.
- Market conditions: 32 active listings in the ZIP; 40 comparable units currently listed for rent nearby; rentals at typical pace (median 23d on market — plan ~3-4 weeks tenant-placement turnaround); lower-income renter base — watch delinquency; 1,169 units permitted in Monroe County in 2024 (591 in 5+ unit buildings).
- At $1,613/mo this rent would consume 91% of the median local household income ($21k/yr) (locally 1108% of renters already pay >50% of income on rent) — very limited rent-growth headroom before tenants either downsize or default.
Forward outlook
- In year one you build about $1k of equity ($622 loan paydown + $743 appreciation (0.8% local appreciation)).
- Monroe County population projected to shrink 6% by 2050 — rents likely to lag national; underwrite the cash flow, not the appreciation.
- At projected returns (0.8% appreciation + 3.0% rent growth), your $25k cash investment doubles in ~3 years — after that, you're playing with house money.
Negotiation context
- It's been on market 19 days — a 2% lower offer ($89k) is reasonable based on typical stale-listing flexibility.
Risks & watch-outs
- Watch-outs: built in 1910 — expect roof / HVAC / electrical / plumbing capex.
Questions for the listing agent
- Have any recent inspections been done? Can we get a copy of the seller's disclosures and any deferred-maintenance estimates?
- Built in 1910 — when were the roof, HVAC, electrical panel, plumbing, and water heater last replaced?
- Is there a deadline driving the sale (1031 exchange, divorce, estate, relocation)? That informs how much negotiation room exists.
- Schools are D-rated, which usually means shorter tenancies and higher turnover. Who's the typical renter profile here, and what's been the actual vacancy rate?
- Crime grade is F in this area — have there been break-ins, vandalism, or insurance claims at this property in the last 3 years? What carrier currently insures it and at what premium?
- What's the average days-on-market for RENTAL listings here right now (not sales)? A rising rental-DOM trend means longer vacancies and softer asking-rent achievability than the comps imply.
- What's the recent tenant-quality profile in this submarket — average credit score on applications, eviction rate, late-payment / NSF rate, and stable-employment percentage? A property-management company in the area should have these aggregated.
- How much new for-sale + rental construction is in the pipeline within 1–3 miles? Heavy new supply typically softens prices + rents 12–24 months out; constrained supply supports both.
Investment metrics
- 1% rule
- 1.79% ✓
- Cap rate
- 15.00%
- Cash-on-cash
- 31.11%
- DSCR
- 2.38
- GRM
- 4.6
CMA / ARV
- ARV (on-the-fly)
- $138,480
- Comps found
- 12
Show comp detail 12 sales within ~0.75 mi
| Address | Dist | Beds/Ba | Sqft | Sold | Price | $/sf | Match |
|---|---|---|---|---|---|---|---|
| 1015 N Goodman St | 0.33mi | 3/1.0 | 1,126 (-2%) | 3mo | $135,000 | $120 | 78 |
| 865 N Goodman St | 0.27mi | 4/1.5 (+1) | 1,245 (+8%) | 2mo | $76,000 | $61 | 66 |
| 147 5th St | 0.16mi | 4/1.0 (+1) | 1,289 (+12%) | 3mo | $150,000 | $116 | 66 |
| 45 Newcomb St | 0.44mi | 3/1.0 | 1,233 (+7%) | 3mo | $110,000 | $89 | 66 |
| 1824 Clifford Ave | 0.66mi | 3/1.0 | 1,188 (+3%) | 2mo | $62,500 | $53 | 63 |
| 1822 Clifford Ave | 0.65mi | 3/1.0 | 1,188 (+3%) | 3mo | $95,000 | $80 | 62 |
| 144 Peck St | 0.43mi | 3/1.5 | 1,264 (+10%) | 0mo | $173,000 | $137 | 62 |
| 201 Arbutus St | 0.68mi | 4/1.5 (+1) | 1,180 (+2%) | 0mo | $210,000 | $178 | 57 |
| 82 Willmont St | 0.71mi | 2/1.0 (-1) | 1,100 (-5%) | 1mo | $155,000 | $141 | 53 |
| 157 Cummings St | 0.56mi | 3/2.0 | 1,272 (+10%) | 2mo | $250,000 | $197 | 51 |
| 207 Herald St | 0.69mi | 3/2.0 | 1,288 (+12%) | 1mo | $60,000 | $47 | 44 |
| 93 Willmont St | 0.70mi | 2/2.0 (-1) | 1,022 (-11%) | 2mo | $145,000 | $142 | 38 |
Match score weights: distance 35% · size 25% · config 20% · recency 20%. Top-matched comps best support the ARV.
Projected returns pro-forma
0.83% appreciation · 3.0% rent growth · sell at horizon
- IRR
- 33.2%
- Equity multiple
- 2.69×
- Total profit
- $42,509
- Equity at exit
- $29,879
- IRR
- 35.7%
- Equity multiple
- 5.23×
- Total profit
- $106,589
- Equity at exit
- $39,086
Cash invested: $25,172 (down + closing). Projections, not guarantees.
Landlord ↔ Tenant lean methodology
- Overall (STATE)
- 15 Strongly Tenant-Friendly
- State New York
- 15 Strongly Tenant-Friendly · D+10
- County
- — inherits STATE
- City
- — inherits STATE
ZIP-level market 14605
- Home prices YoY
- 0.4%
- Active inventory
- 32
- Price-to-rent
- 4.6×
Monthly cashflow live
- Estimated rent
- $1,613 high interval (Pro) →
- Mortgage (P&I)
- −$471
- Tax est. 1.5%
- −$112 /mo · $1,348/yr
- Insurance
- −$37
- HOA
- −$0
- Vacancy / Maint / Mgmt
- −$339
- Net cashflow
- $653
Break-even live
Sensitivity live
| Price | -10% $715 | -5% $684 | +0% $653 | +5% $622 | +10% $591 |
|---|---|---|---|---|---|
| Rent | -10% $525 | -5% $589 | +0% $653 | +5% $716 | +10% $780 |
| Rate | -1.0pp $698 | -0.5pp $676 | base $653 | +0.5pp $629 | +1.0pp $606 |
UW: 25.0% down · 7.5% · 30yr · 1.5% tax · 5.0% vac · 8.0% maint · 8.0% mgmt
Financing live
Cash to close
- Down payment
- $22,475
- Closing costs
- $2,697
- Reserves months
- —
- Total cash needed
- —
Loan-product check · same deal, 3 products live
Conventional
25% down · 7.5% · 30yr
- Down + closing
- —
- Monthly P&I
- —
- Monthly cashflow
- —
- DSCR
- —
- Eligible?
- —
Personal DTI + credit; lowest rate.
DSCR
20% down · 8.5% · 30yr
- Down + closing
- —
- Monthly P&I
- —
- Monthly cashflow
- —
- DSCR
- —
- Eligible?
- —
No personal income docs; deal must DSCR.
Hard money
10% down · 12.0% · 12mo
- Down + closing
- —
- Monthly P&I
- —
- Monthly cashflow
- —
- DSCR
- —
- Eligible?
- —
Short-term bridge; refi at stabilization.
Rent comps 40 comps
| Address | Beds | Baths | Sqft | Rent | $/sqft | DOM | Units | Dist |
|---|---|---|---|---|---|---|---|---|
| 147 5th St Rochester, NY | 4.0 | 1.0 | 1289 | $1,950 | $1.51 | 22d | 1 | 0.17mi |
| 52 Frances St Rochester, NY | 4.0 | 1.0 | 1256 | $1,595 | $1.27 | 45d | 1 | 0.21mi |
| 47 Priscilla St Rochester, NY | 4.0 | 1.5 | 1250 | $1,900 | $1.52 | 22d | 1 | 0.28mi |
| 25 Trust St Rochester, NY | 3.0 | 1.5 | 1003 | $1,600 | $1.60 | 4d | 1 | 0.42mi |
| 86-88 Baycliff Dr Unit 86 Rochester, NY | 2.0 | 1.0 | 900 | $1,030 | $1.14 | 22d | 1 | 0.45mi |
| 16 Cummings St Rochester, NY | 2.0 | 1.0 | 782 | $1,250 | $1.60 | 20d | 1 | 0.46mi |
| 16 Cummings St Rochester, NY | 2.0 | 1.0 | 782 | $1,250 | $1.60 | 45d | 1 | 0.46mi |
| 222 Ellison St Rochester, NY | 2.0 | 1.0 | 971 | $1,000 | $1.03 | 15d | 1 | 0.56mi |
| 127 Carter St #125 Rochester, NY | 2.0 | 1.0 | 1320 | $1,400 | $1.06 | 45d | 1 | 0.58mi |
| 195 Parsells Ave Rochester, NY | 4.0 | 1.0 | 1413 | $1,265 | $0.90 | 4d | 1 | 0.69mi |
| 1890 Clifford Ave Rochester, NY | 3.0 | 1.0 | 936 | $1,800 | $1.92 | 24d | 1 | 0.71mi |
| 500 Garson Ave Rochester, NY | 2.0 | 1.0 | 740 | $1,050 | $1.42 | 4d | 1 | 0.76mi |
| 14 Beechwood St Rochester, NY | 2.0 | 1.0 | 850 | $1,200 | $1.41 | 24d | 1 | 0.77mi |
| 176 Roycroft Dr Rochester, NY | 3.0 | 1.0 | 1169 | $950 | $0.81 | 11d | 1 | 0.85mi |
| 326 Northland Ave Rochester, NY | 3.0 | 1.0 | 1168 | $1,500 | $1.28 | 3d | 1 | 0.88mi |
| 171 Mohawk St Rochester, NY | 3.0 | 2.0 | 1054 | $1,775 | $1.68 | 45d | 1 | 0.89mi |
| 405 Alexander St Rochester, NY | 2.0 | 1.0 | 800 | $1,425 | $1.78 | 4d | 1 | 0.99mi |
| — Rochester, NY | 2.0 | 1.0 | 896 | $1,100 | $1.23 | 15d | 1 | 0.99mi |
| 459-461 Parsells Ave Rochester, NY | 2.0 | 1.0 | 1053 | $1,450 | $1.38 | 24d | 1 | 1.00mi |
| 395 Alexander St Unit UN12 Rochester, NY | 2.0 | 1.5 | 1226 | $2,200 | $1.79 | 15d | 1 | 1.03mi |
| 250 Anderson Ave Rochester, NY | 2.0 | 1.0 | 832 | $1,675 | $2.01 | 45d | 1 | 1.07mi |
| 420 Rosewood Ter Rochester, NY | 3.0 | 1.0 | 1246 | $1,300 | $1.04 | 4d | 1 | 1.07mi |
| 254 Anderson Ave Rochester, NY | 2.0 | 1.0 | 816 | $975 | $1.19 | 24d | 1 | 1.08mi |
| 636 University Ave Apt 2 Rochester, NY | 2.0 | 1.0 | 850 | $1,550 | $1.82 | 45d | 1 | 1.08mi |
| 100 Fairbanks St Rochester, NY | 2.0 | 1.0 | 1456 | $1,100 | $0.76 | 45d | 1 | 1.09mi |
| 11 Maria St Unit 1 DN Rochester, NY | 2.0 | 1.0 | 800 | $895 | $1.12 | 45d | 1 | 1.12mi |
| 1159 Culver Rd Unit A2 UP Rochester, NY | 3.0 | 1.0 | 1313 | $1,500 | $1.14 | 45d | 1 | 1.13mi |
| 21 Portland Ct Rochester, NY | 2.0 | 1.0 | 850 | $1,210 | $1.42 | 45d | 1 | 1.15mi |
| 733 University Ave #3 Rochester, NY | 3.0 | 1.5 | 1400 | $1,850 | $1.32 | 45d | 1 | 1.17mi |
| 239 Weyl St Rochester, NY | 3.0 | 1.0 | 1208 | $1,600 | $1.32 | 20d | 1 | 1.17mi |
| 21 Rundel Park Unit 2 Rochester, NY | 2.0 | 1.0 | 1250 | $2,099 | $1.68 | 20d | 1 | 1.18mi |
| 152 Gibbs St Rochester, NY | 1.0–2.0 | 1.0 | 950 | $1,875 | $1.97 | 15d | 3 | 1.20mi |
| 128 Gibbs St Unit 130 Rochester, NY | 2.0 | 1.0 | 1000 | $1,875 | $1.88 | 11d | 1 | 1.23mi |
| 128 Gibbs St Unit 136 Rochester, NY | 2.0 | 1.0 | 900 | $1,795 | $1.99 | 11d | 1 | 1.23mi |
| 117 Northaven Ter Rochester, NY | 4.0 | 2.0 | 1460 | $1,975 | $1.35 | 11d | 1 | 1.24mi |
| 474 East Ave Rochester, NY | 1.0–2.0 | 1.0–2.0 | 1125 | $2,800 | $2.49 | 24d | 1 | 1.25mi |
| 108 Bowman St Unit 1 Rochester, NY | 3.0 | 1.0 | 1200 | $1,600 | $1.33 | 45d | 1 | 1.25mi |
| 182 Laurelton Rd Unit 182 Rochester, NY | 2.0 | 1.5 | 1000 | $1,600 | $1.60 | 11d | 1 | 1.26mi |
| 200 East Ave Rochester, NY | 1.0–2.0 | 1.0–2.5 | 936 | $2,481 | $2.65 | 45d | 1 | 1.27mi |
| 933 University Ave Rochester, NY | 1.0–2.0 | 1.0–2.0 | 1295 | $3,815 | $2.94 | 3d | 12 | 1.30mi |
Listing history 14 events
-
2026-06-21days on market $89,900 Active 19 DOM
-
2026-06-18days on market $89,900 Active 16 DOM
-
2026-06-17days on market $89,900 Active 15 DOM
-
2026-06-16days on market $89,900 Active 14 DOM
-
2026-06-15days on market $89,900 Active 13 DOM
-
2026-06-13days on market $89,900 Active 11 DOM
-
2026-06-13days on market $89,900 Active 10 DOM
-
2026-06-10days on market $89,900 Active 8 DOM
-
2026-06-09days on market $89,900 Active 7 DOM
-
2026-06-09days on market $89,900 Active 6 DOM
-
2026-06-07days on market $89,900 Active 5 DOM
-
2026-06-05days on market $89,900 Active 2 DOM
-
2026-06-03remarks 400-char remark
-
2026-06-03$89,900 Active 1 DOM
ⓘ Source: listings_history table (triggers on properties + properties_extension) + one-shot
backfill from property_details.listing_events for pre-trigger history.
Climate risk First Street
- Flood 1/10 Low FEMA zone X (unshaded) · 0% chance over 30 yrs
- Wildfire 1/10 Low
- Heat 2/10 Low 7 d/yr ≥95°F today · 15 d/yr by 30 yrs out
- Wind 1/10 Low
- Air quality 2/10 Low 1 unhealthy d/yr today · 2 by 30 yrs out
Nearby sold comps map
Loading sold comps map…
Walkable amenities ~0.75 mi
Loading nearby amenities…
Taxation est. · year 1
- Rental income
- $19,351
- − Mortgage interest
- −$5,036
- − Property taxes
- −$1,348
- − Insurance
- −$450
- − Repairs & maintenance
- −$1,548
- − Management
- −$1,548
- − Depreciation
- −$2,615
- Taxable income
- $6,805
- Est. tax owed @ 24.0%
- −$1,633
- After-tax cash flow
- $6,198/yr
For passive investors: Depreciation is non-cash, so a rental often shows a tax loss while cash-flowing — sheltering income. Rental losses are passive: they offset passive income freely, and up to $25,000/yr can offset ordinary (W-2) income if you actively participate and your MAGI is under $100k (phasing out to $0 by $150k); unused losses carry forward. On sale, claimed depreciation is recaptured at up to 25%, and gains may owe capital-gains tax (a 1031 exchange can defer both). Figures are a year-1 estimate at your 24.0% rate — not tax advice; consult a CPA.
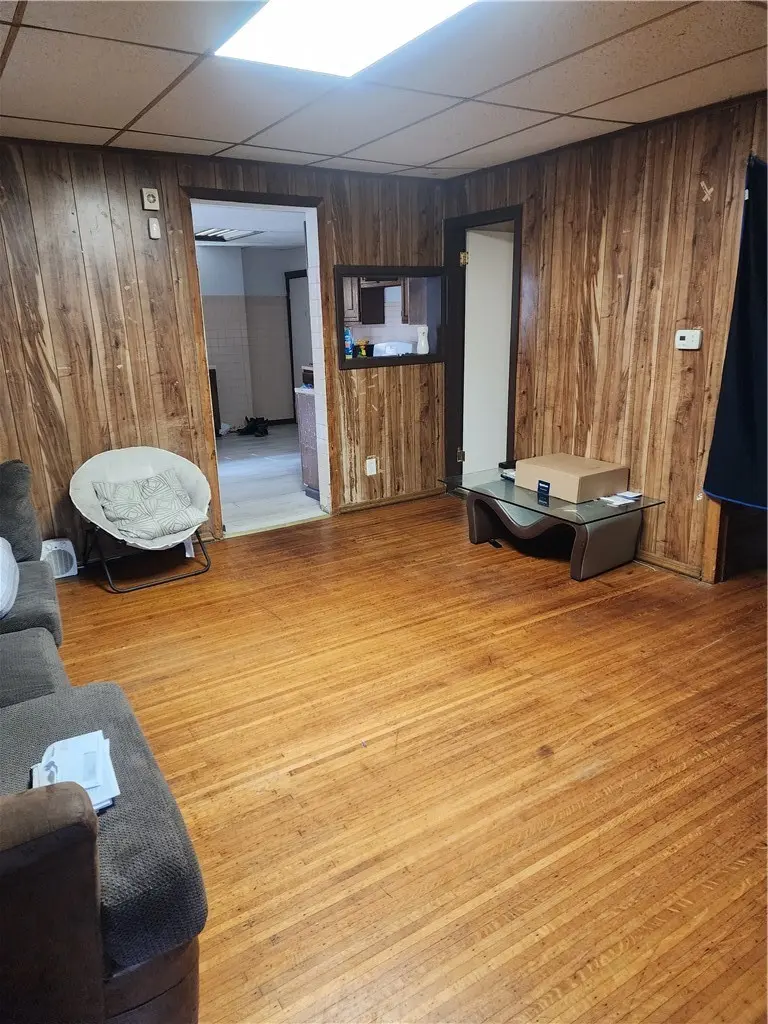
Condition & rehab AI · 13 photos
This home requires moderate renovations, including updating the kitchen, replacing flooring, and replacing the water heater. These updates will significantly increase its resale and rental value.
Repairs flagged
- Major Kitchen cabinets — The cabinets are outdated and in poor condition.
- Major Kitchen countertops — The countertops are worn and may need replacement.
- Major Flooring — The flooring is worn and may need replacement.
- Major Water heater — The water heater appears old and may need replacement.
Value-add opportunities
- Resale Replace kitchen cabinets and countertops — Updating the kitchen will significantly improve the home's appeal and functionality.
- Resale Replace flooring — New flooring will enhance the home's curb appeal and make it more marketable.
- Both Replace water heater — A new water heater will improve the home's functionality and reduce maintenance costs.
Renovation cost estimate screening
| Repair item | Severity | Est. cost |
|---|---|---|
| Kitchen cabinets · The cabinets are outdated and in poor condition. | Major | $15,000–50,000 |
| Kitchen countertops · The countertops are worn and may need replacement. | Major | $15,000–50,000 |
| Flooring · The flooring is worn and may need replacement. | Major | $15,000–50,000 |
| Water heater · The water heater appears old and may need replacement. | Major | $15,000–50,000 |
| Total estimated repair cost · 4 items | $60,000–200,000 |
Value-add ROI direction
- Resale Replace kitchen cabinets and countertops — Updating the kitchen will significantly improve the home's appeal and functionality. ↑
- Resale Replace flooring — New flooring will enhance the home's curb appeal and make it more marketable. ↑
- Both Replace water heater — A new water heater will improve the home's functionality and reduce maintenance costs. ↑
ⓘ Cost ranges are severity-bucket heuristics (US national rule-of-thumb). Get contractor quotes + a written scope before underwriting a rehab budget.
Schools (NCES district)
- District
- Rochester City School District
- NCES district ID
- 3624750
- Math proficiency
- 21% ▬ 0.00%
- Reading proficiency
- 26% ▲ 4.00%
- Median HH income
- $30,923
- Composite
- 18.98/100
- National rank
- #8850
- State rank
- #589 of 590 in NY
Livability — Rochester
- Score
- 76/100
- State rank
- #222
- US rank
- #3482
Category grades
Schools grade is shown separately in the Schools card above.
Census & demographics
- Census place
- Rochester, NY
- County
- Monroe County · 674,131 people
- City population
- 432,803
- Metro
- Rochester, NY
- Population (ZIP)
- 11,783
- Household income
- $21,201
- Rent vs Own
- Severe rent burden
- 1108.0
Population outlook (Monroe County) Hauer SSP2
- Today (2025)
- 759,460 people
- By 2030
- 757,154 · -0.3%
- By 2040
- 740,644 · -2.5%
- By 2050
- 714,443 · -5.9%
- By 2075
- 645,883 · -15.0%
- By 2100
- 547,084 · -28.0%
Race, ethnicity, and origin ACS 2023
- Neighborhood character
- Diverse neighborhood (Simpson 0.64)
- Race & ethnicity
- Black 46% Hispanic / Latino 36% Two or more races 11% White 10% Asian 5%
- Hispanic origin (detail)
- Mexican 1% Puerto Rican 29% Cuban 2% Dominican 2%
- Common ancestry
- Hispanic 1% Romanian 1%
- Foreign-born
- 11% · Canada, China, India
- Languages at home
- 64% English-only · Spanish 27% Other Indo-European 4% French/Haitian/Cajun 2%
Political lean MEDSL · Monroe
- 2024 margin
- D (+19.1) · D 59.5% · R 40.5%
- 2008→2024 swing
- +1.4pp toward D · 2008: 17.7pp · 2024: 19.1pp
- All cycles
- 2024: D+19.1 2020: D+21.0 2016: D+14.1 2012: D+17.4 2008: D+17.7
Not yet ingested
- Civics
- —
Market trends
- HPI YoY
- ▲ 0.83%
- Current HPI
- 207.359
- Rent YoY
- —
- Metro
- Rochester, NY
- State GDP YoY
- ▲ 2.60%
- F500 in state
- 92
Industry mix (Fortune 500 HQ in NY)
| Industry | F500 HQs | Revenue |
|---|---|---|
| Financial Services | 10 | $950B |
|
||
| Consumer Goods | 9 | $162B |
|
||
| Insurance | 4 | $225B |
|
||
| Telecommunications | 2 | $144B |
|
||
| Pharmaceuticals | 2 | $112B |
|
||
| Media / Entertainment | 2 | $69B |
|
||
Price history
1 event — show timeline
- 2026-06-02 Listed $89,900 UNYREIS
Cash-flow waterfall
monthlySold comps — $/sqft
last 12 mo · ≤1 miLoading sold comps…