 🏷️ Likely Rental
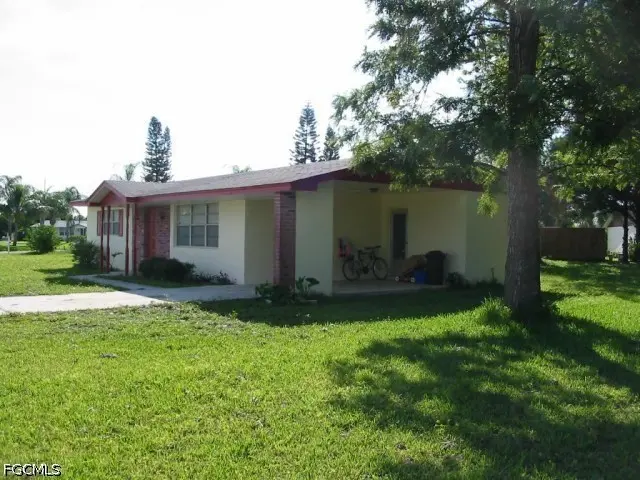
104 Contee Dr · Lehigh Acres, FL
Flood risk 1/10 · Minimal
- FEMA flood zone
- X (unshaded)
- Chance of flooding over 30 yrs
- 0.0%
- Est. flood insurance / yr
- $507 – $1,088
Fire risk 1/10 · Minimal
- Est. fire insurance / yr
- $947 – $1,759
Heat risk 10/10 · Severe
- Hot days now (above 107°F)
- 7 days/yr
- Hot days in 30 yrs
- 28 days/yr
Wind risk 10/10 · Severe
- Chance of severe wind over 30 yrs
- 99.0%
Air-quality risk 2/10 · Minimal
- Unhealthy air days now
- 1 days/yr
- Unhealthy air days in 30 yrs
- 1 days/yr
Risk factors via First Street. Map © Google.
Why this score? — see what drove the C+ grade
The composite is a weighted blend of 9 inputs, each scored 0–100. Each bar is that input's sub-score; the figure is the points it added to the 100-point composite (weight × sub-score).
- Cash flow +20.9/30.0
- ARV discount +15.0/15.0
- DSCR +6.7/10.0
- 1% rule +5.5/10.0
- Schools +4.1/10.0
- Livability +3.0/5.0
- Condition / age +2.5/5.0
- Rent growth +2.3/5.0
- Appreciation +0.0/10.0
$140,000
🖨 Deal sheet 📄 Offer letter ✓ Due diligence
Listing remarks
Affordable 2 bedroom concrete block home in the popular Kenillwood Community, central water and sewer and walking distance to stores etc. on Homestead Rd, oversized corner lot, NEW CENTRAL HEAT AND AIR IN 2023, tenant occupied and in need of some minor cosmetics.
Key facts
- 0.27 acre lot
- Parking
- Built 1978
Neighborhood map
What this means for you Summary
Snapshot
- This is a 2-bed/1.0-bath single-family listed at $140k.
Deal economics
- At list price, monthly cash flow is $196 ($2k/yr) — positive.
- The deal already cash-flows at list — no discount required.
- Meets the 1% rule at list price ($1k rent vs $140k).
- Cap rate 8.0% vs local median 4.7% in Lehigh Acres — top-decile yield for the area; either an underpriced asset or a hidden risk that comps aren't pricing in. Stress-test before assuming the spread holds.
Location & tenants
- Location reads 59/100 on livability (#826 in FL) — a working-class tenant base; expect higher turnover. Strengths: cost of living A+, housing A+; Watch: crime C-, employment D+, schools D-.
- Lee (suburban): math 47% / reading 50% proficiency, ranked #42 of 73 in FL (top 58%) — families likely to look elsewhere, expect single-tenant / working-renter base with shorter leases.
- Market conditions: Rents soft (-0.8%/yr); 641 active listings in the ZIP; 40 comparable units currently listed for rent nearby; rentals at typical pace (median 21d on market — plan ~3-4 weeks tenant-placement turnaround); 15,411 units permitted in Lee County in 2024 (4,686 in 5+ unit buildings).
- This rent runs 34% of the median local income ($51k/yr) — at the standard rent-burdened threshold; future hikes will face affordability resistance.
Forward outlook
- Local home prices are declining (-3.0%/yr); year-one equity from $968 of loan paydown is wiped out by about $4k of value loss. Plan a longer hold.
- Lee County population projected at +44% by 2050 — long-run rental-demand tailwind backs the buy-and-hold thesis.
Negotiation context
- Only 0 days on market — expect competitive offers; lowballing is unlikely to land.
- Current owner paid $48k; list at $140k implies a 189% gain — meaningful room to come down on a strong offer.
Risks & watch-outs
- Climate carrying-cost: severe wind risk, 99% chance of damaging wind over 30y; extreme-heat days projected 7→28/yr by 2055 (HVAC capex compounding) — expect insurance premiums to compound above CPI over the hold.
Questions for the listing agent
- Built in 1978 — when were the roof, HVAC, electrical panel, plumbing, and water heater last replaced?
- Is there a deadline driving the sale (1031 exchange, divorce, estate, relocation)? That informs how much negotiation room exists.
- Schools are D-rated, which usually means shorter tenancies and higher turnover. Who's the typical renter profile here, and what's been the actual vacancy rate?
- What's the average days-on-market for RENTAL listings here right now (not sales)? A rising rental-DOM trend means longer vacancies and softer asking-rent achievability than the comps imply.
- What's the recent tenant-quality profile in this submarket — average credit score on applications, eviction rate, late-payment / NSF rate, and stable-employment percentage? A property-management company in the area should have these aggregated.
- How much new for-sale + rental construction is in the pipeline within 1–3 miles? Heavy new supply typically softens prices + rents 12–24 months out; constrained supply supports both.
Investment metrics
- 1% rule
- 1.05% ✓
- Cap rate
- 7.97%
- Cash-on-cash
- 6.00%
- DSCR
- 1.27
- GRM
- 7.9
CMA / ARV
- ARV (on-the-fly)
- $180,400
- Comps found
- 4
Show comp detail 4 sales within ~0.75 mi
| Address | Dist | Beds/Ba | Sqft | Sold | Price | $/sf | Match |
|---|---|---|---|---|---|---|---|
| 104 Contee Dr | 0.00mi | 2/1.0 | 880 (0%) | 1mo | $140,000 | $159 | 99 |
| 1442 Alwynne Dr N | 0.21mi | 2/1.0 | 920 (+4%) | 19mo | $163,000 | $177 | 66 |
| 1509 Lindale Cir | 0.56mi | 2/1.5 | 920 (+4%) | 24mo | $234,000 | $254 | 44 |
| 18279 Gibraltar Ln | 0.66mi | 3/2.0 (+1) | 1,002 (+14%) | 20mo | $205,000 | $205 | 20 |
Match score weights: distance 35% · size 25% · config 20% · recency 20%. Top-matched comps best support the ARV.
Projected returns pro-forma
-3.0% appreciation · 0.0% rent growth · sell at horizon
- IRR
- -10.5%
- Equity multiple
- 0.63×
- Total profit
- $-14,498
- Equity at exit
- $20,874
- IRR
- -6.0%
- Equity multiple
- 0.67×
- Total profit
- $-13,131
- Equity at exit
- $12,105
Cash invested: $39,200 (down + closing). Projections, not guarantees.
Landlord ↔ Tenant lean methodology
- Overall (STATE)
- 87 Strongly Landlord-Friendly
- State Florida
- 87 Strongly Landlord-Friendly · R+3
- County
- — inherits STATE
- City
- — inherits STATE
ZIP-level market 33936
- Home prices YoY
- -19.9%
- Rents YoY
- -0.8%
- Active inventory
- 641
- Price-to-rent
- 7.9×
Monthly cashflow live
- Estimated rent
- $1,471 high interval (Pro) →
- Mortgage (P&I)
- −$734
- Tax from tax record
- −$174 /mo · $2,085/yr
- Insurance
- −$58
- HOA
- −$0
- Vacancy / Maint / Mgmt
- −$309
- Net cashflow
- $196
Break-even live
UW: 25.0% down · 7.5% · 30yr · 1.5% tax · 5.0% vac · 8.0% maint · 8.0% mgmt
Financing live
Cash to close
- Down payment
- $35,000
- Closing costs
- $4,200
- Reserves months
- —
- Total cash needed
- —
Loan-product check · same deal, 3 products live
Conventional
25% down · 7.5% · 30yr
- Down + closing
- —
- Monthly P&I
- —
- Monthly cashflow
- —
- DSCR
- —
- Eligible?
- —
Personal DTI + credit; lowest rate.
DSCR
20% down · 8.5% · 30yr
- Down + closing
- —
- Monthly P&I
- —
- Monthly cashflow
- —
- DSCR
- —
- Eligible?
- —
No personal income docs; deal must DSCR.
Hard money
10% down · 12.0% · 12mo
- Down + closing
- —
- Monthly P&I
- —
- Monthly cashflow
- —
- DSCR
- —
- Eligible?
- —
Short-term bridge; refi at stabilization.
Rent comps 40 comps
| Address | Beds | Baths | Sqft | Rent | $/sqft | DOM | Units | Dist |
|---|---|---|---|---|---|---|---|---|
| 1423 Caywood Cir S Lehigh Acres, FL | 2.0 | 2.0 | 960 | $1,376 | $1.43 | 3d | 1 | 0.27mi |
| 111 Yellowtail Loop #3 Lehigh Acres, FL | 2.0 | 2.0 | 1100 | $1,750 | $1.59 | 23d | 1 | 0.28mi |
| 219 Beth Stacey Blvd Lehigh Acres, FL | 2.0 | 2.0 | 997 | $1,300 | $1.30 | 21d | 1 | 0.35mi |
| 28 Cosmopolitan Dr #13 Lehigh Acres, FL | 2.0 | 2.0 | 973 | $1,375 | $1.41 | 14d | 1 | 0.37mi |
| 10 Beth Stacey Blvd #206 Lehigh Acres, FL | 2.0 | 2.0 | 1012 | $1,100 | $1.09 | 3d | 1 | 0.45mi |
| 1507 Markdale St E Lehigh Acres, FL | 2.0 | 1.0 | 997 | $1,300 | $1.30 | 3d | 1 | 0.49mi |
| 9099 Aegean Cir Lehigh Acres, FL | 2.0 | 2.0 | 1120 | $1,499 | $1.34 | 23d | 1 | 0.61mi |
| 1407 Juddale St E Lehigh Acres, FL | 2.0 | 1.0 | 997 | $1,450 | $1.45 | 3d | 1 | 0.62mi |
| 9123 Aegean Cir Lehigh Acres, FL | 2.0 | 2.0 | 1120 | $1,474 | $1.32 | 2d | 1 | 0.65mi |
| 9137 Aegean Cir Lehigh Acres, FL | 2.0 | 2.0 | 1120 | $1,474 | $1.32 | 3d | 1 | 0.68mi |
| 9137 Aegean Cir Lehigh Acres, FL | 2.0 | 2.0 | 1120 | $1,474 | $1.32 | 23d | 1 | 0.68mi |
| 9161 Aegean Cir Lehigh Acres, FL | 2.0 | 2.0 | 1120 | $1,650 | $1.47 | 13d | 1 | 0.73mi |
| 1120 Vineyard St Lehigh Acres, FL | 2.0 | 1.0 | 1028 | $1,300 | $1.26 | 23d | 1 | 0.74mi |
| 1113 Vineyard St Lehigh Acres, FL | 3.0 | 2.0 | 1004 | $1,500 | $1.49 | 23d | 1 | 0.77mi |
| 18461 Copperhead Ct N #444 Lehigh Acres, FL | 2.0 | 2.0 | 1120 | $2,300 | $2.05 | 23d | 1 | 0.85mi |
| 18411 Copperhead Dr #346 Lehigh Acres, FL | 2.0 | 2.0 | 1061 | $1,695 | $1.60 | 21d | 1 | 0.87mi |
| 18451 Copperhead Dr #522 Lehigh Acres, FL | 2.0 | 2.0 | 1120 | $1,895 | $1.69 | 23d | 1 | 0.92mi |
| 26 Alabama Rd S Lehigh Acres, FL | 2.0 | 1.0 | 920 | $1,650 | $1.79 | 21d | 1 | 1.00mi |
| 1000 Monroe Dr Lehigh Acres, FL | 3.0 | 2.0 | 984 | $1,650 | $1.68 | 23d | 1 | 1.04mi |
| 907 Laredo Ave Lehigh Acres, FL | 1.0 | 1.0 | 636 | $1,000 | $1.57 | 23d | 1 | 1.05mi |
| 201 Alabama Rd S Lehigh Acres, FL | 3.0 | 1.0 | 920 | $1,275 | $1.39 | 2d | 1 | 1.12mi |
| 11 California Rd Lehigh Acres, FL | 1.0 | 1.0 | 683 | $1,450 | $2.12 | 23d | 1 | 1.13mi |
| 704 W Cleveland Ln Lehigh Acres, FL | 2.0 | 1.0 | 816 | $1,400 | $1.72 | 23d | 1 | 1.24mi |
| 9 Hamlin Ct Lehigh Acres, FL | 1.0 | 1.5 | 807 | $950 | $1.18 | 3d | 1 | 1.28mi |
| 44 Tangelo Ct Lehigh Acres, FL | 2.0 | 2.0 | 812 | $1,150 | $1.42 | 3d | 1 | 1.29mi |
| 47 Tangelo Ct Lehigh Acres, FL | 2.0 | 2.0 | 812 | $1,150 | $1.42 | 23d | 1 | 1.30mi |
| 46 Hamlin Ct Lehigh Acres, FL | 2.0 | 2.0 | 812 | $1,050 | $1.29 | 23d | 1 | 1.33mi |
| 3 Desert Candle Cir Lehigh Acres, FL | 2.0 | 2.0 | 853 | $1,200 | $1.41 | 23d | 1 | 1.35mi |
| 10554 Quincy Ct Lehigh Acres, FL | 2.0 | 2.0 | 1004 | $1,300 | $1.29 | 18d | 1 | 1.35mi |
| 10 Tangerine Ct Lehigh Acres, FL | 2.0 | 2.0 | 812 | $1,200 | $1.48 | 18d | 1 | 1.36mi |
| 1232 Village Lakes Blvd Lehigh Acres, FL | 1.0–2.0 | 1.0–2.0 | 734 | $1,449 | $1.97 | 14d | 17 | 1.36mi |
| 10525 Putnam Ct Lehigh Acres, FL | 2.0 | 2.0 | 1014 | $1,250 | $1.23 | 19d | 1 | 1.37mi |
| 216 Oregon Way Lehigh Acres, FL | 3.0 | 1.0 | 920 | $1,250 | $1.36 | 21d | 1 | 1.38mi |
| 102 Connecticut Rd Lehigh Acres, FL | 2.0 | 1.0 | 816 | $1,300 | $1.59 | 23d | 1 | 1.38mi |
| 10578 Quincy Ct Unit 1 Lehigh Acres, FL | 2.0 | 2.0 | 899 | $1,275 | $1.42 | 23d | 1 | 1.39mi |
| 6 Aztec Lily Ln Lehigh Acres, FL | 2.0 | 2.0 | 853 | $1,500 | $1.76 | 19d | 1 | 1.44mi |
| 6 Aztec Lily Ln Lehigh Acres, FL | 2.0 | 2.0 | 853 | $2,600 | $3.05 | 23d | 1 | 1.44mi |
| 423 Morgan Cir S Lehigh Acres, FL | 3.0 | 1.0 | 920 | $1,450 | $1.58 | 23d | 1 | 1.47mi |
| 10625 Windsmont Ct Lehigh Acres, FL | 3.0 | 2.0 | 1080 | $1,350 | $1.25 | 23d | 1 | 1.48mi |
| 3202 21st St SW Lehigh Acres, FL | 3.0 | 2.0 | 1100 | $1,920 | $1.75 | 2d | 1 | 1.49mi |
Listing history 4 events
-
2026-04-24$140,000
-
2026-04-24historical
-
1995-09-18soldstatus $48,500
-
1989-11-28soldstatus $45,000
ⓘ Source: listings_history table (triggers on properties + properties_extension) + one-shot
backfill from property_details.listing_events for pre-trigger history.
Tax reassessment forecast FL · Resets to sale price
- Current annual tax
- $2,085 · $174/mo
- Projected year-2 tax
- $2,085 · $174/mo
- Expected delta
- $0/yr ($0/mo · 0.0%)
ⓘ Screening estimate from a state-policy table — verify with the county assessor before closing.
Climate risk First Street
- Flood 1/10 Low FEMA zone X (unshaded) · 0% chance over 30 yrs
- Wildfire 1/10 Low
- Heat 10/10 Extreme 7 d/yr ≥107°F today · 28 d/yr by 30 yrs out
- Wind 10/10 Extreme 99% chance of damaging wind over 30 yrs
- Air quality 2/10 Low 1 unhealthy d/yr today · 1 by 30 yrs out
Nearby sold comps map
Loading sold comps map…
Walkable amenities ~0.75 mi
Loading nearby amenities…
Taxation est. · year 1
- Rental income
- $17,654
- − Mortgage interest
- −$7,842
- − Property taxes
- −$2,085
- − Insurance
- −$700
- − Repairs & maintenance
- −$1,412
- − Management
- −$1,412
- − Depreciation
- −$4,073
- Taxable income
- $129
- Est. tax owed @ 24.0%
- −$31
- After-tax cash flow
- $2,320/yr
For passive investors: Depreciation is non-cash, so a rental often shows a tax loss while cash-flowing — sheltering income. Rental losses are passive: they offset passive income freely, and up to $25,000/yr can offset ordinary (W-2) income if you actively participate and your MAGI is under $100k (phasing out to $0 by $150k); unused losses carry forward. On sale, claimed depreciation is recaptured at up to 25%, and gains may owe capital-gains tax (a 1031 exchange can defer both). Figures are a year-1 estimate at your 24.0% rate — not tax advice; consult a CPA.
Schools (NCES district)
- District
- Lee
- NCES district ID
- 1201080
- Math proficiency
- 47% ▼ -11.00%
- Reading proficiency
- 50% ▼ -4.00%
- Median HH income
- $49,518
- Composite
- 41.49/100
- National rank
- #3458
- State rank
- #42 of 73 in FL
Livability — Lehigh Acres
- Score
- 59/100
- State rank
- #826
- US rank
- #20055
Category grades
Schools grade is shown separately in the Schools card above.
Census & demographics
- Census place
- Lehigh Acres, FL
- County
- Lee County · 788,662 people
- City population
- 130,638
- Metro
- Cape Coral-Fort Myers, FL
- Population (ZIP)
- 27,967
- Household income
- $51,417
- Rent vs Own
- Severe rent burden
- 1027.0
Population outlook (Lee County) Hauer SSP2
- Today (2025)
- 871,946 people
- By 2030
- 955,468 · +9.6%
- By 2040
- 1,113,587 · +27.7%
- By 2050
- 1,256,891 · +44.1%
- By 2075
- 1,560,270 · +78.9%
- By 2100
- 1,726,848 · +98.0%
Race, ethnicity, and origin ACS 2023
- Neighborhood character
- Diverse neighborhood (Simpson 0.63)
- Race & ethnicity
- Hispanic / Latino 44% White 41% Two or more races 21% Black 9% Asian 1%
- Hispanic origin (detail)
- Mexican 7% Puerto Rican 9% Cuban 18% Dominican 2%
- Common ancestry
- Hispanic 3% Romanian 2% Lithuanian 1%
- Foreign-born
- 28% · Canada, Jamaica
- Languages at home
- 59% English-only · Spanish 36% French/Haitian/Cajun 3% Tagalog/Filipino 1%
Political lean MEDSL · Lee
- 2024 margin
- Strong R (+28.4) · D 35.5% · R 63.9%
- 2008→2024 swing
- -18.0pp toward R · 2008: -10.4pp · 2024: -28.4pp
- All cycles
- 2024: R+28.4 2020: R+19.2 2016: R+20.4 2012: R+16.6 2008: R+10.4
Not yet ingested
- Civics
- —
Market trends
- HPI YoY
- ▼ -86.78%
- Current HPI
- 348.8631
- Rent YoY
- ▼ -0.77%
- Metro
- Cape Coral-Fort Myers, FL
- State GDP YoY
- ▲ 3.28%
- F500 in state
- 36
Industry mix (Fortune 500 HQ in FL)
| Industry | F500 HQs | Revenue |
|---|---|---|
| Industrial Technology | 2 | $29B |
|
||
| Insurance | 2 | $17B |
|
||
| Retail | 1 | $60B |
|
||
| Technology Distribution | 1 | $58B |
|
||
| Homebuilding | 1 | $35B |
|
||
| Technology Manufacturing | 1 | $35B |
|
||
Price history
+211.1% since first listed4 events — show timeline
- 2026-04-24 Listing Removed — FORTMLS
- 2026-04-24 Listed $140,000 FORTMLS
- 1995-09-18 Sold (Public Records) $48,500 Public Records
- 1989-11-28 Sold (Public Records) $45,000 Public Records
Property tax history
+9.8%/yrLatest (2025): $2,085 · +1.4% YoY. Source: county tax records.
Cash-flow waterfall
monthlySold comps — $/sqft
last 12 mo · ≤1 miLoading sold comps…