 Triplex
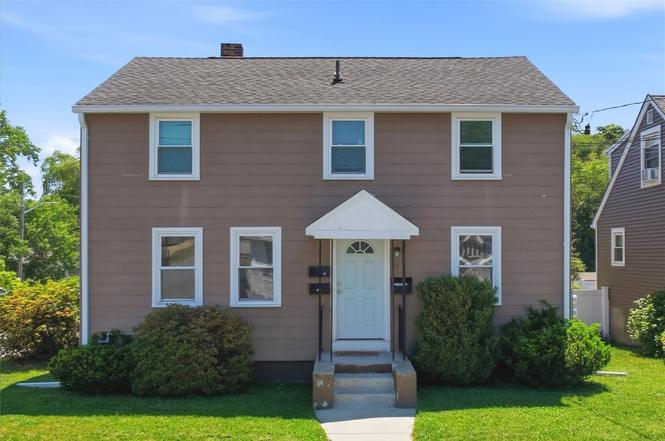
2 Redfern St · East Providence, RI
Flood risk No data
- FEMA flood zone
- —
- Chance of flooding over 30 yrs
- —
- Est. flood insurance / yr
- —
Fire risk No data
- Est. fire insurance / yr
- —
Heat risk No data
- Hot days now (above threshold)
- —
- Hot days in 30 yrs
- —
Wind risk No data
- Chance of severe wind over 30 yrs
- —
Air-quality risk No data
- Unhealthy air days now
- —
- Unhealthy air days in 30 yrs
- —
Risk factors via First Street. Map © Google.
Why this score? — see what drove the C grade
The composite is a weighted blend of 9 inputs, each scored 0–100. Each bar is that input's sub-score; the figure is the points it added to the 100-point composite (weight × sub-score).
- Cash flow +23.4/30.0
- DSCR +7.5/10.0
- ARV discount +7.4/15.0
- 1% rule +5.8/10.0
- Livability +3.7/5.0
- Rent growth +2.6/5.0
- Condition / age +2.5/5.0
- Schools +2.2/10.0
- Appreciation +0.0/10.0
$524,900
🖨 Deal sheet (PDF) 📄 Offer letter ✓ Due diligence
Multi-family units
County records classify this as Multi-Family (2-4 Unit). Listing-text estimate: 3 units. confirmed
Listing remarks MLS
LOCATION, LOCATION, LOCATION! THIS 3 FAMILY IS A RARE FIND LOCATED IN THE HIGHLY DESIRABLE NEIGHBORHOOD OF KENT HEIGHTS! THIS PROPERTY HAS BEEN MODERNIZED AND UPDATED THROUGH OUT. THE 1ST FLOOR UNIT FEATURES 3 BEDROOMS, HARDWOOD FLOORS, AND OVER 1,000 SQ FT OF LIVING SPACE. THE 2ND FLOOR HAS 2 (1) BEDROOM UNITS THAT ARE IN IMPECCABLE CONDITION AS WELL. OTHER FEATURES INCLUDE UPDATED MECHANICS, A NEWER ROOF, REPLACEMENT WINDOWS, CORNER LOT, AND PLENTY OF PARKING, PLUS MORE! BELOW MARKET RENTS DUE TO LONG TERM TENANTS.
Key facts
- 3,920 sq ft lot
- 4 parking spots
- Built 1920
Property features AI
Finance
- Financial info: Building has three units with existing rents: one unit currently renting month-to-month, one unit showing actual rent $1,550, market rents for units estimated around $1,500–$1,600 for one-bedrooms and $2,000–$2,200 for the three-bedroom
- HOA & community: Nearby amenities: golf, marina, public transportation, restaurants, shopping, highway access, near schools
Exterior
- Parking: No garage; 4 parking spaces (total)
- Utilities: Sewer connected; Water connected (water tap fee); Electrical service approximately 100 amps
- Home design: Multi-family property with 3 units in 1 building; 2 stories; Above-grade finished area approximately 2,200
- Construction: Drywall and shingle siding exterior; Foundation: combination with concrete perimeter
- Exterior features: Corner lot
Interior
- Kitchen: Oven; Range
- Bedrooms: One-bedroom units (two units); Three-bedroom unit (one unit)
- Flooring: Hardwood
- Bathrooms: Three full bathrooms (total in building)
- Heating & cooling: Gas baseboard heating; Window air conditioning units
- Interior features: Hardwood flooring; Bathtub; Tub/shower; Interior steps
- Laundry & utility: Common area laundry; Common water heater; Gas water heater; Tankless water heater; Utility room; Storage room
Neighborhood map
What this means for you Summary
Snapshot
- This is a 1×3bd/1.5ba + 2×1bd/1ba units multifamily listed at $525k.
Deal economics
- At list price, monthly cash flow is $975 ($12k/yr) — positive. Per door: $325/mo.
- The deal already cash-flows at list — no discount required.
- Meets the 1% rule at list price ($6k rent vs $525k).
- Cap rate 8.5% vs local median 3.2% in East Providence — top-decile yield for the area; either an underpriced asset or a hidden risk that comps aren't pricing in. Stress-test before assuming the spread holds.
Location & tenants
- Location reads 74/100 on livability (#12 in RI, #4,784 nationally) — a middle-class / working-renter tenant base. Strengths: crime A+, housing A+, health & safety A+; Watch: schools D-, amenities F, commute F.
- East Providence (suburban): math 18% / reading 31% proficiency, ranked #26 of 39 in RI (top 67%) — low school quality limits family demand, transient renter base, plan for 1-2y turnover.
- Market conditions: Rents flat; 61 active listings in the ZIP; 2 comparable units currently listed for rent nearby; solid renter incomes; 776 units permitted in Providence County in 2024 (229 in 5+ unit buildings).
- At $5,651/mo this rent would consume 80% of the median local household income ($84k/yr) (locally 427% of renters already pay >50% of income on rent) — very limited rent-growth headroom before tenants either downsize or default.
Forward outlook
- Local home prices are declining (-3.0%/yr); year-one equity from $4k of loan paydown is wiped out by about $16k of value loss. Plan a longer hold.
- Providence County population projected at +5% by 2050 — modest demand growth; plan on rents tracking national, not racing it.
Negotiation context
- Only 2 days on market — expect competitive offers; lowballing is unlikely to land.
- 5 sale attempts since 28y ago with the ask held roughly flat each time — persistent listings suggest the price (not the market) is what's stuck; bring a comps-based counter.
- Current owner paid $350k; 50% above their basis — modest negotiation headroom, anchor on the comps not their cost.
Risks & watch-outs
- Watch-outs: built in 1920 — expect roof / HVAC / electrical / plumbing capex.
Questions for the listing agent
- Can we see the unit-by-unit rent roll, current vacancy, and any below-market leases? What's the average tenancy length?
- What capital expenditures (roof, boiler, parking lot, exteriors) have been made in the last 5 years, and what's planned in the next 2?
- Built in 1920 — when were the roof, HVAC, electrical panel, plumbing, and water heater last replaced?
- Is there a deadline driving the sale (1031 exchange, divorce, estate, relocation)? That informs how much negotiation room exists.
- Schools are D-rated, which usually means shorter tenancies and higher turnover. Who's the typical renter profile here, and what's been the actual vacancy rate?
- What's the average days-on-market for RENTAL listings here right now (not sales)? A rising rental-DOM trend means longer vacancies and softer asking-rent achievability than the comps imply.
- What's the recent tenant-quality profile in this submarket — average credit score on applications, eviction rate, late-payment / NSF rate, and stable-employment percentage? A property-management company in the area should have these aggregated.
- How much new apartment / multifamily construction is in the pipeline within 1–3 miles? Heavy new supply (>2% of stock underway) typically softens rents 12–24 months out; light construction supports rent growth.
Investment metrics
- 1% rule
- 1.08% ✓
- Cap rate
- 8.52%
- Cash-on-cash
- 7.96%
- DSCR
- 1.35
- GRM
- 7.7
CMA / ARV
- ARV (on-the-fly)
- $524,280
- Comps found
- 1
Show comp detail 1 sale within ~0.75 mi
| Address | Dist | Beds/Ba | Sqft | Sold | Price | $/sf | Match |
|---|---|---|---|---|---|---|---|
| 18 20 Inglewood Rd | 0.64mi | 4/2.0 | 2,160 (+6%) | 15mo | $555,999 | $257 | 44 |
Match score weights: distance 35% · size 25% · config 20% · recency 20%. Top-matched comps best support the ARV.
Projected returns pro-forma
-3.0% appreciation · 0.57% rent growth · sell at horizon
- IRR
- -6.9%
- Equity multiple
- 0.75×
- Total profit
- $-36,467
- Equity at exit
- $78,264
- IRR
- -0.5%
- Equity multiple
- 0.97×
- Total profit
- $-4,539
- Equity at exit
- $45,384
Cash invested: $146,972 (down + closing). Projections, not guarantees.
Landlord ↔ Tenant lean methodology
- Overall (STATE)
- 31 Tenant-Leaning
- State Rhode Island
- 31 Tenant-Leaning · D+8
- County
- — inherits STATE
- City
- — inherits STATE
ZIP-level market 02915
- Rents YoY
- 0.6%
- Active inventory
- 61
- Price-to-rent
- 18.5×
Monthly cashflow live
- Estimated rent
- $5,651 high interval (Pro) →
- Mortgage (P&I)
- −$2,753
- Tax from tax record
- −$518 /mo · $6,219/yr
- Insurance
- −$219
- HOA
- −$0
- Vacancy / Maint / Mgmt
- −$1,187
- Net cashflow
- $975
Break-even live
Sensitivity live
| Price | -10% $1,272 | -5% $1,123 | +0% $975 | +5% $826 | +10% $678 |
|---|---|---|---|---|---|
| Rent | -10% $528 | -5% $751 | +0% $975 | +5% $1,198 | +10% $1,421 |
| Rate | -1.0pp $1,239 | -0.5pp $1,108 | base $975 | +0.5pp $839 | +1.0pp $700 |
3-unit breakdown (identical units grouped — click to expand)
| Units | Beds | Baths | Est. rent |
|---|---|---|---|
| 1× unit | 3 | 1.5 | $2,362 |
| 2× units | 1 | 1 | $3,288 |
| #2 | 1 | 1 | $1,644 |
| #3 | 1 | 1 | $1,644 |
| Total (3 units) | $5,651 | ||
UW: 25.0% down · 7.5% · 30yr · 1.5% tax · 5.0% vac · 8.0% maint · 8.0% mgmt
Financing live
Cash to close
- Down payment
- $131,225
- Closing costs
- $15,747
- Reserves months
- —
- Total cash needed
- —
Loan-product check · same deal, 3 products live
Conventional
25% down · 7.5% · 30yr
- Down + closing
- —
- Monthly P&I
- —
- Monthly cashflow
- —
- DSCR
- —
- Eligible?
- —
Personal DTI + credit; lowest rate.
DSCR
20% down · 8.5% · 30yr
- Down + closing
- —
- Monthly P&I
- —
- Monthly cashflow
- —
- DSCR
- —
- Eligible?
- —
No personal income docs; deal must DSCR.
Hard money
10% down · 12.0% · 12mo
- Down + closing
- —
- Monthly P&I
- —
- Monthly cashflow
- —
- DSCR
- —
- Eligible?
- —
Short-term bridge; refi at stabilization.
Rent comps 2 comps
| Address | Beds | Baths | Sqft | Rent | $/sqft | DOM | Units | Dist |
|---|---|---|---|---|---|---|---|---|
| 138 Martin St East Providence, RI | 3.0 | 2.0 | 2009 | $2,800 | $1.39 | 44d | 1 | 0.54mi |
| 160 Fort St East Providence, RI | 3.0 | 2.0 | 2468 | $2,950 | $1.20 | 24d | 1 | 1.49mi |
Listing history 2 events
-
2026-06-13remarks 699-char remark
-
2026-06-13$524,900 Pending 2 DOM
ⓘ Source: listings_history table (triggers on properties + properties_extension) + one-shot
backfill from property_details.listing_events for pre-trigger history.
Tax reassessment forecast RI · Partial reset (capped growth)
- Current annual tax
- $6,219 · $518/mo
- Projected year-2 tax
- $7,387 · $616/mo
- Expected delta
- +$1,168/yr (+$97/mo · 18.8%)
ⓘ Screening estimate from a state-policy table — verify with the county assessor before closing.
Nearby sold comps map
Loading sold comps map…
Walkable amenities ~0.75 mi
Loading nearby amenities…
Taxation est. · year 1
- Rental income
- $67,812
- − Mortgage interest
- −$29,403
- − Property taxes
- −$6,219
- − Insurance
- −$2,624
- − Repairs & maintenance
- −$5,425
- − Management
- −$5,425
- − Depreciation
- −$15,270
- Taxable income
- $3,446
- Est. tax owed @ 24.0%
- −$827
- After-tax cash flow
- $10,869/yr
For passive investors: Depreciation is non-cash, so a rental often shows a tax loss while cash-flowing — sheltering income. Rental losses are passive: they offset passive income freely, and up to $25,000/yr can offset ordinary (W-2) income if you actively participate and your MAGI is under $100k (phasing out to $0 by $150k); unused losses carry forward. On sale, claimed depreciation is recaptured at up to 25%, and gains may owe capital-gains tax (a 1031 exchange can defer both). Figures are a year-1 estimate at your 24.0% rate — not tax advice; consult a CPA.
Schools (NCES district)
- District
- East Providence
- NCES district ID
- 4400330
- Math proficiency
- 18% ▼ -8.00%
- Reading proficiency
- 31% ▼ -5.00%
- Median HH income
- $51,011
- Composite
- 21.69/100
- National rank
- #8274
- State rank
- #26 of 39 in RI
Livability — East Providence
- Score
- 74/100
- State rank
- #12
- US rank
- #4784
Category grades
Schools grade is shown separately in the Schools card above.
Census & demographics
- Census place
- East Providence, RI
- County
- Providence County · 548,917 people
- City population
- 38,586
- Metro
- Providence-Warwick, RI-MA
- Population (ZIP)
- 16,752
- Household income
- $84,414
- Rent vs Own
- Severe rent burden
- 427.0
Population outlook (Providence County) Hauer SSP2
- Today (2025)
- 653,469 people
- By 2030
- 660,819 · +1.1%
- By 2040
- 672,747 · +3.0%
- By 2050
- 683,741 · +4.6%
- By 2075
- 720,435 · +10.2%
- By 2100
- 741,582 · +13.5%
Race, ethnicity, and origin ACS 2023
- Neighborhood character
- Predominantly White (77%)
- Race & ethnicity
- White 77% Two or more races 10% Hispanic / Latino 7% Black 3% Asian 2%
- Hispanic origin (detail)
- Mexican 4% Puerto Rican 2%
- Common ancestry
- Russian 17% Lithuanian 10% Slovak 3%
- Foreign-born
- 8% · Canada, China
- Languages at home
- 85% English-only · Other Indo-European 6% Spanish 5% French/Haitian/Cajun 2%
Political lean MEDSL · Providence
- 2024 margin
- D (+14.4) · D 56.1% · R 41.7% · Other 2.2%
- 2008→2024 swing
- -20.0pp toward R · 2008: 34.4pp · 2024: 14.4pp
- All cycles
- 2024: D+14.4 2020: D+22.9 2016: D+21.2 2012: D+34.9 2008: D+34.4
Not yet ingested
- Civics
- —
Market trends
- HPI YoY
- ▼ -422.21%
- Current HPI
- 362.8313
- Rent YoY
- ▲ 0.57%
- Metro
- Providence-Warwick, RI-MA
- State GDP YoY
- ▲ 2.25%
- F500 in state
- 10
Industry mix (Fortune 500 HQ in RI)
| Industry | F500 HQs | Revenue |
|---|---|---|
| Healthcare | 1 | $373B |
|
||
| Food Distribution | 1 | $31B |
|
||
| Aerospace / Defense | 1 | $14B |
|
||
| Financial Services | 1 | $8B |
|
||
| Consumer Goods | 1 | $4B |
|
||
Price history
+425.4% since first listed16 events — show timeline
- 2026-06-13 Pending — RIS
- 2026-06-10 Listed $524,900 RIS
- 2021-06-21 Sold (MLS) $350,000 RIS
- 2021-06-18 Sold (Public Records) $350,000 Public Records
- 2021-05-05 Pending — RIS
- 2021-04-25 Listing Removed — RIS
- 2021-04-25 Listed $338,900 RIS
- 2021-03-24 Listed $365,000 RIS
- 2002-05-03 Sold (Public Records) $142,000 Public Records
- 2002-05-03 Sold (MLS) $142,000 RIS
- 2002-03-30 Listing Removed — RIS
- 2002-03-27 Listed $149,900 RIS
- 1998-08-28 Sold (Public Records) $92,000 Public Records
- 1998-08-27 Sold (MLS) $92,000 RIS
- 1998-06-24 Listing Removed — RIS
- 1998-02-03 Listed $99,900 RIS
Property tax history
+3.2%/yrLatest (2025): $6,219 · +11.4% YoY. Source: county tax records.
Cash-flow waterfall
monthlySold comps — $/sqft
last 12 mo · ≤1 miLoading sold comps…