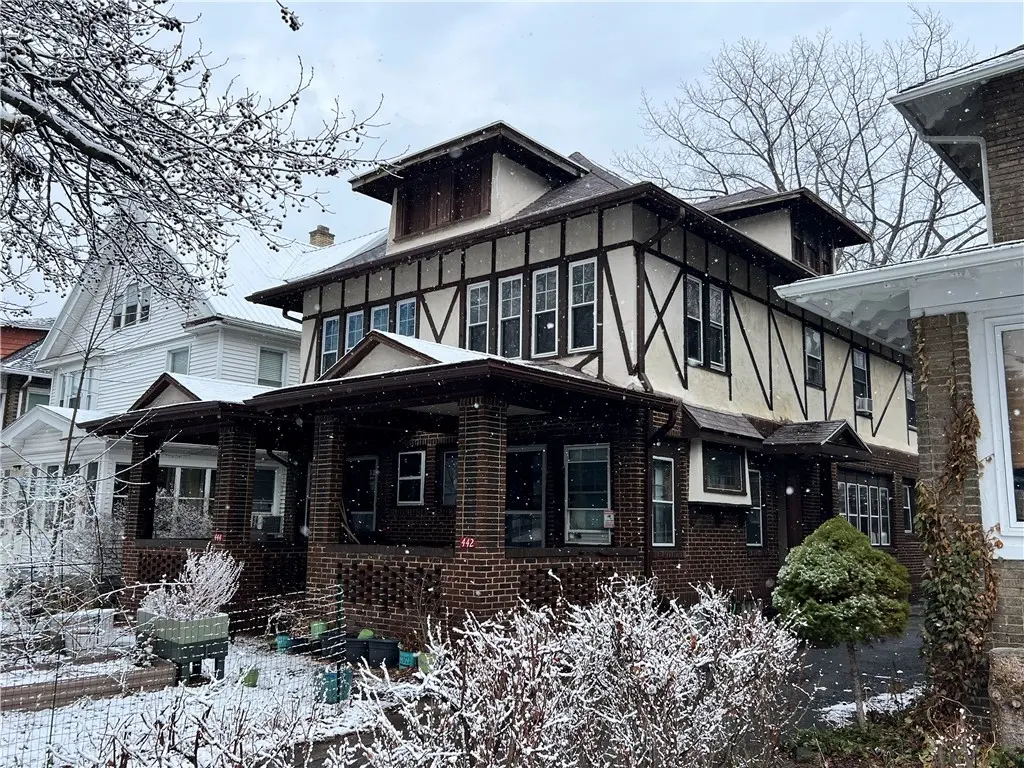
442-444 Maplewood Ave Ave · Rochester, NY
Flood risk 1/10 · Minimal
- FEMA flood zone
- X (unshaded)
- Chance of flooding over 30 yrs
- 0.0%
- Est. flood insurance / yr
- $473 – $860
Fire risk 3/10 · Minor
- Est. fire insurance / yr
- $691 – $1,283
Heat risk 2/10 · Minimal
- Hot days now (above 95°F)
- 7 days/yr
- Hot days in 30 yrs
- 15 days/yr
Wind risk 1/10 · Minimal
- Chance of severe wind over 30 yrs
- —
Air-quality risk 2/10 · Minimal
- Unhealthy air days now
- 1 days/yr
- Unhealthy air days in 30 yrs
- 2 days/yr
Risk factors via First Street. Map © Google.
Why this score? — see what drove the D+ grade
The composite is a weighted blend of 9 inputs, each scored 0–100. Each bar is that input's sub-score; the figure is the points it added to the 100-point composite (weight × sub-score).
- Cash flow +20.3/30.0
- DSCR +6.5/10.0
- 1% rule +5.1/10.0
- ARV discount +4.1/15.0
- Livability +3.8/5.0
- Rent growth +2.5/5.0
- Condition / age +2.5/5.0
- Appreciation +2.2/10.0
- Schools +1.9/10.0
$170,000
🖨 Deal sheet 📄 Offer letter ✓ Due diligence
Listing remarks MLS
This Historic Upscale Maplewood Ave Neighborhood Duplex is a Rare Opportunity for Investors. Both Sides are approx 1500 SF and Offer 3 Large Bedrooms, a Full Bath, Private Front Porches, Private Rear and Side Entrances, Off Street Parking, 2 Car Garage and Garage Door Openers, Hardwood Floors, Natural Woodwork, Newer Boilers, Some Newer Windows, Basement and Attic Storage, Separate Utilities, and Much More. With Maplewood and Seneca Parks only a Walk, Jog, or Bike Ride Away, this Location is Prime for the Recreational Enthusiast. Opportunities Such as This are Limited So Call Today!!!
Key facts
- 5,227 sq ft lot
- 2 garage spots
- Built 1910
Neighborhood map
What this means for you Summary
Snapshot
- This is a 6-bed/2.0-bath townhouse listed at $170k.
Deal economics
- At list price, monthly cash flow is $218 ($3k/yr) — positive.
- The deal already cash-flows at list — no discount required.
- Meets the 1% rule at list price ($2k rent vs $170k).
Location & tenants
- Location reads 76/100 on livability (#222 in NY, #3,482 nationally) — a middle-class / working-renter tenant base. Strengths: commute A+, cost of living A+, housing A+; Watch: schools D+, crime F, employment F.
- Rochester City School District (urban): math 21% / reading 26% proficiency, ranked #589 of 590 in NY (top 100%) — low school quality limits family demand, transient renter base, plan for 1-2y turnover; 82% free/reduced lunch — lower-income household profile, screen leases tightly.
- Market conditions: 71 active listings in the ZIP; 1,169 units permitted in Monroe County in 2024 (591 in 5+ unit buildings).
Forward outlook
- Local home prices are declining (-3.0%/yr); year-one equity from $1k of loan paydown is wiped out by about $5k of value loss. Plan a longer hold.
- Monroe County population projected to shrink 6% by 2050 — rents likely to lag national; underwrite the cash flow, not the appreciation.
Negotiation context
- Only 0 days on market — expect competitive offers; lowballing is unlikely to land.
- 2 sale attempts since 14y ago with the ask held roughly flat each time — persistent listings suggest the price (not the market) is what's stuck; bring a comps-based counter.
Risks & watch-outs
- Watch-outs: built in 1910 — expect roof / HVAC / electrical / plumbing capex.
Questions for the listing agent
- Built in 1910 — when were the roof, HVAC, electrical panel, plumbing, and water heater last replaced?
- Is there a deadline driving the sale (1031 exchange, divorce, estate, relocation)? That informs how much negotiation room exists.
- Schools are D-rated, which usually means shorter tenancies and higher turnover. Who's the typical renter profile here, and what's been the actual vacancy rate?
- Crime grade is F in this area — have there been break-ins, vandalism, or insurance claims at this property in the last 3 years? What carrier currently insures it and at what premium?
- The area grade is low — what's the realistic commute time and amenity access for the typical tenant pool here? Any planned neighborhood developments (good or bad) we should know about?
- What's the average days-on-market for RENTAL listings here right now (not sales)? A rising rental-DOM trend means longer vacancies and softer asking-rent achievability than the comps imply.
- What's the recent tenant-quality profile in this submarket — average credit score on applications, eviction rate, late-payment / NSF rate, and stable-employment percentage? A property-management company in the area should have these aggregated.
- How much new for-sale + rental construction is in the pipeline within 1–3 miles? Heavy new supply typically softens prices + rents 12–24 months out; constrained supply supports both.
Investment metrics
- 1% rule
- 1.01% ✓
- Cap rate
- 7.84%
- Cash-on-cash
- 5.51%
- DSCR
- 1.25
- GRM
- 8.2
CMA / ARV
- ARV (on-the-fly)
- $158,004
- Comps found
- 12
Show comp detail 12 sales within ~0.75 mi
| Address | Dist | Beds/Ba | Sqft | Sold | Price | $/sf | Match |
|---|---|---|---|---|---|---|---|
| 1538 St Paul St | 0.40mi | 6/2.0 | 2,912 (-0%) | 10mo | $169,900 | $58 | 73 |
| 115-117 Electric Ave #115 | 0.47mi | 6/2.0 | 2,776 (-5%) | 13mo | $147,550 | $53 | 59 |
| 62 Raines Park | 0.49mi | 6/2.0 | 3,236 (+11%) | 8mo | $183,000 | $57 | 53 |
| 96-98 Gorsline St | 0.19mi | 5/2.0 (-1) | 2,490 (-15%) | 13mo | $225,000 | $90 | 50 |
| 226-228 Norton St | 0.56mi | 6/2.0 | 2,600 (-11%) | 8mo | $70,000 | $27 | 49 |
| 192-194 Magee Ave | 0.37mi | 5/3.0 (-1) | 2,582 (-12%) | 6mo | $170,000 | $66 | 49 |
| 18-20 Bryan St | 0.59mi | 6/2.0 | 2,688 (-8%) | 12mo | $115,000 | $43 | 48 |
| 614 Conkey Ave | 0.58mi | 6/2.0 | 2,727 (-7%) | 22mo | $100,000 | $37 | 43 |
| 229 Pullman Ave | 0.57mi | 5/2.0 (-1) | 2,755 (-6%) | 20mo | $150,000 | $54 | 42 |
| 901 Lake Ave | 0.57mi | 5/3.0 (-1) | 2,624 (-10%) | 15mo | $108,000 | $41 | 35 |
| 366 Augustine St | 0.70mi | 5/2.0 (-1) | 2,521 (-14%) | 8mo | $175,000 | $69 | 33 |
| 222-224 Selye Ter | 0.73mi | 5/2.0 (-1) | 2,496 (-15%) | 13mo | $127,500 | $51 | 26 |
Match score weights: distance 35% · size 25% · config 20% · recency 20%. Top-matched comps best support the ARV.
Projected returns pro-forma
-3.0% appreciation · 3.0% rent growth · sell at horizon
- IRR
- -7.8%
- Equity multiple
- 0.71×
- Total profit
- $-13,627
- Equity at exit
- $25,348
- IRR
- 1.8%
- Equity multiple
- 1.13×
- Total profit
- $6,076
- Equity at exit
- $14,698
Cash invested: $47,600 (down + closing). Projections, not guarantees.
Landlord ↔ Tenant lean methodology
- Overall (STATE)
- 15 Strongly Tenant-Friendly
- State New York
- 15 Strongly Tenant-Friendly · D+10
- County
- — inherits STATE
- City
- — inherits STATE
ZIP-level market 14613
- Home prices YoY
- -2.0%
- Active inventory
- 71
- Price-to-rent
- 8.2×
Monthly cashflow live
- Estimated rent
- $1,723 medium interval (Pro) →
- Mortgage (P&I)
- −$891
- Tax from tax record
- −$180 /mo · $2,161/yr
- Insurance
- −$71
- HOA
- −$0
- Vacancy / Maint / Mgmt
- −$362
- Net cashflow
- $218
Break-even live
UW: 25.0% down · 7.5% · 30yr · 1.5% tax · 5.0% vac · 8.0% maint · 8.0% mgmt
Financing live
Cash to close
- Down payment
- $42,500
- Closing costs
- $5,100
- Reserves months
- —
- Total cash needed
- —
Loan-product check · same deal, 3 products live
Conventional
25% down · 7.5% · 30yr
- Down + closing
- —
- Monthly P&I
- —
- Monthly cashflow
- —
- DSCR
- —
- Eligible?
- —
Personal DTI + credit; lowest rate.
DSCR
20% down · 8.5% · 30yr
- Down + closing
- —
- Monthly P&I
- —
- Monthly cashflow
- —
- DSCR
- —
- Eligible?
- —
No personal income docs; deal must DSCR.
Hard money
10% down · 12.0% · 12mo
- Down + closing
- —
- Monthly P&I
- —
- Monthly cashflow
- —
- DSCR
- —
- Eligible?
- —
Short-term bridge; refi at stabilization.
Listing history 7 events
-
2026-04-10$170,000
-
2026-04-10historical
-
2020-11-09soldstatus $149,900
-
2012-08-31soldstatus $90,000
-
2012-08-10soldstatus $90,000 592-char remark
Show marketing remark (592 chars)
This Historic Upscale Maplewood Ave Neighborhood Duplex is a Rare Opportunity for Investors. Both Sides are approx 1500 SF and Offer 3 Large Bedrooms, a Full Bath, Private Front Porches, Private Rear and Side Entrances, Off Street Parking, 2 Car Garage and Garage Door Openers, Hardwood Floors, Natural Woodwork, Newer Boilers, Some Newer Windows, Basement and Attic Storage, Separate Utilities, and Much More. With Maplewood and Seneca Parks only a Walk, Jog, or Bike Ride Away, this Location is Prime for the Recreational Enthusiast. Opportunities Such as This are Limited So Call Today!!!
-
2012-04-16$94,900 592-char remark
Show marketing remark (592 chars)
This Historic Upscale Maplewood Ave Neighborhood Duplex is a Rare Opportunity for Investors. Both Sides are approx 1500 SF and Offer 3 Large Bedrooms, a Full Bath, Private Front Porches, Private Rear and Side Entrances, Off Street Parking, 2 Car Garage and Garage Door Openers, Hardwood Floors, Natural Woodwork, Newer Boilers, Some Newer Windows, Basement and Attic Storage, Separate Utilities, and Much More. With Maplewood and Seneca Parks only a Walk, Jog, or Bike Ride Away, this Location is Prime for the Recreational Enthusiast. Opportunities Such as This are Limited So Call Today!!!
-
2005-05-25soldstatus $83,900
ⓘ Source: listings_history table (triggers on properties + properties_extension) + one-shot
backfill from property_details.listing_events for pre-trigger history.
Tax reassessment forecast NY · Partial reset (capped growth)
- Current annual tax
- $2,161 · $180/mo
- Projected year-2 tax
- $2,517 · $210/mo
- Expected delta
- +$356/yr (+$30/mo · 16.5%)
ⓘ Screening estimate from a state-policy table — verify with the county assessor before closing.
Climate risk First Street
- Flood 1/10 Low FEMA zone X (unshaded) · 0% chance over 30 yrs
- Wildfire 3/10 Moderate
- Heat 2/10 Low 7 d/yr ≥95°F today · 15 d/yr by 30 yrs out
- Wind 1/10 Low
- Air quality 2/10 Low 1 unhealthy d/yr today · 2 by 30 yrs out
Nearby sold comps map
Loading sold comps map…
Walkable amenities ~0.75 mi
Loading nearby amenities…
Taxation est. · year 1
- Rental income
- $20,671
- − Mortgage interest
- −$9,523
- − Property taxes
- −$2,161
- − Insurance
- −$850
- − Repairs & maintenance
- −$1,654
- − Management
- −$1,654
- − Depreciation
- −$4,945
- Taxable loss
- −$115
- Est. tax savings @ 24.0%
- +$28
- After-tax cash flow
- $2,649/yr
For passive investors: Depreciation is non-cash, so a rental often shows a tax loss while cash-flowing — sheltering income. Rental losses are passive: they offset passive income freely, and up to $25,000/yr can offset ordinary (W-2) income if you actively participate and your MAGI is under $100k (phasing out to $0 by $150k); unused losses carry forward. On sale, claimed depreciation is recaptured at up to 25%, and gains may owe capital-gains tax (a 1031 exchange can defer both). Figures are a year-1 estimate at your 24.0% rate — not tax advice; consult a CPA.
Schools (NCES district)
- District
- Rochester City School District
- NCES district ID
- 3624750
- Math proficiency
- 21% ▬ 0.00%
- Reading proficiency
- 26% ▲ 4.00%
- Median HH income
- $30,923
- Composite
- 18.98/100
- National rank
- #8850
- State rank
- #589 of 590 in NY
Livability — Rochester
- Score
- 76/100
- State rank
- #222
- US rank
- #3482
Category grades
Schools grade is shown separately in the Schools card above.
Census & demographics
- Census place
- Rochester, NY
- City population
- 432,803
- Population (ZIP)
- 14,740
Population outlook (Monroe County) Hauer SSP2
- Today (2025)
- 759,460 people
- By 2030
- 757,154 · -0.3%
- By 2040
- 740,644 · -2.5%
- By 2050
- 714,443 · -5.9%
- By 2075
- 645,883 · -15.0%
- By 2100
- 547,084 · -28.0%
Race, ethnicity, and origin ACS 2023
- Neighborhood character
- Highly diverse neighborhood (Simpson 0.70)
- Race & ethnicity
- Black 45% White 22% Hispanic / Latino 20% Two or more races 10% Asian 8% Pacific Islander 1%
- Hispanic origin (detail)
- Puerto Rican 16% Dominican 3%
- Common ancestry
- British 2% Serbian 1% Romanian 1%
- Foreign-born
- 13% · Canada, India, Philippines
- Languages at home
- 79% English-only · Spanish 12% Other Asian/Pacific 5% Other Indo-European 3%
Political lean MEDSL · Monroe
- 2024 margin
- D (+19.1) · D 59.5% · R 40.5%
- 2008→2024 swing
- +1.4pp toward D · 2008: 17.7pp · 2024: 19.1pp
- All cycles
- 2024: D+19.1 2020: D+21.0 2016: D+14.1 2012: D+17.4 2008: D+17.7
Not yet ingested
- Civics
- —
Market trends
- HPI YoY
- ▼ -5.56%
- Current HPI
- 274.2485
- Rent YoY
- —
- Metro
- —
- State GDP YoY
- ▲ 2.60%
- F500 in state
- 92
Industry mix (Fortune 500 HQ in NY)
| Industry | F500 HQs | Revenue |
|---|---|---|
| Financial Services | 10 | $950B |
|
||
| Consumer Goods | 9 | $162B |
|
||
| Insurance | 4 | $225B |
|
||
| Telecommunications | 2 | $144B |
|
||
| Pharmaceuticals | 2 | $112B |
|
||
| Media / Entertainment | 2 | $69B |
|
||
Price history
+102.6% since first listed7 events — show timeline
- 2026-04-10 Listing Removed — UNYREIS
- 2026-04-10 Listed $170,000 UNYREIS
- 2020-11-09 Sold (Public Records) $149,900 Public Records
- 2012-08-31 Sold (Public Records) $90,000 Public Records
- 2012-08-10 Sold (MLS) $90,000 UNYREIS
- 2012-04-16 Listed $94,900 UNYREIS
- 2005-05-25 Sold (Public Records) $83,900 Public Records
Property tax history
+3.6%/yrLatest (2025): $2,161 · +0.0% YoY. Source: county tax records.
Cash-flow waterfall
monthlySold comps — $/sqft
last 12 mo · ≤1 miLoading sold comps…