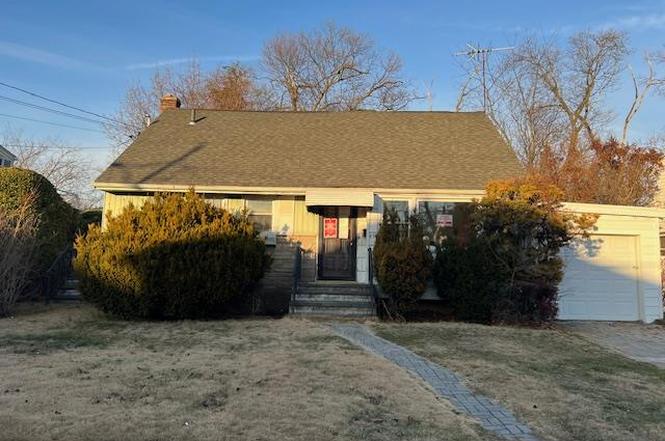
45 Alabama Ave · Hempstead, NY
Flood risk 4/10 · Minor
- FEMA flood zone
- X (unshaded)
- Chance of flooding over 30 yrs
- 0.22%
- Est. flood insurance / yr
- $473 – $860
Fire risk 1/10 · Minimal
- Est. fire insurance / yr
- $691 – $1,283
Heat risk 6/10 · Moderate
- Hot days now (above 96°F)
- 7 days/yr
- Hot days in 30 yrs
- 16 days/yr
Wind risk 6/10 · Moderate
- Chance of severe wind over 30 yrs
- 51.0%
Air-quality risk 4/10 · Minor
- Unhealthy air days now
- 5 days/yr
- Unhealthy air days in 30 yrs
- 8 days/yr
Risk factors via First Street. Map © Google.
Why this score? — see what drove the C+ grade
The composite is a weighted blend of 9 inputs, each scored 0–100. Each bar is that input's sub-score; the figure is the points it added to the 100-point composite (weight × sub-score).
- Cash flow +21.0/30.0
- ARV discount +15.0/15.0
- DSCR +6.7/10.0
- 1% rule +6.0/10.0
- Livability +4.0/5.0
- Schools +2.8/10.0
- Rent growth +2.5/5.0
- Condition / age +2.5/5.0
- Appreciation +0.0/10.0
$437,000
🖨 Deal sheet 📄 Offer letter ✓ Due diligence
Listing remarks
Welcome to 45 Alabama Ave, Hempstead, NY 11550. This single-family residence offers a great opportunity for buyers looking to renovate, customize, or invest in a well-located Long Island neighborhood. The property features a traditional layout with ample living space, a private driveway, and a backyard with room for outdoor enjoyment or future improvements. Conveniently located near local shopping, schools, public transportation, major roadways, and community amenities, this home provides easy access to daily necessities and commuting routes. Ideal for owner-occupants seeking to create their dream home or investors looking for a value-add project.
Key facts
- Private driveway
- Backyard
- 6,962 sq ft lot
Tags
Neighborhood map
What this means for you Summary
Snapshot
- This is a 4-bed/1.0-bath single-family listed at $437k.
Deal economics
- At list price, monthly cash flow is $617 ($7k/yr) — positive.
- The deal already cash-flows at list — no discount required.
- Meets the 1% rule at list price ($5k rent vs $437k).
- Cap rate 8.0% vs local median 5.1% in Hempstead — top-decile yield for the area; either an underpriced asset or a hidden risk that comps aren't pricing in. Stress-test before assuming the spread holds.
Location & tenants
- Location reads 79/100 on livability (#123 in NY, #2,002 nationally) — a middle-class / working-renter tenant base. Strengths: amenities A+, commute A+, health & safety A; Watch: crime C-, cost of living F.
- Hempstead Union Free School District (suburban): math 27% / reading 38% proficiency, ranked #567 of 590 in NY (top 96%) — families likely to look elsewhere, expect single-tenant / working-renter base with shorter leases; 72% free/reduced lunch — lower-income household profile, screen leases tightly.
- Zoned schools: Rhodes Academy of Humanities And The Arts (739 students, 58% FRL); Alverta B Gray Schultz Middle School (math 11% / reading 27%, grade F, #688 of 729 statewide, top 94%, 938 students, 73% FRL); Hempstead High School (math 50% / reading 69%, grade C+, #851 of 1,100 statewide, top 80%, 1,866 students, 63% FRL).
- Market conditions: 167 active listings in the ZIP; 8 comparable units currently listed for rent nearby; rentals leasing fast (median 13d on market — plan ~1-2 weeks tenant-placement turnaround); solid renter incomes; 824 units permitted in Nassau County in 2024 (153 in 5+ unit buildings).
- At $4,806/mo this rent would consume 62% of the median local household income ($93k/yr) (locally 2535% of renters already pay >50% of income on rent) — very limited rent-growth headroom before tenants either downsize or default.
Forward outlook
- Local home prices are declining (-3.0%/yr); year-one equity from $3k of loan paydown is wiped out by about $13k of value loss. Plan a longer hold.
- Nassau County population projected at +7% by 2050 — modest demand growth; plan on rents tracking national, not racing it.
Negotiation context
- Only 13 days on market — expect competitive offers; lowballing is unlikely to land.
Risks & watch-outs
- Watch-outs: built in 1952 — expect roof / HVAC / electrical / plumbing capex.
- Climate carrying-cost: major wind risk, 51% chance of damaging wind over 30y; extreme-heat days projected 7→16/yr by 2055 (HVAC capex compounding) — expect insurance premiums to compound above CPI over the hold.
Questions for the listing agent
- Built in 1952 — when were the roof, HVAC, electrical panel, plumbing, and water heater last replaced?
- Is there a deadline driving the sale (1031 exchange, divorce, estate, relocation)? That informs how much negotiation room exists.
- Schools are D-rated, which usually means shorter tenancies and higher turnover. Who's the typical renter profile here, and what's been the actual vacancy rate?
- What's the average days-on-market for RENTAL listings here right now (not sales)? A rising rental-DOM trend means longer vacancies and softer asking-rent achievability than the comps imply.
- What's the recent tenant-quality profile in this submarket — average credit score on applications, eviction rate, late-payment / NSF rate, and stable-employment percentage? A property-management company in the area should have these aggregated.
- How much new for-sale + rental construction is in the pipeline within 1–3 miles? Heavy new supply typically softens prices + rents 12–24 months out; constrained supply supports both.
Investment metrics
- 1% rule
- 1.10% ✓
- Cap rate
- 7.99%
- Cash-on-cash
- 6.05%
- DSCR
- 1.27
- GRM
- 7.6
CMA / ARV
- ARV (on-the-fly)
- $659,904
- Comps found
- 12
Show comp detail 12 sales within ~0.75 mi
| Address | Dist | Beds/Ba | Sqft | Sold | Price | $/sf | Match |
|---|---|---|---|---|---|---|---|
| 45 Alabama Ave | 0.00mi | 4/2.0 | 1,344 (0%) | 0mo | $485,000 | $361 | 96 |
| 206 W Marshall St | 0.31mi | 4/1.0 | 1,277 (-5%) | 3mo | $550,000 | $431 | 75 |
| 54 W Marshall St | 0.03mi | 3/1.5 (-1) | 1,472 (+10%) | 2mo | $475,000 | $323 | 74 |
| 578 Irene St | 0.46mi | 3/2.0 (-1) | 1,343 (-0%) | 4mo | $660,000 | $491 | 66 |
| 34 Heath Pl | 0.67mi | 4/2.0 | 1,294 (-4%) | 2mo | $640,000 | $495 | 56 |
| 77 Virginia Ave | 0.32mi | 5/2.0 (+1) | 1,493 (+11%) | 3mo | $593,000 | $397 | 55 |
| 311 Cedar St | 0.53mi | 3/3.0 (-1) | 1,405 (+4%) | 1mo | $700,000 | $498 | 54 |
| 138 Windsor Pkwy | 0.50mi | 3/3.0 (-1) | 1,242 (-8%) | 1mo | $735,000 | $592 | 50 |
| 1139 Webber Ave | 0.53mi | 3/2.0 (-1) | 1,224 (-9%) | 4mo | $709,000 | $579 | 48 |
| 34 Frazier St | 0.63mi | 3/1.5 (-1) | 1,472 (+10%) | 1mo | $480,000 | $326 | 46 |
| 248 Kennedy Ave | 0.74mi | 3/2.0 (-1) | 1,474 (+10%) | 3mo | $740,000 | $502 | 38 |
| 141 Brown Ave | 0.73mi | 4/3.0 | 1,541 (+15%) | 4mo | $744,600 | $483 | 30 |
Match score weights: distance 35% · size 25% · config 20% · recency 20%. Top-matched comps best support the ARV.
Projected returns pro-forma
-3.0% appreciation · 3.0% rent growth · sell at horizon
- IRR
- -6.9%
- Equity multiple
- 0.74×
- Total profit
- $-31,320
- Equity at exit
- $65,158
- IRR
- 2.7%
- Equity multiple
- 1.20×
- Total profit
- $24,054
- Equity at exit
- $37,784
Cash invested: $122,360 (down + closing). Projections, not guarantees.
Landlord ↔ Tenant lean methodology
- Overall (STATE)
- 15 Strongly Tenant-Friendly
- State New York
- 15 Strongly Tenant-Friendly · D+10
- County
- — inherits STATE
- City
- — inherits STATE
ZIP-level market 11550
- Active inventory
- 167
- Price-to-rent
- 7.6×
Monthly cashflow live
- Estimated rent
- $4,806 high interval (Pro) →
- Mortgage (P&I)
- −$2,292
- Tax from tax record
- −$705 /mo · $8,463/yr
- Insurance
- −$182
- HOA
- −$0
- Vacancy / Maint / Mgmt
- −$1,009
- Net cashflow
- $617
Break-even live
UW: 25.0% down · 7.5% · 30yr · 1.5% tax · 5.0% vac · 8.0% maint · 8.0% mgmt
Financing live
Cash to close
- Down payment
- $109,250
- Closing costs
- $13,110
- Reserves months
- —
- Total cash needed
- —
Loan-product check · same deal, 3 products live
Conventional
25% down · 7.5% · 30yr
- Down + closing
- —
- Monthly P&I
- —
- Monthly cashflow
- —
- DSCR
- —
- Eligible?
- —
Personal DTI + credit; lowest rate.
DSCR
20% down · 8.5% · 30yr
- Down + closing
- —
- Monthly P&I
- —
- Monthly cashflow
- —
- DSCR
- —
- Eligible?
- —
No personal income docs; deal must DSCR.
Hard money
10% down · 12.0% · 12mo
- Down + closing
- —
- Monthly P&I
- —
- Monthly cashflow
- —
- DSCR
- —
- Eligible?
- —
Short-term bridge; refi at stabilization.
Rent comps 8 comps
| Address | Beds | Baths | Sqft | Rent | $/sqft | DOM | Units | Dist |
|---|---|---|---|---|---|---|---|---|
| 12 Elm Ave Unit 1 Hempstead, NY | 3.0 | 1.0 | 970 | $3,500 | $3.61 | 18d | 1 | 0.61mi |
| 54 Kane Ave Hempstead, NY | 5.0 | 2.0 | 1750 | $4,800 | $2.74 | 43d | 1 | 0.76mi |
| 366 Greenwich St Hempstead, NY | 3.0 | 1.5 | 1504 | $4,000 | $2.66 | 1d | 1 | 0.88mi |
| 533 Greenwich St Unit 1D Hempstead, NY | 3.0 | 2.0 | 1103 | $4,000 | $3.63 | 43d | 1 | 1.03mi |
| 582 Washington Ave West Hempstead, NY | 4.0 | 1.0 | 1440 | $4,500 | $3.12 | 13d | 1 | 1.16mi |
| 130 Hempstead Ave West Hempstead, NY | 1.0–3.0 | 1.0–2.0 | 1113 | $4,726 | $4.25 | 1d | 6 | 1.24mi |
| 111 Hempstead Tpke West Hempstead, NY | 3.0 | 1.0–2.5 | 1226 | $6,776 | $5.52 | 1d | 87 | 1.35mi |
| 345 Walton St West Hempstead, NY | 4.0 | 2.5 | 1274 | $4,525 | $3.55 | 1d | 1 | 1.37mi |
Listing history 2 events
-
2026-01-26status Pending
-
2026-01-13$437,000 Active
ⓘ Source: listings_history table (triggers on properties + properties_extension) + one-shot
backfill from property_details.listing_events for pre-trigger history.
Tax reassessment forecast NY · Partial reset (capped growth)
- Current annual tax
- $8,463 · $705/mo
- Projected year-2 tax
- $8,463 · $705/mo
- Expected delta
- $0/yr ($0/mo · 0.0%)
ⓘ Screening estimate from a state-policy table — verify with the county assessor before closing.
Climate risk First Street
- Flood 4/10 Moderate FEMA zone X (unshaded) · 22% chance over 30 yrs
- Wildfire 1/10 Low
- Heat 6/10 Major 7 d/yr ≥96°F today · 16 d/yr by 30 yrs out
- Wind 6/10 Major 51% chance of damaging wind over 30 yrs
- Air quality 4/10 Moderate 5 unhealthy d/yr today · 8 by 30 yrs out
Nearby sold comps map
Loading sold comps map…
Walkable amenities ~0.75 mi
Loading nearby amenities…
Taxation est. · year 1
- Rental income
- $57,667
- − Mortgage interest
- −$24,479
- − Property taxes
- −$8,463
- − Insurance
- −$2,185
- − Repairs & maintenance
- −$4,613
- − Management
- −$4,613
- − Depreciation
- −$12,713
- Taxable income
- $601
- Est. tax owed @ 24.0%
- −$144
- After-tax cash flow
- $7,265/yr
For passive investors: Depreciation is non-cash, so a rental often shows a tax loss while cash-flowing — sheltering income. Rental losses are passive: they offset passive income freely, and up to $25,000/yr can offset ordinary (W-2) income if you actively participate and your MAGI is under $100k (phasing out to $0 by $150k); unused losses carry forward. On sale, claimed depreciation is recaptured at up to 25%, and gains may owe capital-gains tax (a 1031 exchange can defer both). Figures are a year-1 estimate at your 24.0% rate — not tax advice; consult a CPA.
Schools (NCES district)
- District
- Hempstead Union Free School District
- NCES district ID
- 3614130
- Math proficiency
- 27% ▼ -4.00%
- Reading proficiency
- 38% ▲ 5.00%
- Median HH income
- $48,774
- Composite
- 28.12/100
- National rank
- #6821
- State rank
- #567 of 590 in NY
Livability — Hempstead
- Score
- 79/100
- State rank
- #123
- US rank
- #2002
Category grades
Schools grade is shown separately in the Schools card above.
Census & demographics
- Census place
- Hempstead, NY
- County
- Nassau County · 653,051 people
- City population
- 60,960
- Metro
- New York-Newark-Jersey City, NY-NJ-PA
- Population (ZIP)
- 60,960
- Household income
- $92,677
- Rent vs Own
- Severe rent burden
- 2535.0
Population outlook (Nassau County) Hauer SSP2
- Today (2025)
- 1,409,302 people
- By 2030
- 1,431,482 · +1.6%
- By 2040
- 1,471,607 · +4.4%
- By 2050
- 1,502,845 · +6.6%
- By 2075
- 1,575,403 · +11.8%
- By 2100
- 1,554,356 · +10.3%
Race, ethnicity, and origin ACS 2023
- Neighborhood character
- Diverse neighborhood (Simpson 0.62)
- Race & ethnicity
- Hispanic / Latino 44% Black 43% Two or more races 14% White 7% Asian 2%
- Hispanic origin (detail)
- Mexican 1% Puerto Rican 3% Dominican 4%
- Common ancestry
- Hispanic 4%
- Foreign-born
- 37% · Canada, Jamaica
- Languages at home
- 53% English-only · Spanish 40% French/Haitian/Cajun 4% Other Indo-European 1%
Political lean MEDSL · Nassau
- 2024 margin
- Toss-up / Even · D 47.9% · R 52.1%
- 2008→2024 swing
- -12.6pp toward R · 2008: 8.4pp · 2024: -4.2pp
- All cycles
- 2024: R+4.2 2020: D+9.5 2016: D+5.3 2012: D+6.7 2008: D+8.4
Not yet ingested
- Civics
- —
Market trends
- HPI YoY
- ▼ -297.72%
- Current HPI
- 339.055
- Rent YoY
- —
- Metro
- New York-Newark-Jersey City, NY-NJ-PA
- State GDP YoY
- ▲ 2.60%
- F500 in state
- 92
Industry mix (Fortune 500 HQ in NY)
| Industry | F500 HQs | Revenue |
|---|---|---|
| Financial Services | 10 | $950B |
|
||
| Consumer Goods | 9 | $162B |
|
||
| Insurance | 4 | $225B |
|
||
| Telecommunications | 2 | $144B |
|
||
| Pharmaceuticals | 2 | $112B |
|
||
| Media / Entertainment | 2 | $69B |
|
||
Price history
2 events — show timeline
- 2026-01-26 Pending — OneKey® MLS as Distributed by MLS Grid
- 2026-01-13 Listed $437,000 OneKey® MLS as Distributed by MLS Grid
Property tax history
+4.1%/yrLatest (2024): $8,463 · +61.1% YoY. Source: county tax records.
Cash-flow waterfall
monthlySold comps — $/sqft
last 12 mo · ≤1 miLoading sold comps…