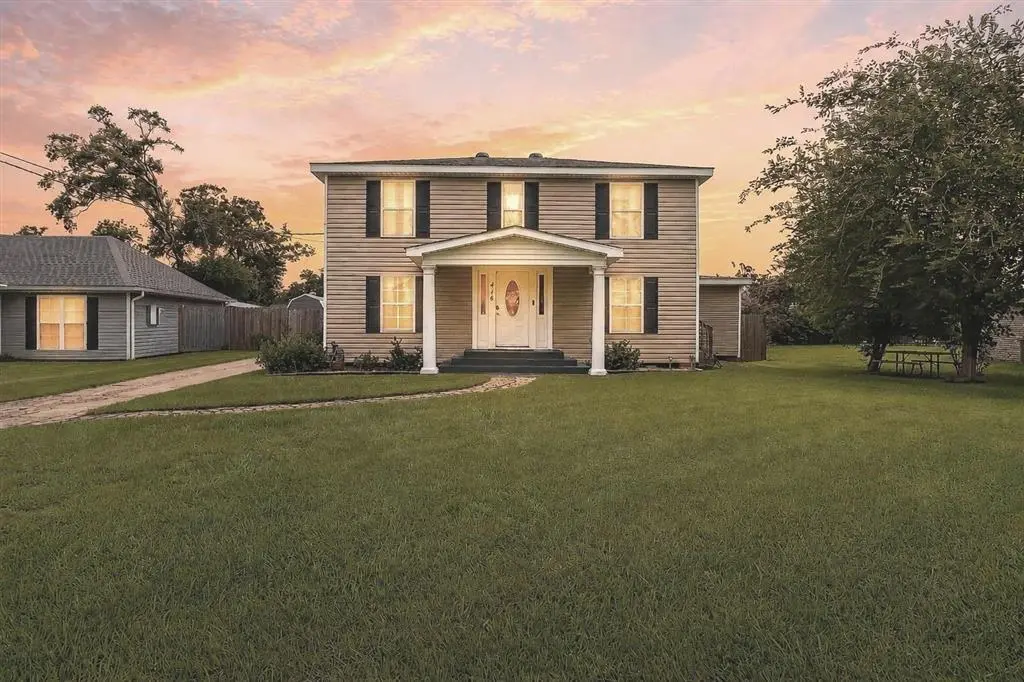
416 Tamarack St · Sulphur, LA
Flood risk 3/10 · Minor
- FEMA flood zone
- X (unshaded)
- Chance of flooding over 30 yrs
- 0.1%
- Est. flood insurance / yr
- $507 – $1,088
Fire risk 2/10 · Minimal
- Est. fire insurance / yr
- $1,269 – $2,357
Heat risk 9/10 · Severe
- Hot days now (above 109°F)
- 7 days/yr
- Hot days in 30 yrs
- 23 days/yr
Wind risk 9/10 · Severe
- Chance of severe wind over 30 yrs
- 99.0%
Air-quality risk 2/10 · Minimal
- Unhealthy air days now
- 1 days/yr
- Unhealthy air days in 30 yrs
- 1 days/yr
Risk factors via First Street. Map © Google.
Why this score? — see what drove the C- grade
The composite is a weighted blend of 9 inputs, each scored 0–100. Each bar is that input's sub-score; the figure is the points it added to the 100-point composite (weight × sub-score).
- Cash flow +23.8/30.0
- DSCR +7.7/10.0
- 1% rule +5.2/10.0
- Rent growth +4.4/5.0
- Livability +3.6/5.0
- Schools +3.1/10.0
- Condition / age +2.5/5.0
- ARV discount +0.0/15.0
- Appreciation +0.0/10.0
$255,000
🖨 Deal sheet (PDF) 📄 Offer letter ✓ Due diligence
Listing remarks MLS
Beautiful two-story home in the heart of Sulphur. Remodeled after Hurricane Laura with high end amenities. This home has a new roof, new interior paint, granite in both kitchen and bathrooms, beautiful light fixtures throughout and new windows. This 4-bedroom, 3-bathroom home boasts a beautiful 14 x 12-foot kitchen with a large gas range, new farm style stainless steel sink, new dishwasher, granite countertops, that includes a waterfall granite breakfast bar with a breakfast nook and new flooring throughout the home. New cabinets throughout home, with two living areas, both with new double French doors, measuring 23 x 12 foot and 20 x 18 foot, both areas are large and will be great for entertaining. A new large deck off the back living area. One bedroom on the first floor with a bathroom. Large utility room on the first floor with ample storage, and a large pantry. A beautifully stained staircase leads to the second floor where the master suite is located with two additional bedrooms and one additional bathroom. Countertops are all granite throughout the home. This home also has a large storage shed with an attached carport. Flood zone X per LSUagcenter.com
Key facts
- Large back deck
- Completely renovated
- Granite countertops
Tags
Property features AI
Exterior
- Utilities: Public water; Public sewer; Electricity connected; Natural gas connected; Water connected
- Home design: Single-family house; Two stories; Updated/remodeled condition; No common walls
- Construction: Vinyl siding; Built as a house
- Exterior features: Patio; Fenced yard with wood privacy fencing; Has a view; Workshop
Interior
- Kitchen: Dishwasher; Gas oven; Gas range; Refrigerator
- Bedrooms: One main-level bedroom
- Bathrooms: Three full bathrooms; One main-level bathroom
- Heating & cooling: Central heating; Heat pump; Natural gas heating; Central air conditioning
- Interior features: Updated/remodeled interior; Therapeutic whirlpool
- Laundry & utility: Washer hookup; Electric dryer hookup; Gas water heater
Neighborhood map
What this means for you Summary
Snapshot
- This is a 4-bed/3.0-bath single-family listed at $255k.
Deal economics
- At list price, monthly cash flow is $488 ($6k/yr) — positive.
- The deal already cash-flows at list — no discount required.
- Meets the 1% rule at list price ($3k rent vs $255k).
Location & tenants
- Location reads 71/100 on livability (#48 in LA) — a middle-class / working-renter tenant base. Strengths: cost of living A+, housing A+, schools A; Watch: crime D-, amenities F, commute F.
- Calcasieu Parish (other): math 30% / reading 44% proficiency, ranked #29 of 98 in LA (top 30%) — families likely to look elsewhere, expect single-tenant / working-renter base with shorter leases.
- Market conditions: Rents rising fast (+7.7%/yr); 294 active listings in the ZIP; 2 comparable units currently listed for rent nearby; 1,298 units permitted in Calcasieu Parish in 2024 (526 in 5+ unit buildings).
- At $2,593/mo this rent would consume 48% of the median local household income ($65k/yr) (locally 197% of renters already pay >50% of income on rent) — very limited rent-growth headroom before tenants either downsize or default.
Forward outlook
- Local home prices are declining (-3.0%/yr); year-one equity from $2k of loan paydown is wiped out by about $8k of value loss. Plan a longer hold.
- Calcasieu County population projected at +11% by 2050 — modest demand growth; plan on rents tracking national, not racing it.
- At projected returns (-3.0% appreciation + 7.7% rent growth), your $71k cash investment doubles in ~9 years — after that, you're playing with house money.
Negotiation context
- Only 3 days on market — expect competitive offers; lowballing is unlikely to land.
- 4 sale attempts since 8y ago with the ask held roughly flat each time — persistent listings suggest the price (not the market) is what's stuck; bring a comps-based counter.
Risks & watch-outs
- Watch-outs: built in 1950 — expect roof / HVAC / electrical / plumbing capex.
- Climate carrying-cost: severe wind risk, 99% chance of damaging wind over 30y; extreme-heat days projected 7→23/yr by 2055 (HVAC capex compounding) — expect insurance premiums to compound above CPI over the hold.
Questions for the listing agent
- Built in 1950 — when were the roof, HVAC, electrical panel, plumbing, and water heater last replaced?
- Is there a deadline driving the sale (1031 exchange, divorce, estate, relocation)? That informs how much negotiation room exists.
- Schools are A-rated — typically a magnet for longer-tenancy family renters. What's the average tenant stay here, and is there a school-zone premium baked into asking?
- Crime grade is D in this area — have there been break-ins, vandalism, or insurance claims at this property in the last 3 years? What carrier currently insures it and at what premium?
- What's the average days-on-market for RENTAL listings here right now (not sales)? A rising rental-DOM trend means longer vacancies and softer asking-rent achievability than the comps imply.
- What's the recent tenant-quality profile in this submarket — average credit score on applications, eviction rate, late-payment / NSF rate, and stable-employment percentage? A property-management company in the area should have these aggregated.
- How much new for-sale + rental construction is in the pipeline within 1–3 miles? Heavy new supply typically softens prices + rents 12–24 months out; constrained supply supports both.
Investment metrics
- 1% rule
- 1.02% ✓
- Cap rate
- 8.59%
- Cash-on-cash
- 8.20%
- DSCR
- 1.37
- GRM
- 8.2
CMA / ARV
- ARV (on-the-fly)
- $198,273
- Comps found
- 9
Show comp detail 9 sales within ~0.75 mi
| Address | Dist | Beds/Ba | Sqft | Sold | Price | $/sf | Match |
|---|---|---|---|---|---|---|---|
| 1402 W Kent Dr W | 0.22mi | 4/2.0 | 2,297 (+1%) | 15mo | $55,000 | $24 | 72 |
| 1406 Carol St | 0.11mi | 3/2.0 (-1) | 1,972 (-14%) | 2mo | $235,000 | $119 | 62 |
| 1302 Dean St | 0.04mi | 3/2.0 (-1) | 1,965 (-14%) | 7mo | $150,000 | $76 | 61 |
| 612 Cody St | 0.63mi | 3/2.5 (-1) | 2,302 (+1%) | 5mo | $182,400 | $79 | 58 |
| 555 Mustang St | 0.61mi | 4/3.0 | 2,130 (-6%) | 11mo | $220,000 | $103 | 52 |
| 204 W Elizabeth St W | 0.56mi | 3/2.5 (-1) | 2,226 (-2%) | 13mo | $205,000 | $92 | 52 |
| 1309 Mathew St | 0.68mi | 3/2.5 (-1) | 2,230 (-2%) | 16mo | $164,000 | $74 | 44 |
| 735 Urban St | 0.68mi | 4/1.5 | 1,998 (-12%) | 4mo | $184,000 | $92 | 38 |
| 608 Cody St | 0.62mi | 3/2.0 (-1) | 1,958 (-14%) | 15mo | $170,000 | $87 | 26 |
Match score weights: distance 35% · size 25% · config 20% · recency 20%. Top-matched comps best support the ARV.
Projected returns pro-forma
-3.0% appreciation · 7.65% rent growth · sell at horizon
- IRR
- 0.8%
- Equity multiple
- 1.03×
- Total profit
- $2,381
- Equity at exit
- $38,021
- IRR
- 14.4%
- Equity multiple
- 2.39×
- Total profit
- $99,128
- Equity at exit
- $22,048
Cash invested: $71,400 (down + closing). Projections, not guarantees.
Landlord ↔ Tenant lean methodology
- Overall (STATE)
- 90 Strongly Landlord-Friendly
- State Louisiana
- 90 Strongly Landlord-Friendly · R+12
- County
- — inherits STATE
- City
- — inherits STATE
ZIP-level market 70663
- Rents YoY
- 7.7%
- Active inventory
- 294
- Price-to-rent
- 8.2×
Monthly cashflow live
- Estimated rent
- $2,593 medium interval (Pro) →
- Mortgage (P&I)
- −$1,337
- Tax from tax record
- −$117 /mo · $1,398/yr
- Insurance
- −$106
- HOA
- −$0
- Vacancy / Maint / Mgmt
- −$544
- Net cashflow
- $488
Break-even live
Sensitivity live
| Price | -10% $632 | -5% $560 | +0% $488 | +5% $416 | +10% $344 |
|---|---|---|---|---|---|
| Rent | -10% $283 | -5% $386 | +0% $488 | +5% $591 | +10% $693 |
| Rate | -1.0pp $617 | -0.5pp $553 | base $488 | +0.5pp $422 | +1.0pp $355 |
UW: 25.0% down · 7.5% · 30yr · 1.5% tax · 5.0% vac · 8.0% maint · 8.0% mgmt
Financing live
Cash to close
- Down payment
- $63,750
- Closing costs
- $7,650
- Reserves months
- —
- Total cash needed
- —
Loan-product check · same deal, 3 products live
Conventional
25% down · 7.5% · 30yr
- Down + closing
- —
- Monthly P&I
- —
- Monthly cashflow
- —
- DSCR
- —
- Eligible?
- —
Personal DTI + credit; lowest rate.
DSCR
20% down · 8.5% · 30yr
- Down + closing
- —
- Monthly P&I
- —
- Monthly cashflow
- —
- DSCR
- —
- Eligible?
- —
No personal income docs; deal must DSCR.
Hard money
10% down · 12.0% · 12mo
- Down + closing
- —
- Monthly P&I
- —
- Monthly cashflow
- —
- DSCR
- —
- Eligible?
- —
Short-term bridge; refi at stabilization.
Rent comps 2 comps
| Address | Beds | Baths | Sqft | Rent | $/sqft | DOM | Units | Dist |
|---|---|---|---|---|---|---|---|---|
| 708 Alabama St Sulphur, LA | 4.0 | 2.5 | 2335 | $2,800 | $1.20 | 22d | 1 | 1.08mi |
| 1408 Christie Dr Sulphur, LA | 3.0 | 2.0 | 1794 | $4,250 | $2.37 | 45d | 1 | 1.20mi |
Listing history 3 events
-
2026-06-21days on market $255,000 Active 3 DOM
-
2026-06-19remarks 699-char remark
-
2026-06-19$255,000 Active 1 DOM
ⓘ Source: listings_history table (triggers on properties + properties_extension) + one-shot
backfill from property_details.listing_events for pre-trigger history.
Tax reassessment forecast LA · Resets to sale price
- Current annual tax
- $1,398 · $117/mo
- Projected year-2 tax
- $1,402 · $117/mo
- Expected delta
- +$4/yr ($0/mo · 0.3%)
ⓘ Screening estimate from a state-policy table — verify with the county assessor before closing.
Climate risk First Street
- Flood 3/10 Moderate FEMA zone X (unshaded) · 10% chance over 30 yrs
- Wildfire 2/10 Low
- Heat 9/10 Extreme 7 d/yr ≥109°F today · 23 d/yr by 30 yrs out
- Wind 9/10 Extreme 99% chance of damaging wind over 30 yrs
- Air quality 2/10 Low 1 unhealthy d/yr today · 1 by 30 yrs out
Nearby sold comps map
Loading sold comps map…
Walkable amenities ~0.75 mi
Loading nearby amenities…
Taxation est. · year 1
- Rental income
- $31,111
- − Mortgage interest
- −$14,284
- − Property taxes
- −$1,398
- − Insurance
- −$1,275
- − Repairs & maintenance
- −$2,489
- − Management
- −$2,489
- − Depreciation
- −$7,418
- Taxable income
- $1,758
- Est. tax owed @ 24.0%
- −$422
- After-tax cash flow
- $5,436/yr
For passive investors: Depreciation is non-cash, so a rental often shows a tax loss while cash-flowing — sheltering income. Rental losses are passive: they offset passive income freely, and up to $25,000/yr can offset ordinary (W-2) income if you actively participate and your MAGI is under $100k (phasing out to $0 by $150k); unused losses carry forward. On sale, claimed depreciation is recaptured at up to 25%, and gains may owe capital-gains tax (a 1031 exchange can defer both). Figures are a year-1 estimate at your 24.0% rate — not tax advice; consult a CPA.
Schools (NCES district)
- District
- Calcasieu Parish
- NCES district ID
- 2200330
- Math proficiency
- 30% ▼ -39.00%
- Reading proficiency
- 44% ▼ -33.00%
- Median HH income
- $44,700
- Composite
- 31.45/100
- National rank
- #5979
- State rank
- #29 of 98 in LA
Livability — Sulphur
- Score
- 71/100
- State rank
- #48
- US rank
- #7164
Category grades
Schools grade is shown separately in the Schools card above.
Census & demographics
- Census place
- Sulphur, LA
- County
- Calcasieu Parish · 170,889 people
- City population
- 27,799
- Metro
- Lake Charles, LA
- Population (ZIP)
- 27,799
- Household income
- $64,707
- Rent vs Own
- Severe rent burden
- 197.0
Population outlook (Calcasieu County) Hauer SSP2
- Today (2025)
- 212,179 people
- By 2030
- 218,199 · +2.8%
- By 2040
- 228,486 · +7.7%
- By 2050
- 236,208 · +11.3%
- By 2075
- 251,696 · +18.6%
- By 2100
- 247,848 · +16.8%
Race, ethnicity, and origin ACS 2023
- Neighborhood character
- Predominantly White (82%)
- Race & ethnicity
- White 82% Black 8% Hispanic / Latino 5% Two or more races 4%
- Common ancestry
- Lithuanian 13% Slovak 2% Scandinavian 1%
- Foreign-born
- 3% · Canada, Vietnam
- Languages at home
- 94% English-only · Spanish 2% French/Haitian/Cajun 2% Other Indo-European 1%
Political lean MEDSL · Calcasieu
- 2024 margin
- Solid R (+39.6) · D 29.5% · R 69.0% · Other 1.5%
- 2008→2024 swing
- -15.0pp toward R · 2008: -24.6pp · 2024: -39.6pp
- All cycles
- 2024: R+39.6 2020: R+35.2 2016: R+33.3 2012: R+28.7 2008: R+24.6
Not yet ingested
- Civics
- —
Market trends
- HPI YoY
- ▼ -104.29%
- Current HPI
- 100.0895
- Rent YoY
- ▲ 7.65%
- Metro
- Lake Charles, LA
- State GDP YoY
- ▲ 3.29%
- F500 in state
- 10
Industry mix (Fortune 500 HQ in LA)
| Industry | F500 HQs | Revenue |
|---|---|---|
| Telecommunications | 2 | $23B |
|
||
| Utilities | 1 | $12B |
|
||
| Wholesale / Distribution | 1 | $5B |
|
||
| Advertising | 1 | $2B |
|
||
Price history
+18.6% since first listed9 events — show timeline
- 2026-06-18 Listed $255,000 SWLAR
- 2023-06-06 Sold (Public Records) $237,500 Public Records
- 2023-04-28 Sold (MLS) — SWLAR
- 2023-01-10 Listed $239,500 SWLAR
- 2022-09-16 Sold (MLS) — SWLAR
- 2022-03-22 Listed $99,000 SWLAR
- 2018-07-24 Sold (Public Records) $215,000 Public Records
- 2018-07-23 Sold (MLS) — SWLAR
- 2018-06-03 Listed $215,000 SWLAR
Property tax history
+3.6%/yrLatest (2025): $1,398 · +0.8% YoY. Source: county tax records.
Cash-flow waterfall
monthlySold comps — $/sqft
last 12 mo · ≤1 miLoading sold comps…