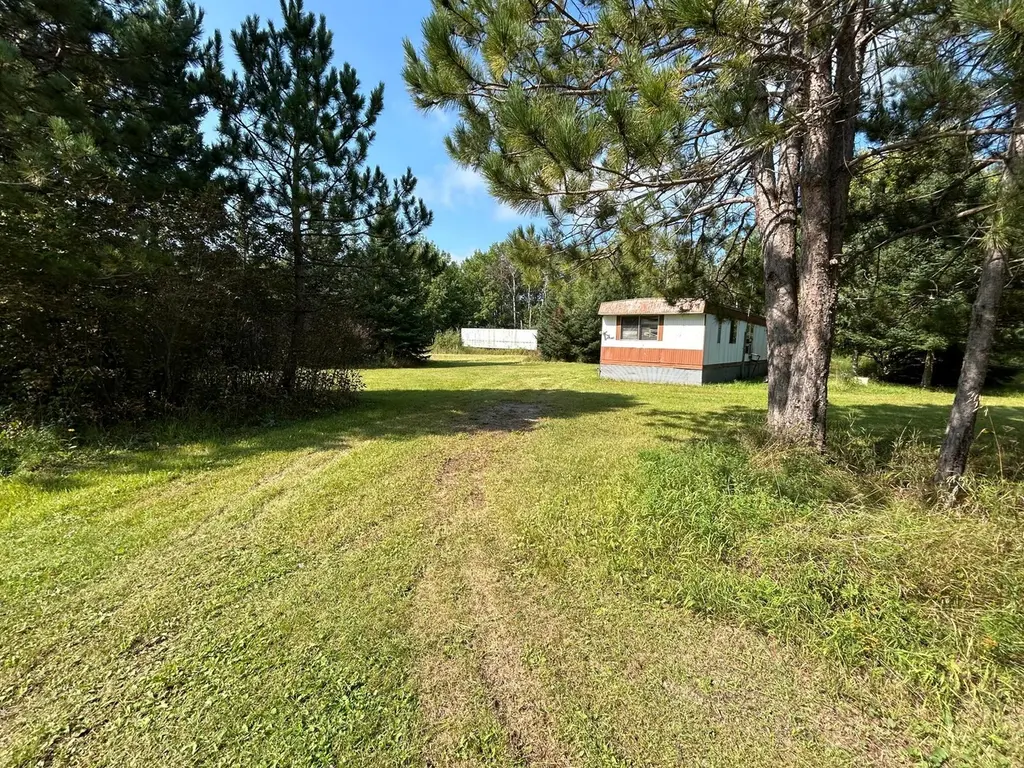
10629 Town Rd 34 · Mizpah, MN
Flood risk 1/10 · Minimal
- FEMA flood zone
- X (unshaded)
- Chance of flooding over 30 yrs
- 0.0%
- Est. flood insurance / yr
- $507 – $1,088
Fire risk 4/10 · Minor
- Est. fire insurance / yr
- $888 – $1,650
Heat risk 1/10 · Minimal
- Hot days now (above 92°F)
- 7 days/yr
- Hot days in 30 yrs
- 12 days/yr
Wind risk 1/10 · Minimal
- Chance of severe wind over 30 yrs
- —
Air-quality risk 2/10 · Minimal
- Unhealthy air days now
- 1 days/yr
- Unhealthy air days in 30 yrs
- 2 days/yr
Risk factors via First Street. Map © Google.
Why this score? — see what drove the B grade
The composite is a weighted blend of 9 inputs, each scored 0–100. Each bar is that input's sub-score; the figure is the points it added to the 100-point composite (weight × sub-score).
- Cash flow +30.0/30.0
- 1% rule +10.0/10.0
- DSCR +10.0/10.0
- ARV discount +7.5/15.0
- Appreciation +5.0/10.0
- Schools +4.0/10.0
- Livability +3.0/5.0
- Rent growth +2.5/5.0
- Condition / age +2.5/5.0
$44,900
🖨 Deal sheet (PDF) 📄 Offer letter ✓ Due diligence
Listing remarks
1.45ac neighboring the Blue Ox Trail with well and septic. Home is not livable. Semi trailer is used for storage shed.
Key facts
- 1.45 acre lot
- Built 1960
- Listed 63 days
Property features AI
Finance
- Financial info: $182 annual tax (2025)
Exterior
- Parking: Driveway with non-paved/other surface
- Utilities: Private water source; Private sewer; Other fuel type
- Home design: Residential property; Single-story (one level); Manufactured home
- Construction: Block foundation
- Exterior features: Metal exterior; Other outbuilding/structure on the property; Lot approximately 1.45 acres (dimensions: 356 x 300 x 94 x 400)
Interior
- Bedrooms: 2 bedrooms
- Bathrooms: 1 full bathroom
- Heating & cooling: No heating system listed; No cooling system listed
- Interior features: Has basement (no finished basement features listed)
Neighborhood map
What this means for you Summary
Snapshot
- This is a 2-bed/1.0-bath manufactured listed at $45k.
Deal economics
- At list price, monthly cash flow is $272 ($3k/yr) — positive.
- The deal already cash-flows at list — no discount required.
- Meets the 1% rule at list price ($677 rent vs $45k).
- Recommended offer: $42k (6.0% below list) — sets the bar for market timing.
Location & tenants
- Location reads 59/100 on livability (#797 in MN) — a working-class tenant base; expect higher turnover. Strengths: cost of living A+, housing A+; Watch: health & safety C-, crime D-, amenities F.
- South Koochiching School District (rural): math 45% / reading 45% proficiency, ranked #333 of 467 in MN (top 71%) — families likely to look elsewhere, expect single-tenant / working-renter base with shorter leases.
- Zoned schools: Northome Elementary (math 44% / reading 54%, grade D, #423 of 857 statewide, top 55%, 84 students, 63% FRL); Northome Secondary (math 15% / reading 44%, grade F, #349 of 471 statewide, top 75%, 84 students, 57% FRL) — zoned schools average 60% FRL vs 45% district-wide (16 pts higher); higher-poverty schools than district average — tighter screening recommended.
- Market conditions: 5 active listings in the ZIP; 26 units permitted in Koochiching County in 2024 (0 in 5+ unit buildings).
Forward outlook
- In year one you build about $2k of equity ($310 loan paydown + $1k appreciation (3.0% local appreciation)).
- Koochiching County population projected at -27% by 2050 — secular population decline; favor cash flow + early exit over multi-decade hold.
- At projected returns (3.0% appreciation + 3.0% rent growth), your $13k cash investment doubles in ~3 years — after that, you're playing with house money.
Negotiation context
- It's been on market 63 days — a 6% lower offer ($42k) is reasonable based on typical stale-listing flexibility.
- 2 sale attempts; this cycle's ask has dropped $5k (10%) from the opening price — seller is motivated, your offer sets the floor, not the list.
- Current owner paid $12k; list at $45k implies a 259% gain — meaningful room to come down on a strong offer.
Questions for the listing agent
- It's been on market 63 days. Have you received any prior offers? Is the seller open to a 6% concession, seller financing, or rate buy-down credit?
- Built in 1960 — when were the roof, HVAC, electrical panel, plumbing, and water heater last replaced?
- Why hasn't it sold? Are there any deal-killer items the seller is aware of (foundation, flood, title, zoning, code violations)?
- Is there a deadline driving the sale (1031 exchange, divorce, estate, relocation)? That informs how much negotiation room exists.
- Schools are F-rated, which usually means shorter tenancies and higher turnover. Who's the typical renter profile here, and what's been the actual vacancy rate?
- Crime grade is D in this area — have there been break-ins, vandalism, or insurance claims at this property in the last 3 years? What carrier currently insures it and at what premium?
- What's the average days-on-market for RENTAL listings here right now (not sales)? A rising rental-DOM trend means longer vacancies and softer asking-rent achievability than the comps imply.
- What's the recent tenant-quality profile in this submarket — average credit score on applications, eviction rate, late-payment / NSF rate, and stable-employment percentage? A property-management company in the area should have these aggregated.
- How much new for-sale + rental construction is in the pipeline within 1–3 miles? Heavy new supply typically softens prices + rents 12–24 months out; constrained supply supports both.
Investment metrics
- 1% rule
- 1.51% ✓
- Cap rate
- 13.55%
- Cash-on-cash
- 25.93%
- DSCR
- 2.15
- GRM
- 5.5
CMA / ARV
No comps found within radius.
Projected returns pro-forma
3.0% appreciation · 3.0% rent growth · sell at horizon
- IRR
- 31.9%
- Equity multiple
- 2.81×
- Total profit
- $22,695
- Equity at exit
- $20,189
- IRR
- 32.2%
- Equity multiple
- 5.50×
- Total profit
- $56,522
- Equity at exit
- $31,114
Cash invested: $12,572 (down + closing). Projections, not guarantees.
Landlord ↔ Tenant lean methodology
- Overall (STATE)
- 46 Balanced
- State Minnesota
- 46 Balanced · D+2
- County
- — inherits STATE
- City
- — inherits STATE
ZIP-level market 56660
- Active inventory
- 5
- Price-to-rent
- 5.5×
Monthly cashflow live
- Estimated rent
- $677 medium interval (Pro) →
- Mortgage (P&I)
- −$235
- Tax from tax record
- −$9 /mo · $112/yr
- Insurance
- −$19
- HOA
- −$0
- Lot rent leased land?
- −$0
- Vacancy / Maint / Mgmt
- −$142
- Net cashflow
- $272
Break-even live
Sensitivity live
| Price | -10% $297 | -5% $284 | +0% $272 | +5% $259 | +10% $246 |
|---|---|---|---|---|---|
| Rent | -10% $218 | -5% $245 | +0% $272 | +5% $298 | +10% $325 |
| Rate | -1.0pp $294 | -0.5pp $283 | base $272 | +0.5pp $260 | +1.0pp $248 |
UW: 25.0% down · 7.5% · 30yr · 1.5% tax · 5.0% vac · 8.0% maint · 8.0% mgmt
Financing live
Cash to close
- Down payment
- $11,225
- Closing costs
- $1,347
- Reserves months
- —
- Total cash needed
- —
Loan-product check · same deal, 3 products live
Conventional
25% down · 7.5% · 30yr
- Down + closing
- —
- Monthly P&I
- —
- Monthly cashflow
- —
- DSCR
- —
- Eligible?
- —
Personal DTI + credit; lowest rate.
DSCR
20% down · 8.5% · 30yr
- Down + closing
- —
- Monthly P&I
- —
- Monthly cashflow
- —
- DSCR
- —
- Eligible?
- —
No personal income docs; deal must DSCR.
Hard money
10% down · 12.0% · 12mo
- Down + closing
- —
- Monthly P&I
- —
- Monthly cashflow
- —
- DSCR
- —
- Eligible?
- —
Short-term bridge; refi at stabilization.
Listing history 22 events
-
2026-06-22days on market $44,900 Active 63 DOM
-
2026-06-21days on market $44,900 Active 62 DOM
-
2026-06-21days on market $44,900 Active 61 DOM
-
2026-06-18days on market $44,900 Active 59 DOM
-
2026-06-17days on market $44,900 Active 58 DOM
-
2026-06-16days on market $44,900 Active 57 DOM
-
2026-06-15days on market $44,900 Active 56 DOM
-
2026-06-13days on market $44,900 Active 54 DOM
-
2026-06-12pricedays on market $44,900 Active 53 DOM
-
2026-06-09days on market $49,900 Active 50 DOM
-
2026-06-08days on market $49,900 Active 49 DOM
-
2026-06-07days on market $49,900 Active 48 DOM
-
2026-06-05days on market $49,900 Active 46 DOM
-
2026-06-04days on market $49,900 Active 44 DOM
-
2026-06-02days on market $49,900 Active 43 DOM
-
2026-06-01days on market $49,900 Active 42 DOM
-
2026-05-31days on market $49,900 Active 41 DOM
-
2026-05-31days on market $49,900 Active 40 DOM
-
2026-04-20$49,900 Active 118-char remark
-
2026-03-10historical
-
2025-09-09$54,900 Active
-
2000-06-01soldstatus $12,500
ⓘ Source: listings_history table (triggers on properties + properties_extension) + one-shot
backfill from property_details.listing_events for pre-trigger history.
Tax reassessment forecast MN · Partial reset (capped growth)
- Current annual tax
- $112 · $9/mo
- Projected year-2 tax
- $307 · $26/mo
- Expected delta
- +$195/yr (+$16/mo · 174.5%)
ⓘ Screening estimate from a state-policy table — verify with the county assessor before closing.
Climate risk First Street
- Flood 1/10 Low FEMA zone X (unshaded) · 0% chance over 30 yrs
- Wildfire 4/10 Moderate
- Heat 1/10 Low 7 d/yr ≥92°F today · 12 d/yr by 30 yrs out
- Wind 1/10 Low
- Air quality 2/10 Low 1 unhealthy d/yr today · 2 by 30 yrs out
Nearby sold comps map
Loading sold comps map…
Walkable amenities ~0.75 mi
Loading nearby amenities…
Taxation est. · year 1
- Rental income
- $8,130
- − Mortgage interest
- −$2,515
- − Property taxes
- −$112
- − Insurance
- −$224
- − Repairs & maintenance
- −$650
- − Management
- −$650
- − Depreciation
- −$1,306
- Taxable income
- $2,671
- Est. tax owed @ 24.0%
- −$641
- After-tax cash flow
- $2,619/yr
For passive investors: Depreciation is non-cash, so a rental often shows a tax loss while cash-flowing — sheltering income. Rental losses are passive: they offset passive income freely, and up to $25,000/yr can offset ordinary (W-2) income if you actively participate and your MAGI is under $100k (phasing out to $0 by $150k); unused losses carry forward. On sale, claimed depreciation is recaptured at up to 25%, and gains may owe capital-gains tax (a 1031 exchange can defer both). Figures are a year-1 estimate at your 24.0% rate — not tax advice; consult a CPA.
Schools (NCES district)
- District
- South Koochiching School District
- NCES district ID
- 2732700
- Math proficiency
- 45% ▬ 0.00%
- Reading proficiency
- 45% ▬ 0.00%
- Median HH income
- $40,157
- Composite
- 39.92/100
- National rank
- #7917
- State rank
- #333 of 467 in MN
Livability — Mizpah
- Score
- 59/100
- State rank
- #797
- US rank
- #20200
Category grades
Schools grade is shown separately in the Schools card above.
Census & demographics
- Population (ZIP)
- 265
Population outlook (Koochiching County) Hauer SSP2
- Today (2025)
- 11,977 people
- By 2030
- 11,406 · -4.8%
- By 2040
- 10,045 · -16.1%
- By 2050
- 8,746 · -27.0%
- By 2075
- 6,363 · -46.9%
- By 2100
- 4,275 · -64.3%
Race, ethnicity, and origin ACS 2023
- Neighborhood character
- Predominantly White (94%)
- Race & ethnicity
- White 94% Two or more races 3% Native American 2% Black 1%
- Common ancestry
- Slovene 9% Portuguese 9% Iranian 8%
- Foreign-born
- 1%
- Languages at home
- 98% English-only · German/W. Germanic 1%
Political lean MEDSL · Koochiching
- 2024 margin
- Strong R (+25.7) · D 36.4% · R 62.0% · Other 1.6%
- 2008→2024 swing
- -35.8pp toward R · 2008: 10.1pp · 2024: -25.7pp
- All cycles
- 2024: R+25.7 2020: R+21.3 2016: R+20.0 2012: D+9.5 2008: D+10.1
Not yet ingested
- Civics
- —
Market trends
- HPI YoY
- —
- Current HPI
- —
- Rent YoY
- —
- Metro
- —
- State GDP YoY
- ▲ 2.41%
- F500 in state
- 34
Industry mix (Fortune 500 HQ in MN)
| Industry | F500 HQs | Revenue |
|---|---|---|
| Healthcare | 2 | $407B |
|
||
| Retail | 2 | $150B |
|
||
| Consumer Goods | 2 | $32B |
|
||
| Industrial Machinery | 2 | $6B |
|
||
| Agriculture | 1 | $40B |
|
||
| Healthcare / Medical Devices | 1 | $32B |
|
||
Price history
+259.2% since first listed5 events — show timeline
- 2026-06-11 Price Changed $44,900 NORTHSTARMLS as Distributed by MLS Grid
- 2026-04-20 Listed $49,900 NORTHSTARMLS as Distributed by MLS Grid
- 2026-03-10 Listing Removed — NORTHSTARMLS as Distributed by MLS Grid
- 2025-09-09 Listed $54,900 NORTHSTARMLS as Distributed by MLS Grid
- 2000-06-01 Sold (Public Records) $12,500 Public Records
Property tax history
-0.8%/yrLatest (2026): $112 · -38.5% YoY. Source: county tax records.
Cash-flow waterfall
monthlySold comps — $/sqft
last 12 mo · ≤1 miLoading sold comps…